Tideways 2024.2 Release
Get the cake, Tideways is turning ten!
Exactly on this day ten years ago, we lifted the veil on Tideways’ predecessor and thus began our exciting journey that continues to this day.
We would like to celebrate by presenting interesting new features to you.
Summary:
- Differential Flame Graph
- Share Trace Comparison
- Dynamic Instrumentation for Functions from the UI
- Transaction Failure Rate Alerts
- IDE Integrations
- Improved Stacktraces from Third Party Libraries
- FrankenPHP Support
- WoltLab Suite Support
Don’t miss out on our webinar that will guide you through these new features, taking place July 3rd starting at 3 pm.
Go to the registration page and sign up to be able to join the webinar.
Differential Flame Graph
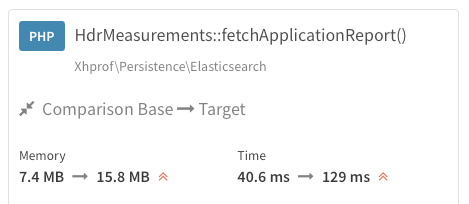
Differential Flame Graphs are a visual representation of a comparison between two sets of profiling data and is a beneficial tool for quickly identifying the root causes of performance problems. To benefit best from the findings, in Tideways they are presented in a comprehensible comparison box which shows the comparison base and the target, a summary and an example span. Unlike before, it’s now possible to see at a glance why a trace has become faster or slower.
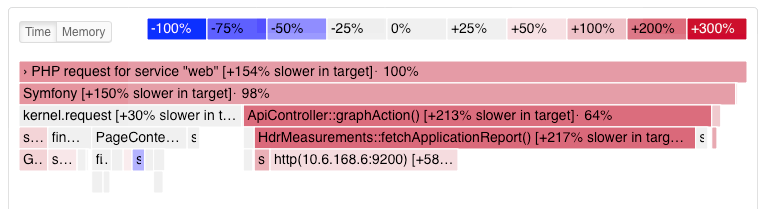
It’s useful for instance to check whether a change in the source code, a system update or a configuration change improved performance or brought about a regression. It’s also possible to compare traces from different time periods or of different system states.
The color code depicts the most common way Differential Flame Graphs are presented. Red colors, alert you to an increase in execution time or resource usage. Blue, on the other hand, depicts a decrease. There are different shades of blue and red to depict minor or major decreases and increases. Neutral colors mean that no significant change has occurred.
Our Differential Flame Graph is interactive; you can hover over or click on the different areas to get more specific information.
The high level of detail helps to find an unwanted outlier in time or memory consumption faster.
Changelog: Differential Flame Graph
Share Trace Comparison
The comparison of two traces can now be shared with persons who don’t have a Tideways account or are not members of the respective organization. This is an immensely helpful addition to the existing feature that already allowed the sharing of a single trace.
You can click the share action directly from a trace comparison and share a link to it. That makes investigating performance problems and validating improvements much easier.
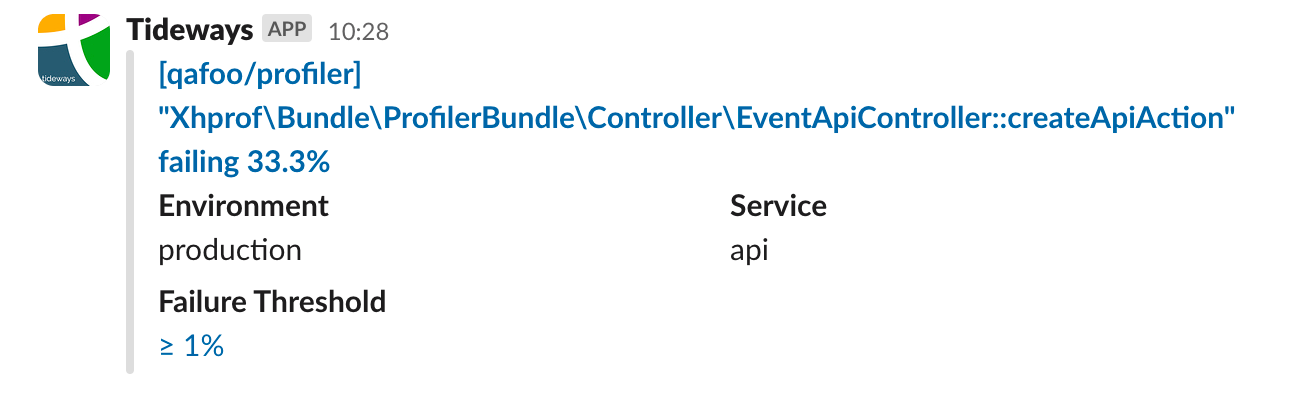
When sharing a trace in Slack or in other chat / social media tools, a preview is generated to offer the message receivers a summary:
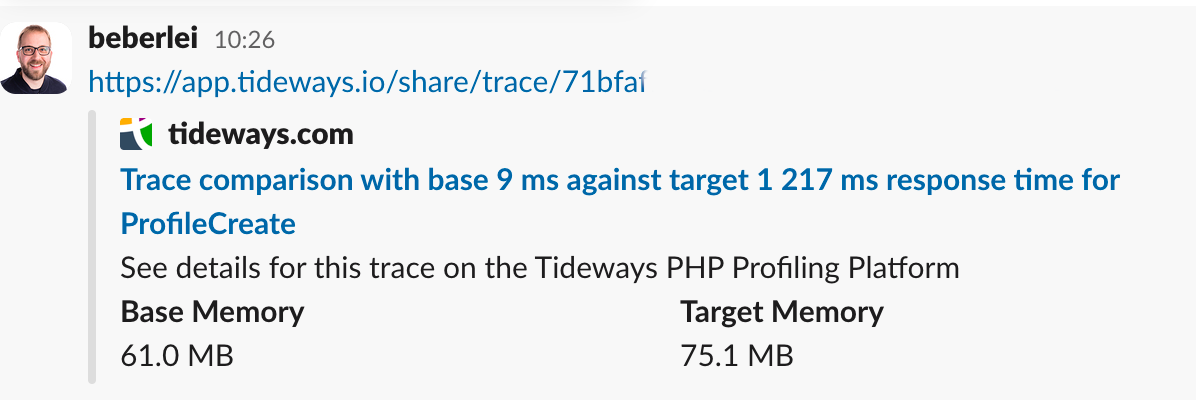
Changelog: Share Trace Comparison
Dynamic Instrumentation for Functions from the UI
Dynamically instrumented functions are a new feature within Tideways to improve Profiling data and in turn identify performance problems even faster.
Previously, instrumentation was either defined within the Tideways extensions and could be added by changing the code to use the attribute #[WithSpan]. Now you can add instrumentation to your functions by simply clicking the “Dynamically Instrument Function” button from the callgraph interface.
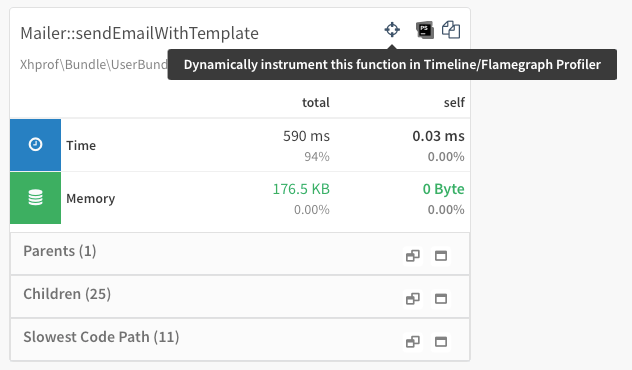
No changes in your application code or deployment of a new version needed!
Documentation: Instrument Functions from the UI
Changelog: Dynamically Instrument Functions
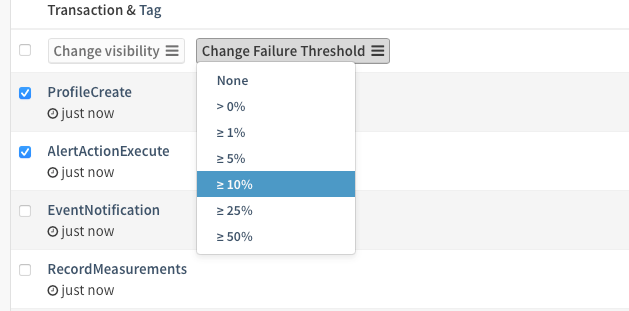
Transaction Failure Rate Alerts
What failure rate is acceptable for individual transactions? To find out what causes errors in one specific transaction, a failure threshold can be set for each individual transaction. The failure threshold is based on a list of predefined percentages and can be configured via the transaction settings page.
To that end, you can set up a notification under “Project Settings > Notifications”. You then get notified via Slack or email or other supported integrations when the failure rate for a transaction increases and it needs attention to be resolved.
For more details on how to configure it view our documentation.
IDE Integrations
You can now use the “Open in IDE” icon in Errors and Callgraphs. This makes it easier to directly switch from Tideways into the code and start fixing a bug or performance problem.
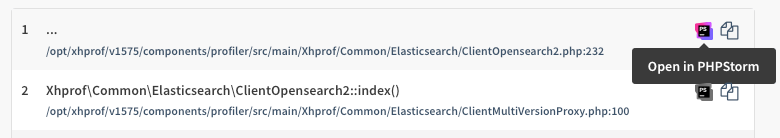
At the moment you can configure this integration for PhpStorm and VSCode. For third party libraries you can also directly jump to the code on GitHub without the need to configure anything.
For more details view our documentation.
PHP Extension:
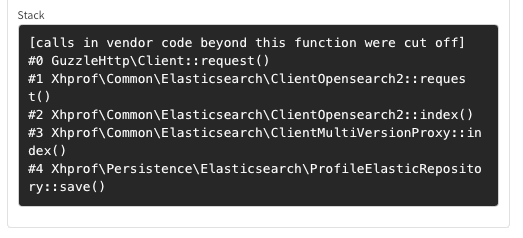
Improved Stacktraces from Third Party Libraries
For libraries such as Doctrine, Guzzle and Laravel, stacktraces in the Timeline Profiler are now modified to show primarily frames from your code-base and not from the library. Before, due to the limiting of the stackframes size they sometimes included only frames from the library itself and no indication where in the application they occurred. Relevant ones were sometimes cut off. Now, the stacktrace is cut off to show primarily application-code function calls.
In addition we reduced the default duration for a span to keep its stacktrace from 5ms to 3ms and increased the number of stacktraces Tideways keeps per trace across plans.
FrankenPHP Support
Tideways is the first APM solution that fully supports FrankenPHP, including worker mode. Starting from PHP extension 5.8.0, Tideways supports FrankenPHP.
Worker mode only loads your framework once into memory. Subsequently, it sends requests to the same instance of your application and doesn’t spin up a new instance for every new web request.
That means that one gives up the shared nothing of for example PHP-FPM or even FrankenPHP without worker mode but saves time and optimizes performance.
For more details on how to use FrankenPHP with Tideways see our changelog entry and our documentation.
WoltLab Suite Support
Tideways now also includes instrumentation of WoltLab Suite out of the box. The Tideways PHP Extension will automatically detect which type of page of your community has been accessed to automatically fill in the transaction name, making the collected data useful without requiring manual changes on your end.
You’ll never know until you try … our free trial!
