
Profiling & Tracing
Profiling & Tracing Ι Monitoring & APM Ι Error & Exception Tracking
Make application performance visible.
Tideways automatically collects and prioritizes traces by impact — the slow requests surface themselves, so you go from symptom to root cause in minutes.
Three Visualizations: Timeline, Flame Graph and Call Graph
Different performance problems need different approaches to detect and visualize: Tideways offers three different ways of visualizing as well as table-based views, so that you can tackle performance from every angle.
Analyze Every Function Call
Get detailed insights into every function call of your PHP requests with the Callgraph Profiler.
Compare profiles before and after you’ve optimized your code to measure the overall impact.
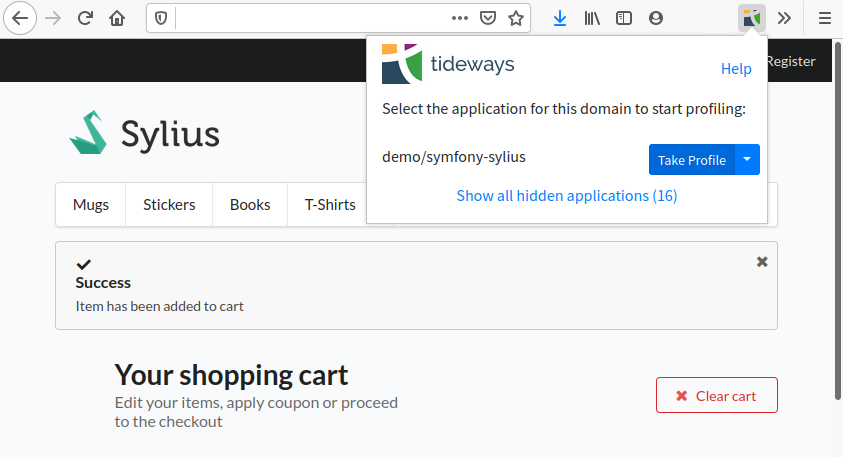
Click to Trigger the Profiler on Any Page of your Application
The Chrome Extension allows Profiling On-Demand, so that you can always get Timeline and Callgraph Profiler data of exactly the page that you are optimizing at the moment.
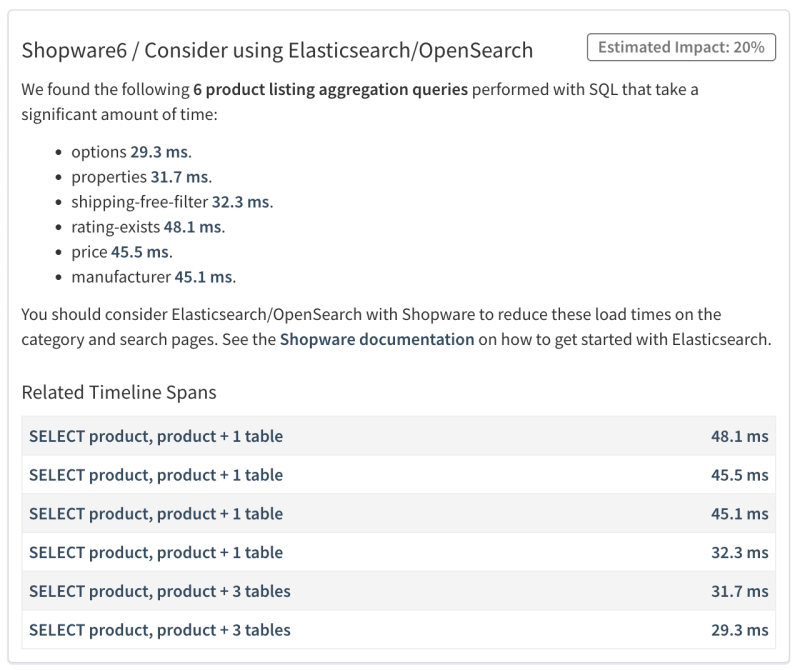
Actionable Insights for known Bottlenecks
Benefit from our expert knowledge with documented solutions and fixes to known bottlenecks directly.
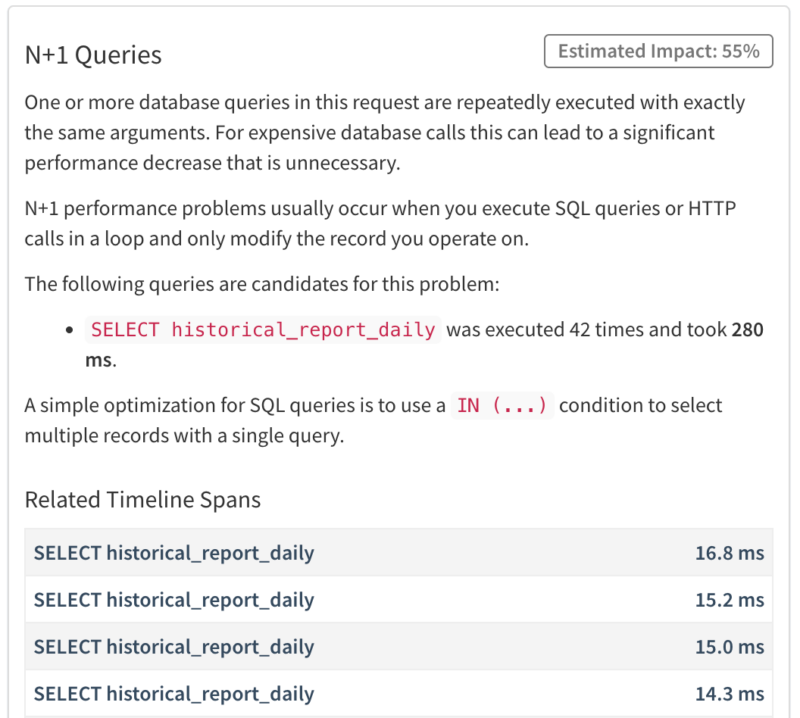
N+1 Query Detection
Detect queries that are executed over and over again in the same request, just with different parameters.
All Profiling & Tracing Features
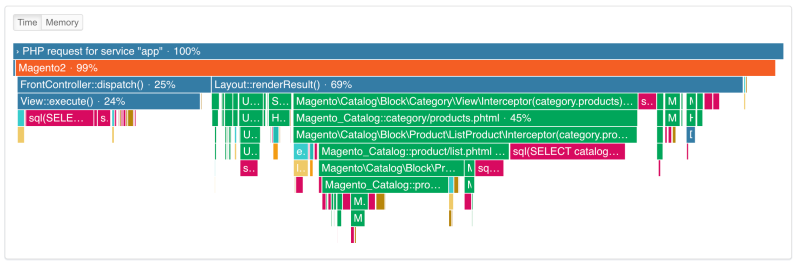
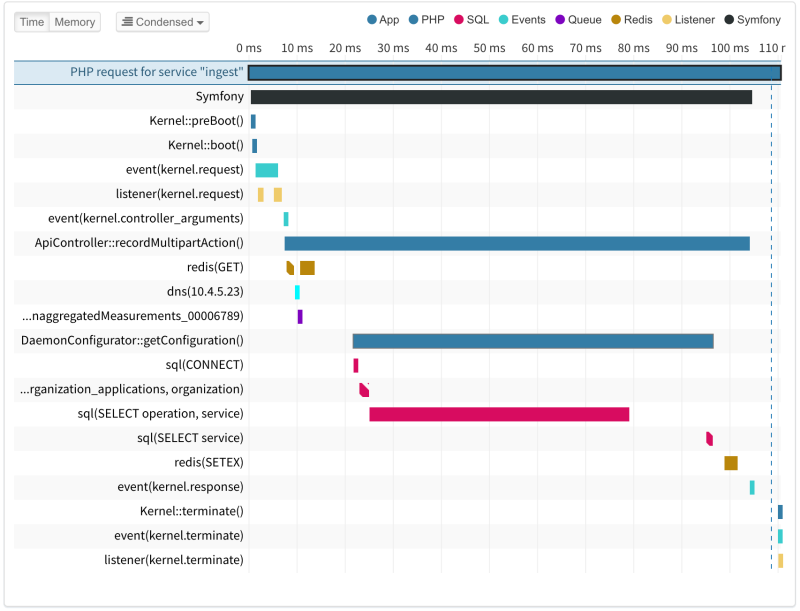
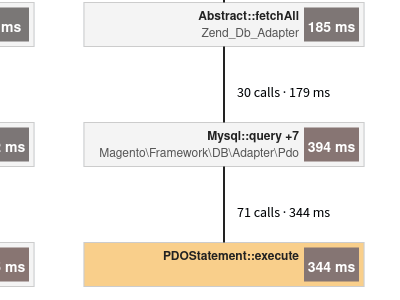
Timeline Profiler
Timeline Tracing
We collect very low-overhead timeline traces for applications in production giving you full visibility into your code.
Template Engine Support
Discover the performance of template rendering in your requests from engines such as Twig, Smarty 2 & 3, Laravel’s Blade and others.
N+1 Detection
Automatic detection of repeated queries and HTTP requests helps you fix one of the most dangerous performance bottleneck.
Trace SQL Queries
See an anonymized version of each SQL query, how long it takes and when its executed during the request.
Spot Bootstrapping Overhead
Tideways knows the internals of common PHP frameworks and can show you bootstrapping overhead such as event dispatching, resource allocation and configuration loading.
Customize Timeline
Customize the timeline view by instrumenting your frameworks, libraries and own code to add new spans for even more insights.
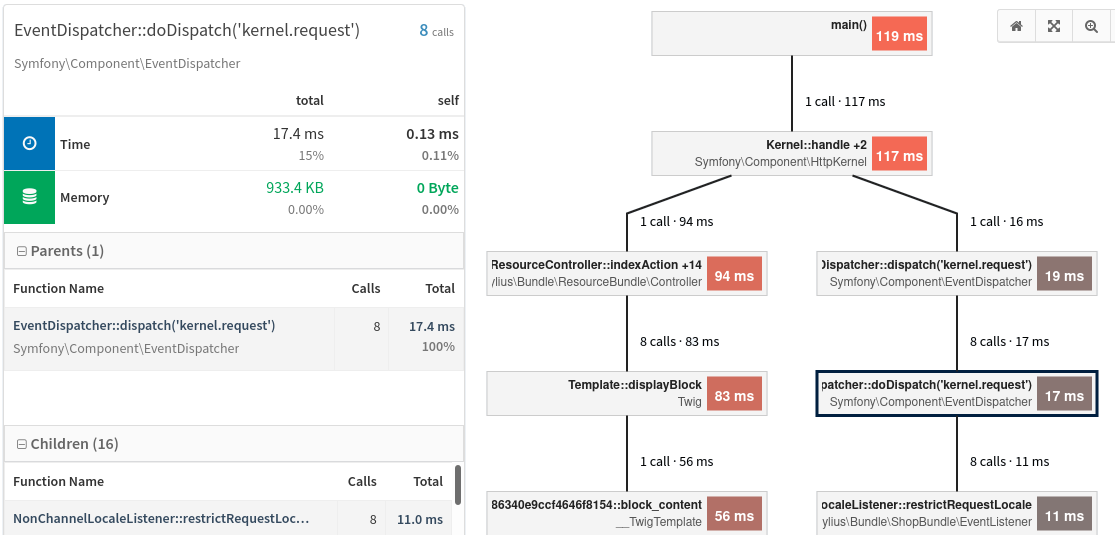
Callgraph Profiler
Dig deep into detailed callgraphs
When you are debugging performance problems a full callgraph can give detailed insights into every function call of your PHP requests.
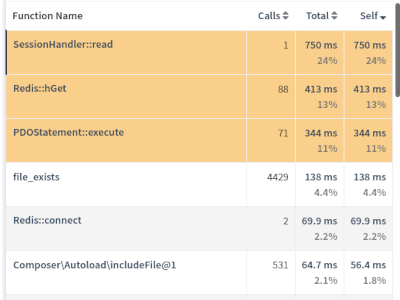
View Function Calls
Every function call during a request is listed with self and total duration and call count. Group and filter function calls by namespaces of your code and all the libraries you are using.
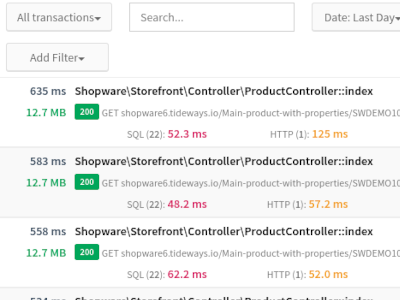
Search Traces and Callgraphs
A powerful search interface allows you to find all callgraph traces that match your criteria. Search by transaction name, URLs, servers and more.
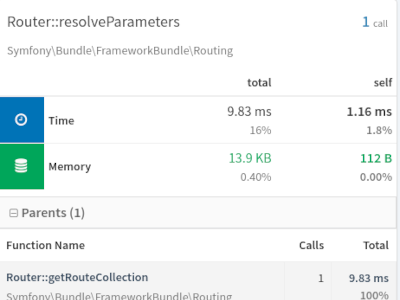
Duration and Memory Metrics
Both duration and memory metrics are collected for every function, its children and parents.
Compare Profiles
Start comparing profiles to find the cause for performance regressions and see your progress when improving code step by step.
Tracepoints
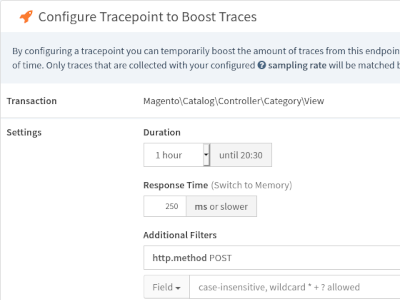
Boost Traces
Influence what traces Tideways collects and prioritizes by transactions and request criteria by creating Tracepoints. Activate the Callgraph Profiler On-Demand to get more in depth information.
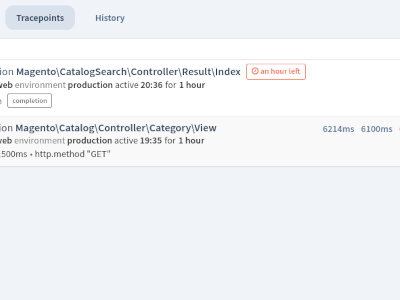
Traces collected in Realtime
Requests from users will be matched against tracepoint criteria in realtime and can be analysed from Tideways UI.
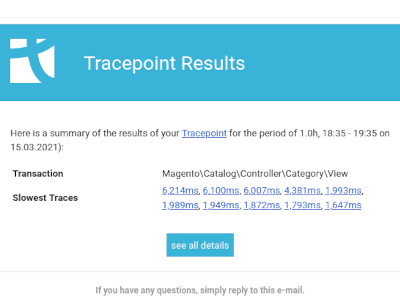
Notification about Tracepoint Results
After the tracepoint period ends a report with the most interesting traces is sent via E-Mail, Slack or Microsoft Teams.
Developer Triggered Traces
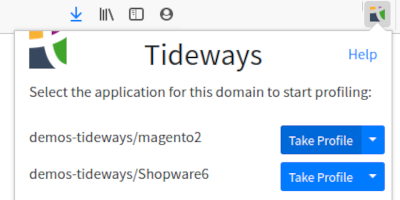
Chrome Extension to Trigger Traces
Full control over trace triggering, no need to rely on an algorithm to pick the right traces, just use the extension right on the page to investigate.
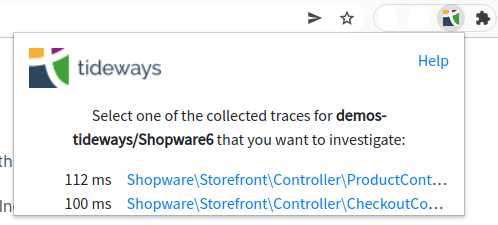
Directly Switch to Triggered Traces
Immediately investigate the cause for page slowness by switching to collected Tideways trace and callgraph.
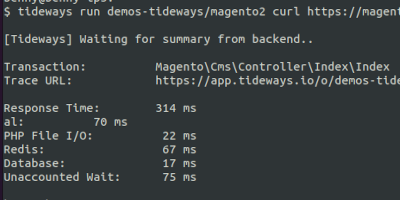
Use CLI to Trigger Traces
The commandline allows to trigger traces for cronjobs, APIs and is the building block for automating trace triggering in build scripts and deployments.
See other features of Tideways: Monitoring, Profiling and Exception Tracking that give you insights into the performance of your application