
Comparison
The 6 Best PHP Profilers
A great PHP Profiler should make it easy to capture insightful profiling data in every scenario, including Web-request, REST-API, Mobile, Command Line, Cronjobs, Worker Queues, Development, and Production.
Historically, utilizing one of the available open source PHP Profilers required extensive setup work and then the Profiler was primarily used for development purposes only. Until you had the chance to look at data and solve a performance bottleneck, many hours were already on the clock.
In 2026, we can do better than that. The following high-level features are critical for any PHP Profiler to be useable and instantly ready for action when the need for profiling data presents itself:
- Easy installation and configuration.
- Usable in Production.
- Multiple ways to trigger profiling in many different situations.
- In-depth context for each profiling snapshot with a profound understanding of common PHP programming platforms and frameworks.
- High- and Low-Level visualizations that help see the forest for the tree in profiling data.
Prior to my creation of Tideways, I frequently spent considerable time setting up profiling environments for customers in production. After a brief honeymoon period, they remain largely unused by developers due to the time-consuming and cumbersome process of initiating and obtaining profiling data. Also, the results were difficult to interpret.
Choosing the Best PHP Profiler
This blog post introduces you to the best PHP Profilers available. It is a helpful list that you can use to make your decision. Whether you are developing a customized PHP application based on a framework such as Laravel or Symfony or a platform such as WordPress, Magento, or Shopware, the information provided gives you an all-round view. There is valuable information if you are seeking a fully integrated closed-source solution, and also if a customizable open-source solution is the way to go for you:
Let’s take a look!
Tideways
A brief overview of how the Tideways PHP Profiler works
Images are worth more than a thousand words. You can learn about profiling and detecting a bottleneck with Tideways by watching this slideshow:
Or watch this 3:49 minute video for a more comprehensive overview of Tideways.
Multiple Visualizations for different use-cases: Timeline, Flame Graph, Call Graph
Performance problems in PHP code have many different causes and detecting them requires different visualizations and data-collection approaches. Tideways is essentially multiple different Profilers in one, offering three different visualizations that are based on two different profiling data-sources.
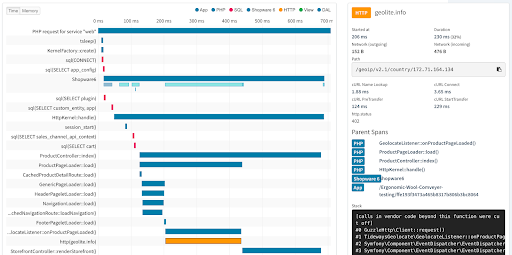
The Timeline view provides a high-level overview of where the time is spent in a request, in sequential order starting from 0 ms at the beginning to the end of the request. It sources its data from a known list of PHP functions and methods across core language APIs, libraries, and frameworks.
You can see large blockers of time, such as a slow SQL query or HTTP request like the “geolite.info” geolocation HTTP call in this example. The stacktrace on the right directly points to the code location of this slowness in a “GeolocateListener::onProductPageLoaded” method.
The flame graph view is based on the same data source of PHP functions and methods. It is not sequentially sorted and groups similar, repeated calls into a single block. As such, it is better suited to find shorter calls that make up a large amount of the request, such as this SQL query on the “service” table here that is called 25 times or the HTTP calls in yellow that are repeated as well:

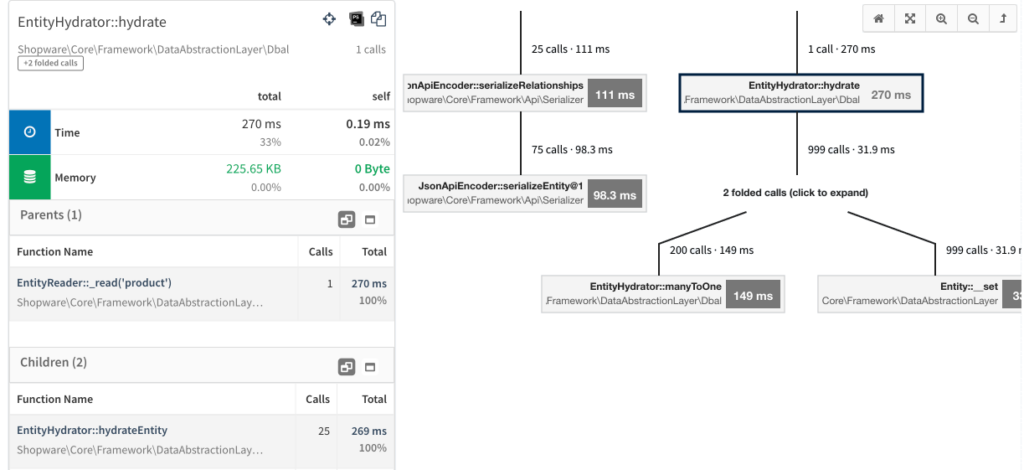
Lastly, the call graph visualization is based on a second data source of all functions in the PHP script under profiling. It will allow you to spot any bottleneck that Tideways is not looking for explicitly, most notably algorithmic problems in PHP and any inefficient code.
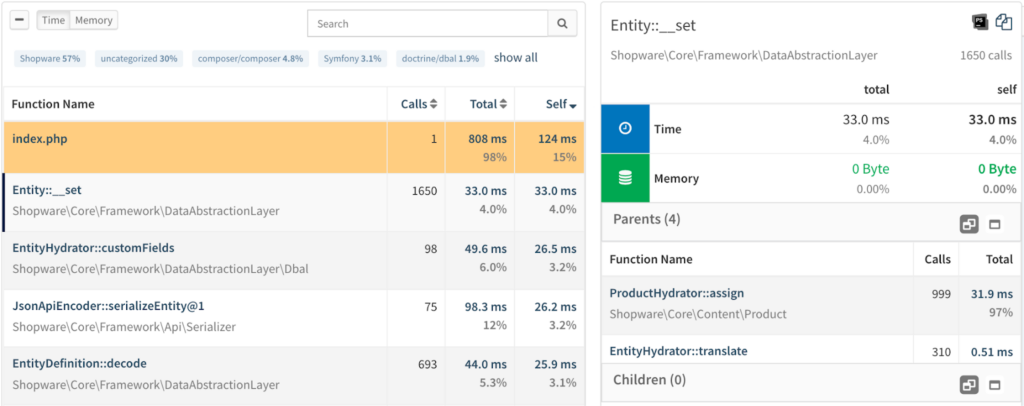
If you are more the data-table detective and prefer a table over a visualization, then Tideways has you covered with sortable, filterable list views of all profiling data.
Trigger Profiling Everywhere with 1 Click or Command
Tideways makes it easy to capture a profiling snapshot in any context that your PHP application could run in. This gives you and even colleagues who rarely use the Profiler a quick option to see insightful data:
- Continuously from regular users with random sampling
The most convenient method of accessing profiling data in Tideways is through snapshots created for requests made by regular users in production. For maximum visibility into your application’s performance, Tideways randomly collects a few traces every minute, focusing on spreading traces out for different pages and scripts throughout the day. The overhead of Tideways’ collecting traces is in the low single-digits, and the insights it provides make up for it many times.
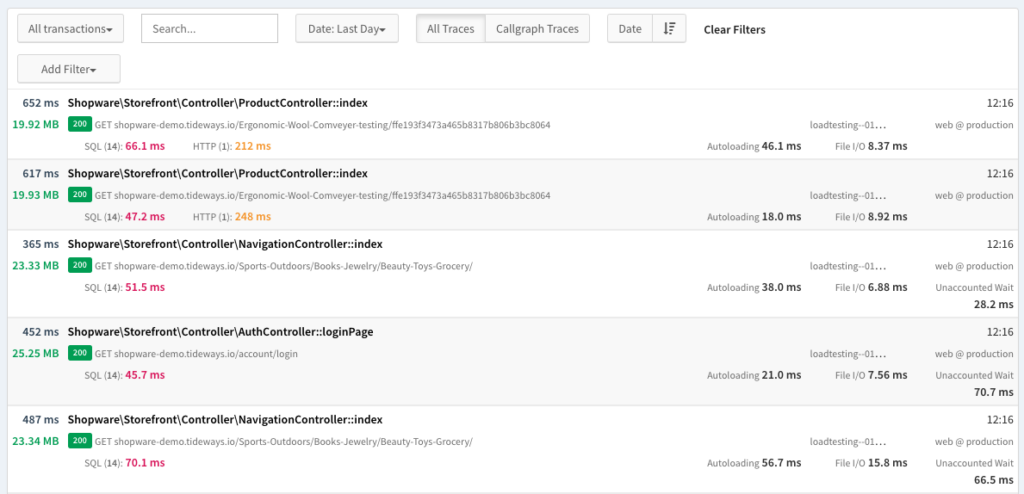
From the Traces list in Tideways you can filter, search, slice, and dice all the collected traces, as far back as the retention of your plan allows:
- Via Query Parameters: The way to get data on any web-page of your application with no setup
The quickest way to get profiling data on a specific page of your web application is via query parameters. From the Tideways UI, you can generate a query string that you can append to any URL of the application. It includes a secret message key that secures the process, provided the web application is configured with the Tideways API key for that project.
- Via Chrome Extension: 1-Click everywhere in your web-application to trigger the Profiler, and another click to jump to the results.
The most comfortable way to see profiling data for a specific page of your web-application is with the Chrome extension. After a quick install and then pinning the extension to the toolbar, it is ready to use.
As a benefit over the query parameters trigger, you can trigger profiling data with a click from the browser directly. You will then see a list of the collected traces directly in the browser, including a direct link to the detailed results.
- Via Commandline Tool: For profiling of PHP cronjobs and scripts or REST-API calls
Not all the code in a web application is run from the browser. There are usually cronjobs, worker jobs in the background or REST APIs that only machines talk to. With the “tideways” commandline tool, there is a handy command available to generate profiling data for these cases. After the initial setup, just prepend “tideways run” in front of any “php” or “curl” commandline call.
After the command is run, you get a summary of all generated traces and links to jump to the Tideways UI for detailed investigation.
Triggering trace for a CLI command:
Triggering trace for a cURL command:
- Via Tracepoints from the UI
Sometimes, a performance problem is difficult to replicate, and you need regular users or machines to trigger a performance problem and wait for it to happen again in the next hours.
Tracepoints combine the benefits of regular users and explicitly triggered profiling data. From the Tideways UI, you can select a page type and request priority and in-depth profiling data from it for 60 minutes to 24 hours.
Tideways then not only collects data for timeline and flame graph profiling views, but also for the call graph, from regular users of the web application. During this time, the percentage of requests with profiling data is elevated to increase the success rate of getting exactly the data you are looking for.
At the end of the tracepoint sampling phase, you can browse through all the collected traces. What’s more, Tideways aggregates the slowest traces into a statistically averaged, aggregated trace that gives a much better view of the application performance. - Programmatically in Code
For full control, you can also programmatically decide on what the Profiler should do from within the application itself. See our documentation for this advanced trigger.
Deep Integration: Automatic instrumentation for PHP frameworks and libraries
For a Profiler to be effective, it must provide an individual, in-depth context for the different APIs and libraries in PHP. That way, it can detect the more difficult and hidden performance bottlenecks in a PHP code base.
It is often not enough to know that a specific function is slow, you must also know the arguments it was called with.
This is why Tideways provides contextual information in its profiles that extends beyond simply the function or method name being called:
- SQL Query passed to database functions
- URL passed to different HTTP clients (cURL, Guzzle, Symfony Http Client, PHP Streams, SOAP …)
- Regular expression passed to preg_match* functions
- Event name passed to different framework event dispatchers
- Template name that is rendered with a supported Template Engine (Twig, Blade, Laminas, Magento)
- Database models and ORM APIs
We work hard to make installing and configuring Tideways easy for you
Our goal is setting you up from zero to insights in less than 15 minutes.
We invest a significant amount of time improving the installation methods for different systems and platforms. And after every support conversation where we see a customer struggling to install Tideways, we either improve or eliminate that step or build specific debugging directly into the installation.
For a successful installation, these steps are necessary:
- Create a user and project on tideways.com
- Install Tideways PHP extension and daemon in your production environment.
- Configure the tideways.api_key INI setting or use the TIDEWAYS_APIKEY environment variable.
- Install the Google Chrome Extension
- Click “Take Profile” on your application
Tideways Success Stories
But don’t take our word for it, we have also gathered success stories with Tideways that showcase some optimizations made with the Profiler.
Reduced checkout payment process performance from 45 seconds to 9 seconds
Processing the payment for an e-commerce order can take a while, but waiting 45 seconds for the confirmation is far from acceptable.
Our partner ecommlab was tasked with optimizing the performance of a Shopware store, and the checkout process stood out as being slow when one particular payment method was used.
They used a tracepoint as a triggering mechanism to capture Call Graph data from regular users for this particular endpoint in the application.
See this slideshow for how they could identify the custom code in their application that was responsible for the slowness:
Investigating the method in an editor showed that there was a superfluous, but expensive join for the history of the order state machine in a query that caused the slowdown:
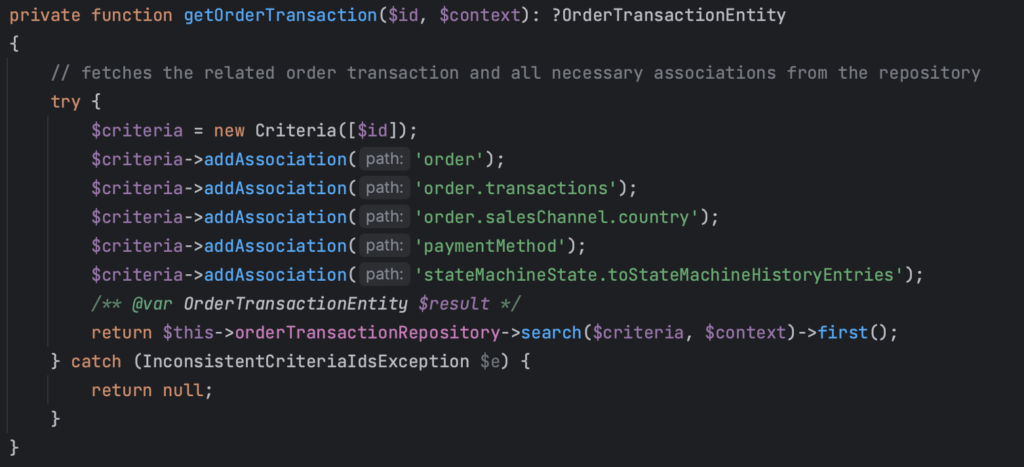
Deploying a new version of the code with this join to “stateMachineState.toStateMachineHistoryEntries” removed increased the performance massively.
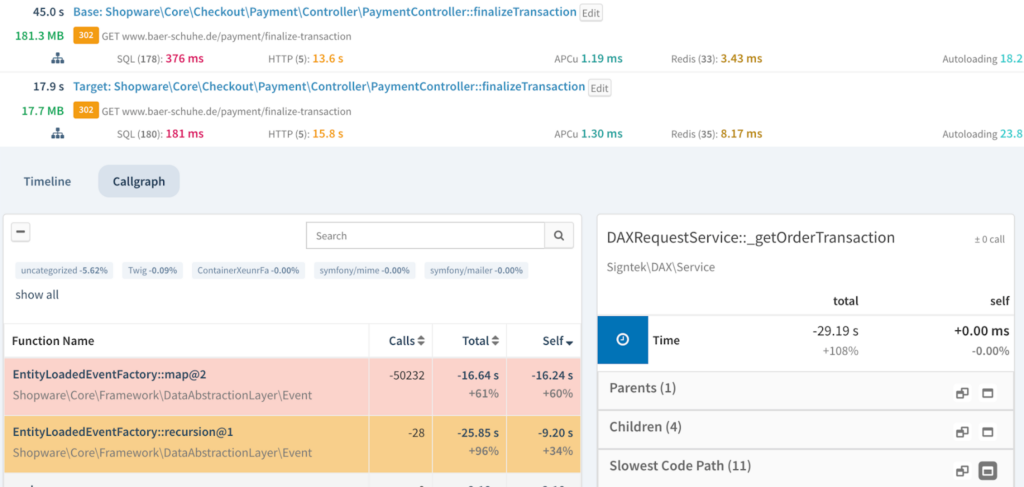
Using the compare trace functionality, the impact of this improvement was calculated with 63% reduction, with response times dropping from 45 seconds to 17 seconds:
Uncovered Expensive Deprecation Logging in Framework
A regular source of performance slowdowns can be found in the frameworks and plugins that are the foundation of an application.
As developers, we are not experts in every detail of the third-party code we use, so sometimes we either configure that code incorrectly to run slow, or the third-party code is inefficient itself.
Our customer Oliver Skroblin from GoblinCoders found the PHP error handler was triggering expensive logging of deprecations in every single request of their application, resulting in a delay of 100 ms or more in response time. This was called 18k times, in preparation of logging the same deprecation message, only to detect that deprecations are not logged in production.
In this call graph, you can see the Symfony ErrorHandler responsible for 699 ms of the response time of the request.
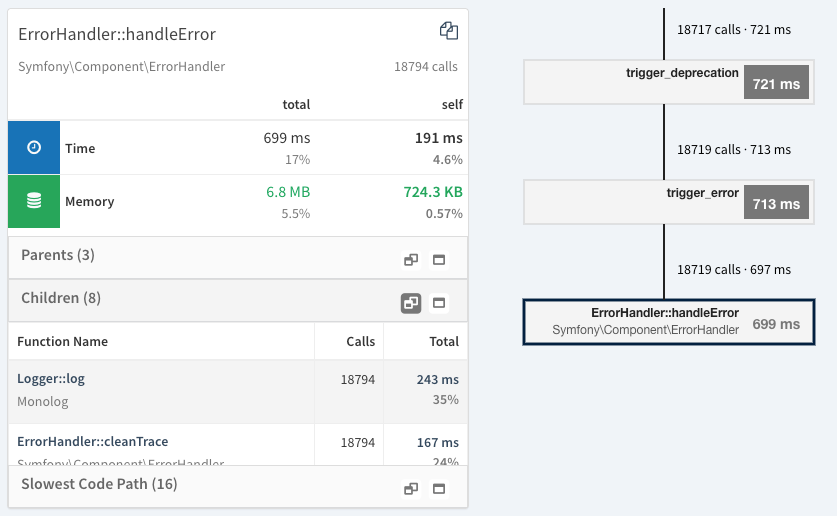
This is the kind of bottleneck that you cannot see without detailed profiling data. Looking at the code alone would not give you any indication that this will be a problem.
Innocently looking PHP core array function is slow
PHP makes it easy to build solutions to complex data structure issues with their vast library of internal functions. This can quickly hide a performance problem when an inefficient data structure and algorithm is used.
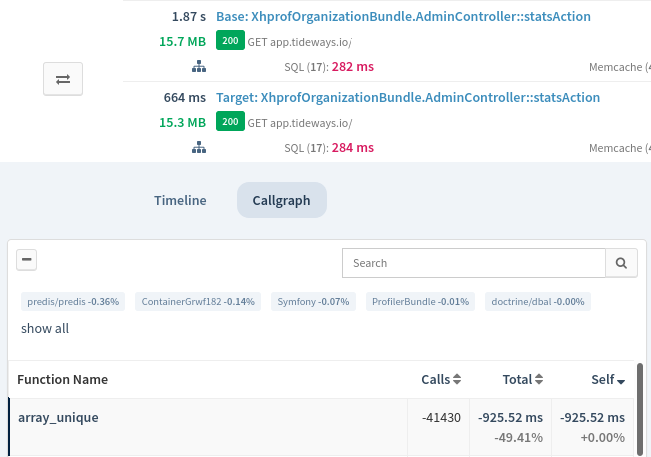
One such problematic function is array_unique – that will iterate over an array to eliminate duplicates using an algorithm with O(N) complexity.
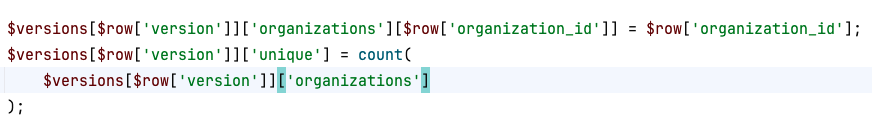
Take this piece of code that calculates the number of unique occurrences of an organization_id inside the foreach loop over server versions:

If you refactor the “organizations” key to be a hashmap instead of a list, then the uniqueness operation is just a simple count of the array:
A comparison of a Call Graph before and after the change shows the massive effect on performance with -925 ms this has on the production environment, where the list of active servers in this case is roughly 41.000:
To see for yourself if Tideways’ features are a good fit for your needs, sign up for a free trial of 14 days.
Blackfire
Blackfire supports profiling for production, development, and test/staging environments.
Similar to Tideways, it provides both time-sequence and behavioral visualizations by time and memory dimensions. It also provides context for slow SQL queries and HTTP requests and can identify context on other functions such as template engines or event dispatchers.
Triggering a profile in Blackfire is possible via a CLI, a Chrome Extension, the UI or programmatically.
Other notable features in the Profiler include:
- Performance Scenario testing
- Assertions on performance-related metrics
- Distributed Profiling
Disclaimer: We have evaluated Blackfire functionality solely based on their publicly available claims in documentation and website.
Xdebug
The oldest and best known Profiler for PHP is Xdebug. Besides profiling, Xdebug offers debugging capabilities and many other helpful features, making it essentially a swiss army knife for developers.
For every development environment, there is some way to install Xdebug, and for the more exotic ones you’ll find a blog post or some other platform with instructions on how to install it.
To enable profiling, add the “profile” item to the xdebug.mode section and let it start with a trigger only.
xdebug.mode=profile
xdebug.start_with_request=trigger
xdebug.use_compression=false ; on mac and with qcachegrind only
The trigger-based starting is necessary as otherwise Xdebug will generate a lot of data quickly, causing it to potentially overflow the disc without periodic cleanup. Compressed traces range from a few to 50–75 megabytes, while uncompressed traces can easily reach many hundreds of megabytes or a gigabyte of data.
Then run a page with the query parameter “?XDEBUG_TRIGGER=1” or using one of the Xdebug Browser extensions. For CLI scripts, prepend the php command with the XDEBUG_TRIGGER=1 environment variable.
Xdebug then activates the Profiler and after the request puts a file into the /tmp folder in the format cachegrind.out.$pid.gz (or without .gz) on the machine on which PHP runs.
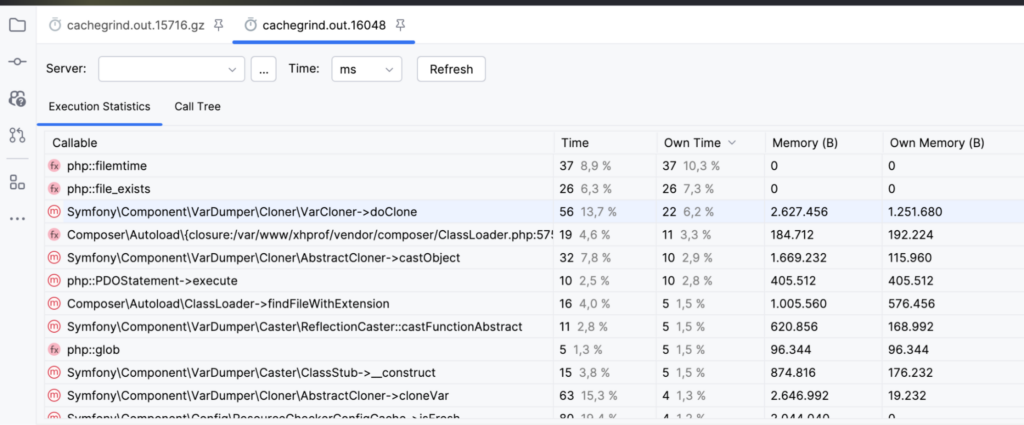
Xdebug does not come with its own UI for the profiling data; however, they can be viewed using either PhpStorm or QCachegrind/KCachegrind.
If you run Xdebug directly on your host machine, you can then open the file right away from the temporary directory. If you run PHP within a virtual machine or container, then you need to copy the file to the host machine or make the directory readable from the host machine through a volume.
The Xdebug profiler data contains full call stack data, as well as both timing and memory information for each function call of the request.
In both PhpStorm or Cachegrind you can navigate through the call stack of functions and methods from the top, or sort the calls by total or self time to find slow code that can be optimized. A function is identified by its name alone, there is no additional context available such as any function argument.
Only QCachegrind/KCachegrind has a visual Call Graph or call map feature, PhpStorm only has a table-based view.
The downside of Xdebug is its profiling overhead, both in time and space. Requests run with the Xdebug Profiler are much slower than without because the profiling overhead for each node is considerable. As such, Xdebug can overemphasize fast, but frequently called methods over slow ones that are called only a few times. Combined with the size of each profiling snapshot, Xdebug is not really suitable for production.
To sum up, Xdebug is a powerful profiler that gives detailed performance insights into development environments.
XHProf
A few years after the release of Xdebug in the early 2000s, when Facebook was still using PHP, they released their own Profiler extension as an open-source project. This was quickly abandoned by them when they migrated to their own PHP platforms HipHop and later HHVM.
However, a few forks over the years kept it alive, and it has been released through PHPs central package repository PECL again since 2018/2019. XHProf and its data model is also the basis for early versions of Tideways.
XHProf is optimized to be run in production, having a much lower overhead than Xdebug for each individual call. In order to achieve production grade overhead, XHProf cannot provide a full call stack. Instead, each function or method is represented in the call stack only once, regardless of how many different locations it’s called from. This can lead to some difficult moments when analyzing XHProf profiling data. Both Tideways and Blackfire call graphs exhibit this same behavior, as they both use XHProf in origin.
Triggering XHProf requires you to write some code to enable and disable it yourself. Depending on the application, this may prove to be quite challenging, particularly with symfony/runtime. This also means there is no standardized way to trigger the Profiler, as you are expected to design and code this yourself.
Here is an example of how to activate it in a Symfony application using the XHPROF_ENABLE query string:
<?php
class AppKernel extends Kernel
{
private const PROFILING_SECRET = 'abcdefg1234567890'; // generate something here
public function handle(Request $request, int $type = HttpKernelInterface::MAIN_REQUEST, bool $catch = true): Response
{
if (extension_loaded('xhprof')) {
if ($request->query->get('XHPROF_ENABLE') === self::PROFILING_SECRET) {
xhprof_enable(XHPROF_FLAGS_CPU | XHPROF_FLAGS_MEMORY);
}
}
return parent::handle($request, $type, $catch);
}
public function terminate(Request $request, Response $response): void
{
parent::terminate($request, $response);
if (extension_loaded('xhprof')) {
$xhprof_data = xhprof_disable();
if ($xhprof_data) {
$XHPROF_ROOT = '/var/www/shopware6/public';
include_once $XHPROF_ROOT . "/xhprof_lib/utils/xhprof_lib.php";
include_once $XHPROF_ROOT . "/xhprof_lib/utils/xhprof_runs.php";
// save raw data for this profiler run using default
// implementation of iXHProfRuns.
$xhprof_runs = new \XHProfRuns_Default();
// save the run under a namespace "xhprof_foo"
$run_id = $xhprof_runs->save_run($xhprof_data, "xhprof_foo");
$this->getContainer()->get('logger')->info("/xhprof_html/index.php?run=" . $run_id . "&source=xhprof_foo");
}
}
}
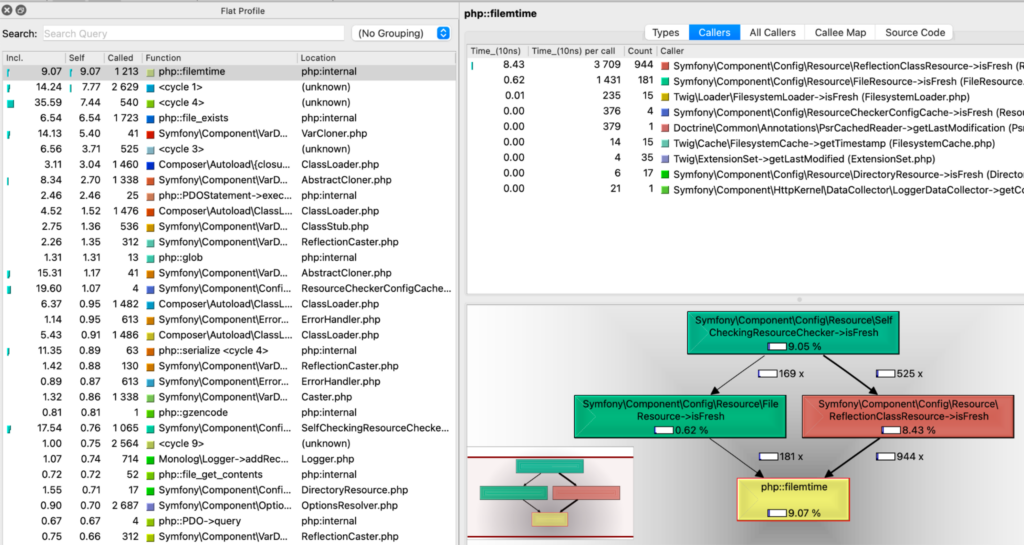
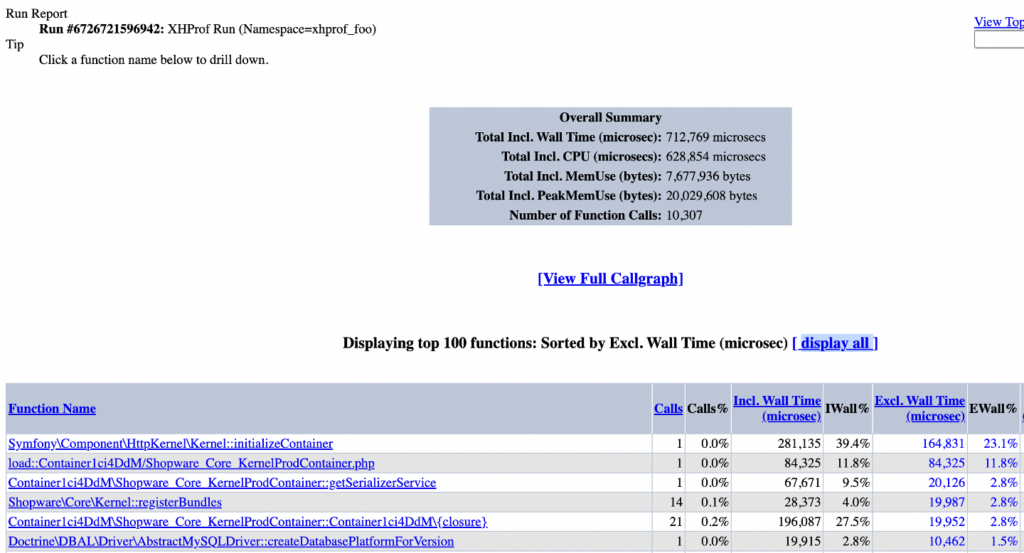
}XHProf includes its own UI, which makes it possible to gather data and display it in one step, with both a tabular view and a call graph.
One caveat here: In our tests, the Call Graph image generation for bigger requests was taking a lot of time and frequently timed out at 30 seconds.
php-spx
A more recent addition to the open-source list of PHP profilers is php-spx. Compared to Xdebug and XHProf you can see its focus on offering a superior developer experience.
Currently, there are no packages available in distributions for SPX. However, the installation from source is straightforward if you have set up a PHP development environment. I would recommend it as it handles the installation of Web UI assets in a manner that eliminates the need for additional fiddling, as opposed to XHProf, for instance.
The simplicity is what I like about SPX over XHProf and Xdebug; the UI is shipped and installed by default, and the extension makes it available automatically through the PHP web process that you already use.
For security reasons, spx is not enabled by default, so you need to modify the PHP INI settings to include:
spx.http_enabled=1
spx.http_key="dev" ; use a cryptographically secure secret here.
spx.http_ip_whitelist="*" ; it’s more secure not to allow access from all IPs
Then you can append the parameters ?SPX_KEY=dev&SPX_UI_URL=/ to your webserver URL and SPX will detect them and essentially hijack the request for itself to render the UI. From this UI, you can trigger the Profiler for all consecutive requests to your web application.
For the purpose of profiling the CLI, it is as straightforward as prepending SPX_ENABLED=1 SPX_REPORT=full environment variables to the “php” commandline prompt.
SPX_ENABLED=1 SPX_REPORT=full php bin/console cache:clearOne unique feature of SPX lies in its attempts to subtract the profiling overhead from each call, reducing the skew of short, frequent calls vs. slow, infrequent ones. For the previous CLI example, the PHP process ran for 20 seconds, but SPX reports it running 11 seconds only, meaning that it corrected for about 9 seconds in profiling overhead.
The SPX UI renders a Flame Graph and a list view of all calls to sift through:

Excimer
Wikimedia also entered the Profiling space with their own PHP extension called Excimer. It is intended for production installations with an extremely low overhead.
In contrast to all other open-source PHP Profilers, Excimer does not generate a call stack based on the Zend Engines functionality to hook into all function calls. Instead, it implements a sampling profiler that is invoked every millisecond, and then sums up the frequency and recurrence of stacktraces.
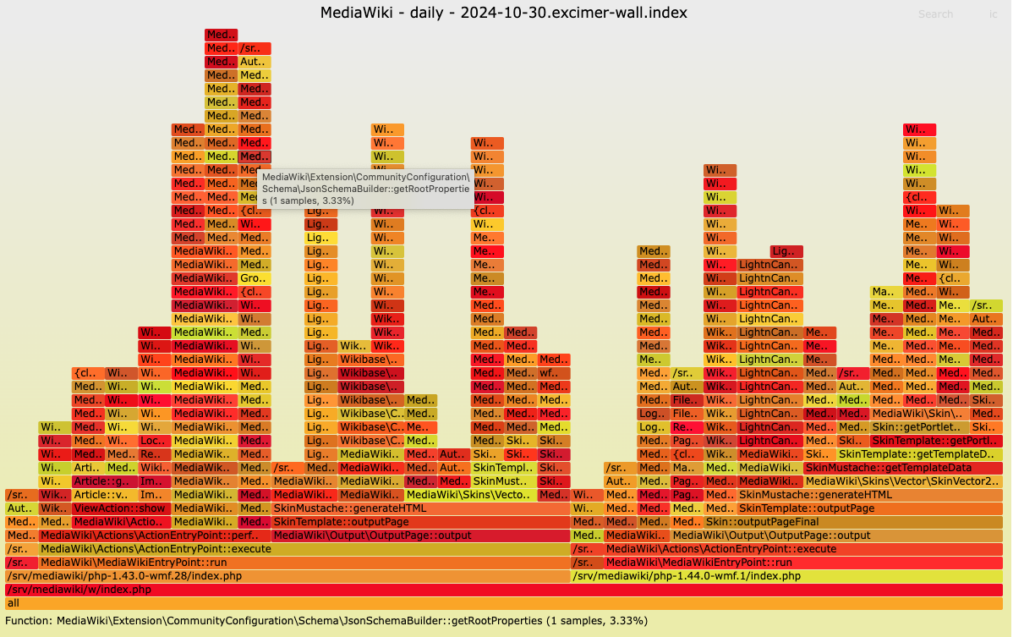
The interesting part about this is their public ArcLamp project, which shows daily flame graphs for the actual Wikipedia performance across their entire cluster of servers. Given their vast scale, they only need to collect a stack trace every 60 seconds for every PHP process to get a good picture of the overall performance.
The installation is simpler than for php-spx and XHProf, since pre-compiled binaries are available as an apt or yum package.
Similar to XHProf, however, the triggering is left for the user to implement themselves. The Excimer documentation contains a few examples; however, there is a limited amount of guidance regarding what actions should be taken. If you use the ArcLamp project, then it seems there is currently no way to sample at a different value for stack traces than every 60 seconds, which is a significant interval for sites that do not experience Wikipedia-scale traffic. The UI for the Excimer + ArcLamp stack is based on the widespread Flame Graph processing from Brendan Gregg.
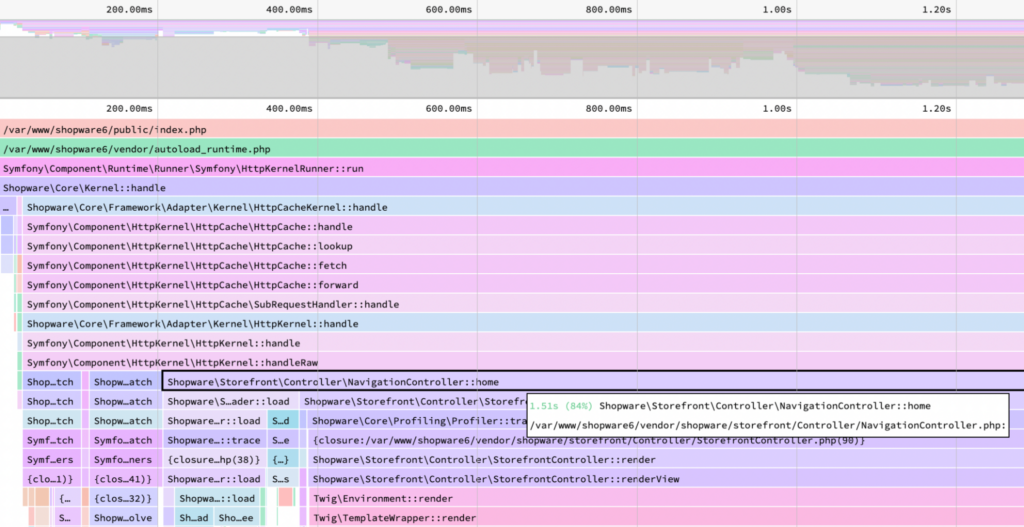
Alternatively, you can format the Excimer data in Speedscope format that can be rendered directly from the browser and is simpler to use. An integration with it for a Symfony application looks like this:
You can then move the speedscope data to your local machine and upload it to speedscope.app.
The context available for Excimer profiling data is functions and methods; additional context, such as query strings or HTTP domains, is not available. Due to sampling, you would also likely not see performance problems caused by quick but frequently called functions very well. For in-depth profiling data, Wikipedia themselves also store XHProf profiling data at regular intervals.
Conclusion:
As you explore software that keeps an eye on your web-application and ensures effective performance insights, we’re confident this thorough analysis and comparison has given you some useful hints. Tideways is committed to helping you improve the performance of your web-application; for an optimal user experience.
Watch our video on the topic: