
Profiling Overhead and PHP 7
Tech
In this blog post we will discuss the overhead of Profilers and how their results are biased, which can ultimately affect optimization decisions of programmers. The following simple program will help us understand the problem:
<?php
function array_string_length(array $strings) {
    $len = 0;
    foreach ($strings as $string) {
        $len += strlen($string);
    }
    return $len;
}
This program contains a tight loop that executes the same function strlen over and over again. For an array with 100 elements, strlen is called 100 times.
A profiler for this PHP program will hook into the Zend Engine to get notified of every userland and internal function, here array_string_length and strlen. When writing a profiler you can use the zend_execute and zend_execute_internal callbacks in your PHP C extension to achieve this.
Usually the Profiler itself requires a constant amount of time to profile each PHP function. If a fast function such as strlen is now called thousands of times in a rapid succesion, then the profiling overhead of this function call will put a much higher weight on this particular function call, compared to a slow function that performs I/O and is only a small number of times.
You can ignore this problem when the profiling overhead of a Profiler is extremely small. But that is not the case with callgraph profilers in PHP, they can cause significant overhead.
Now if all your function calls get 2-5 times faster due to an upgrade to PHP 7, then the profiling overhead is still the same in absolute numbers. But relative to the full request, profiling is now responsible for a much bigger share of the response time, as you can see in the following picture:
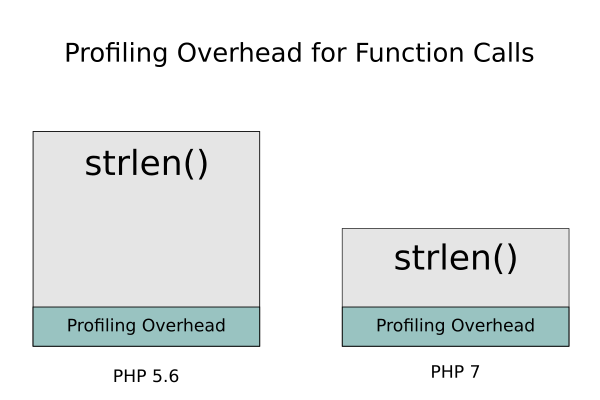
Profilers overemphasize frequently called functions
What does this mean for us as developers? Because fast, frequently called functions get overemphasized due to the profiling overhead, we must be careful when interpreting the results. The performance of the program changes because it is being profiled.
If your profiler suggests standard functions such as strlen, substr, in_array are slow then you should always look at how often this function is called. If the number is very high and you can reduce the amount of calls, then a comparison of old and new traces always overestimates the gain, it will be much smaller when the Profiler is deactivated.
Profilers with a high overhead will push you into the direction of micro-optimizations through this bias. I don’t recommend micro-optimizating code, but when you are micro-optimizing with a Profiler this bias could even drive you towards changes that will actually make the code slower.
Attempting to measure the profiling overhead
We cannot easily measure the overhead of a single function call being profiled, so instead we run a benchmark against WordPress while the Profiler is activated to find out the overall overhead. We can then see how throughput and response times are affected by the activation and measure the slowdown as the approximate profiling overhead.
We have used Facebook OSS-Performance repository by the HHVM team as a starting point. It is an excellently designed tool and makes sure benchmarks are correctly setup and repeatable. We test PHP 5.6 and 7 using no Profiler, XHProf or Tideways extensions. You can find the raw numbers in this Gist, but in this post we are interested in the relative comparison.
The first table shows the oss-performance benchmark against WordPress on PHP 5.6 with 200 concurrent requests, configured with a 10% or 100% sampling rate (Profiler activated every n% requests). We use no profiler as baseline and compute the profiling overhead as percentage loss in performance from the baseline.
Disclaimer: The test pushes PHP to its limit and utilizes all cores at the maximum, for actual applications the overhead is smaller, because they usually run on under-utlized CPUs. The overhead also changes based on the code itself, this is just representive of WordPress.
| Profiler | Requests | Average Response | 90% Percentile | 95% Percentile | 99% Percentile |
|---|---|---|---|---|---|
| No Profiler | 0.00% | 0.00% | 0.00% | 0.00% | 0.00% |
| Tideways Timeline 10% | 5.61% | 4.93% | 7.56% | 12.04% | 3.00% |
| Tideways XHProf 10% | 14.70% | 13.41% | 17.34% | 26.21% | 14.81% |
| XHProf 10% | 14.52% | 13.50% | 12.80% | 26.99% | 18.41% |
| Tideways Timeline 100% | 24.88% | 22.93% | 24.19% | 27.17% | 25.65% |
| Tideways XHProf 100% | 42.79% | 39.28% | 44.13% | 47.04% | 40.70% |
| XHProf 100% | 46.00% | 42.22% | 52.43% | 54.00% | 48.81% |
| XHProf CPU+Memory 100% | 62.73% | 57.46% | 62.65% | 69.36% | 67.55% |
| Xdebug (*) | 42.88% | 39.42% | 44.42% | 49.22% | 40.61% |
You can see, timeline tracing is at least two times faster than the classic hierachical Xhprof based profiling in every category. That is because we only instrument a small number of functions using a whitelist. As a consequence, the profiling overhead is much smaller.
Our fork “Tideways Xhprof” using modern linux timing APIs is a bit faster than the original Xhprof, which uses timing APIs from 2008 when the extension was first developed. Both hierachical profilers cause a significant overhead though and when enabling both CPU and Memory profiling it gets even worse.
You can reduce the problem by reducing the sampling rate to even lower numbers such as 1%, but this comes at the high cost of loosing insights into your application, especially on pages that are not visited frequently.
Since Xdebug is not a production profiler and you should never activate it on production, we have only measured the overhead of enabling the extension. This already makes your application as slow as profiling all requests with Tideways XHProf fork.
Profiling with PHP 7
Lets take a look at the same results using PHP 7 instead of 5.6. We use the Tideways PHP 7 Beta, but there exists no XHProf for PHP 7 yet.
| Profiler | Requests | Average Response | 90% Percentile | 95% Percentile | 99% Percentile |
|---|---|---|---|---|---|
| No Profiler | 0.00% | 0.00% | 0.00% | 0.00% | 0.00% |
| Tideways Timeline 10% | 17.61% | 17.11% | 18.67% | 19.85% | 28.27% |
| Tideways XHProf 10% | 24.47% | 23.86% | 28.41% | 35.81% | 47.04% |
| Tideways Timeline 100% | 33.82% | 32.86% | 36.44% | 35.99% | 35.73% |
| Tideways XHProf 100% | 61.34% | 59.42% | 61.25% | 61.30% | 61.34% |
| Tideways XHProf Cpu+Memory 100% | 77.29% | 75.16% | 77.94% | 77.93% | 77.97% |
| PHP 5.6 No Profiler | 65.03% | 63.12% | 63.12% | 62.50% | 68.62% |
| Xdebug (*) | 63.65% | 61.81% | 63.36% | 62.68% | 61.98% |
WordPress is almost 3 times faster on PHP 7 than on 5.6 and we can see how the profiling overhead is much larger, because the Profiler itself did not get 3 times faster.
Where XHProf was actually a pretty reliable Profiler for PHP 5, because it was very fast, we have to be much more careful trusting its results when used with PHP 7. In fact, XHProf hierarchical is actually reducing the performance of a PHP 7 request to the level of PHP 5.6.
The Timeline Profiler is much faster, but even at the 10% sampling rate level its overhead is slightly too high. We are planning several improvements in the coming months to get this overhead to below 10% again for PHP 7.
In PHP 7 Xdebug still has a higher overhead than XHProf due to its different nature being a development profiler.
Conclusion
With PHP 7 we have to be more careful to interpret results from callgraph Profilers such as XHProf and their various forks. Unless your PHP code is an obvious bottleneck and uses very inefficient algorithms, micro-optimizations are becoming less relevant with PHP 7.
Where in PHP 5, it was often the case that PHP code in a request was slower than all the I/O combined, with PHP 7 it will more important to improve I/O and macro-performance again.
(*) Xdebug was just enabled as a zend extension for this test to provide a lower bound of its overhead. The actual overhead when using the Xdebug Profiler for a single request is higher. That also means that you have to be very careful with the profiling overhead bias.
About the author

I am the founder and CEO of Tideways. I started the company over 10 years ago with the mission to move the PHP ecosystem forward, starting with performance. As managing director, I work across product, strategy, and the day-to-day of building a developer-focused SaaS business.
I’m a core contributor to the Doctrine open-source project and a founding board member of the PHP Foundation, which reflects my long-standing commitment to the PHP ecosystem. I particularly enjoy working at the intersection of application performance, developer experience, and the open-source community that makes PHP what it is. Outside of work, I enjoy board games, hiking, and coffee.