
Monitoring & APM
Profiling & Tracing Ι Monitoring & APM Ι Error & Exception Tracking
Increase your revenue
with fast-loading PHP applications.
Tideways is the PHP performance monitoring tool that shows engineering teams precisely which code, queries, and external calls are hurting load times — so you stop guessing, ship confident optimizations, and keep users from bouncing.
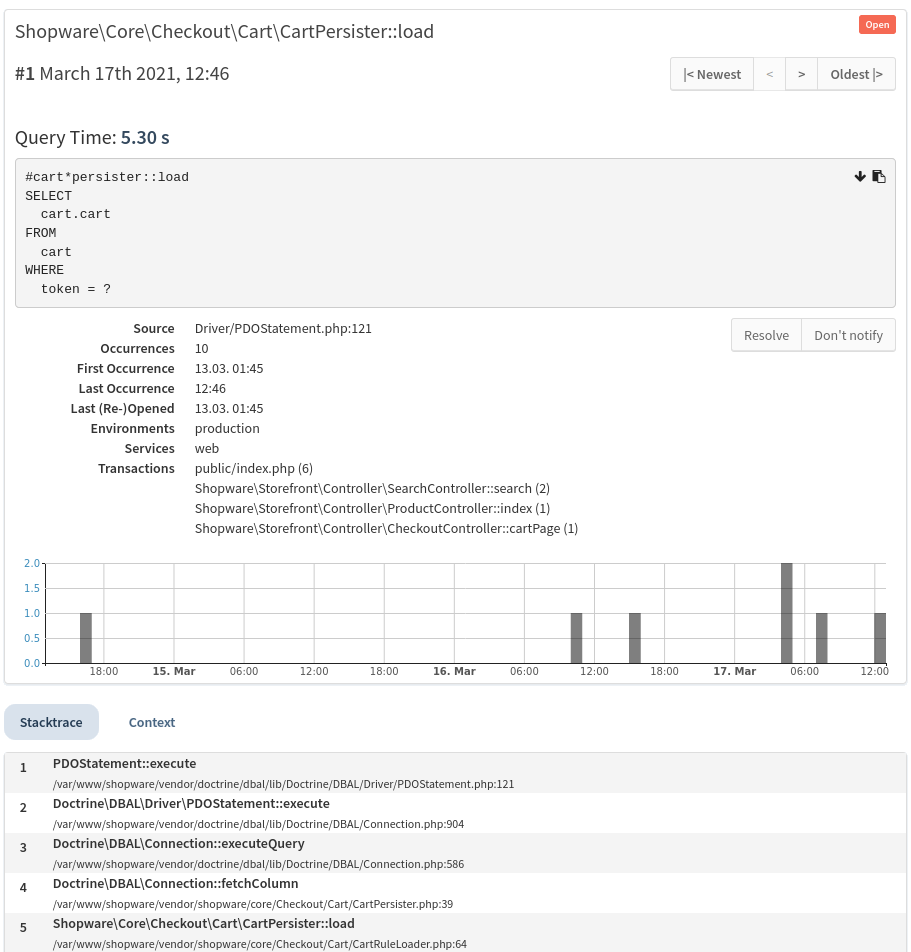
A slow SQL Query log that pinpoints where to optimize
Know exactly where in the code slow SQL Queries are executed to identify plugins and functions to optimize.
Stacktraces point to the PHP file and line that a query was run, including the visited URL and controller.
All Monitoring & Alerting Features
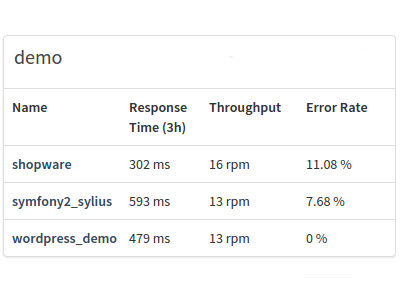
Monitor Project Performance
You can monitor all of your applications individually with their own response times, traces, deployment and error data in projects.
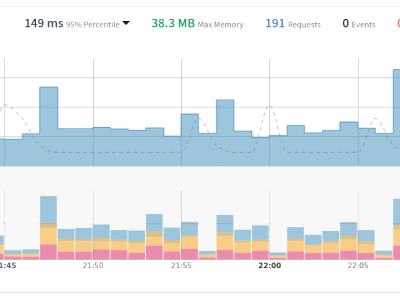
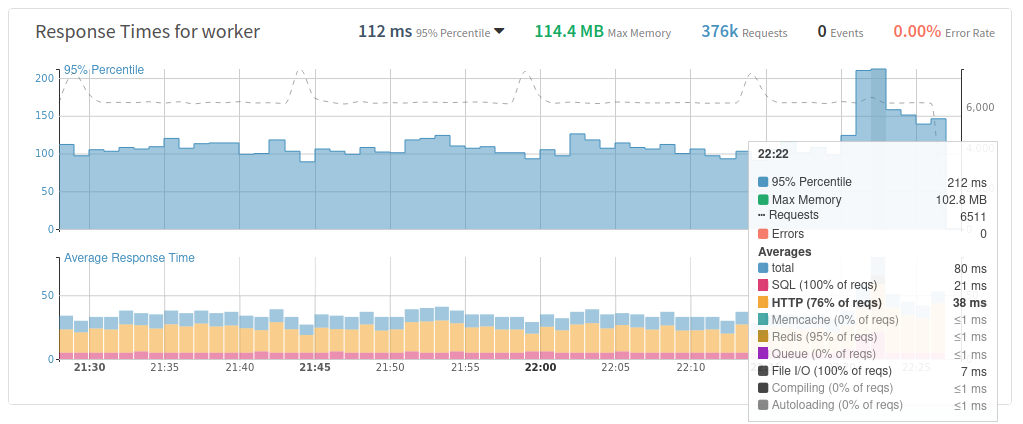
Analyze Response Times, Memory
Inspect graphs with 95% response time and request numbers for your application and all its transactions on a per-minute basis.
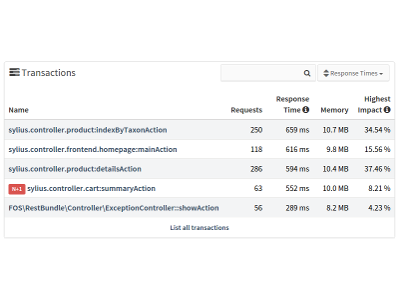
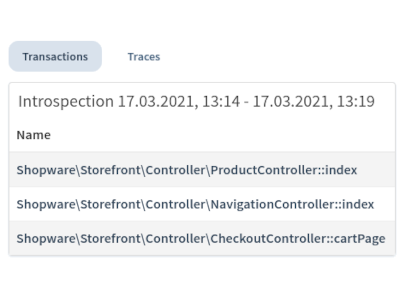
Transaction and Endpoint Monitoring
Tideways collects data based on different transactions in your application such as Controller Actions. For supported frameworks these are detected automatically without code changes.
Minute by Minute Breakdown
Investigate performance spikes with our to-the-minute breakdown of transaction performance, requests, error-rates and all the collected traces.
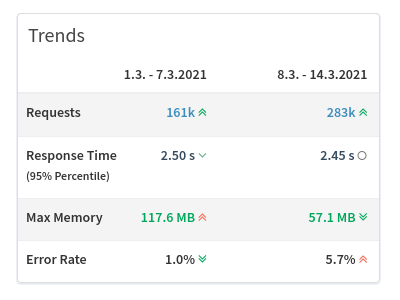
Weekly Report and History
Follow Performance Trends of your Project with the weekly report and the historical performance data.
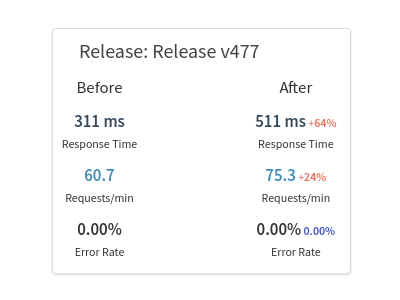
Compare Release Performance
Detect performance regressions or new exceptions by comparing before and after deployment metrics.
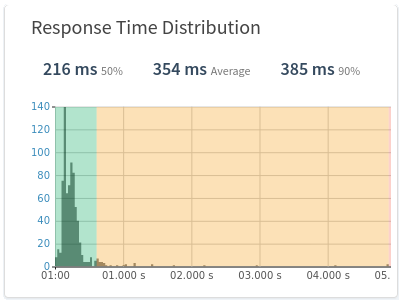
Full Distribution of Response Times
Tideways stores all response time data in histograms, making the full distribution of every response duration visible. Understand how outliers affect the performance without getting mislead by average response time numbers.
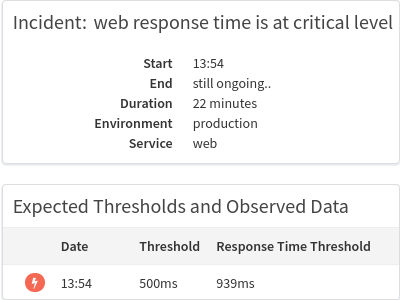
Response and Error Rate Alerting
Get notified when response times or error rates exceed the normal levels so that you can concentrate on development while Tideways has your back.
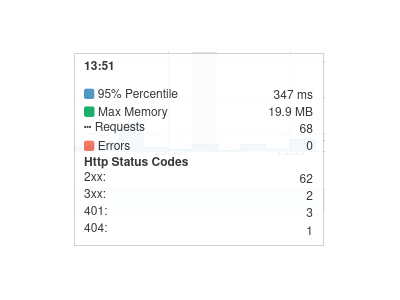
HTTP Status Code Monitoring
See at a glance the HTTP Status codes that all requests are responding with to understand how the application responds to changing request patterns.
See other features of Tideways: Monitoring, Profiling and Exception Tracking that give you insights into the performance of your application