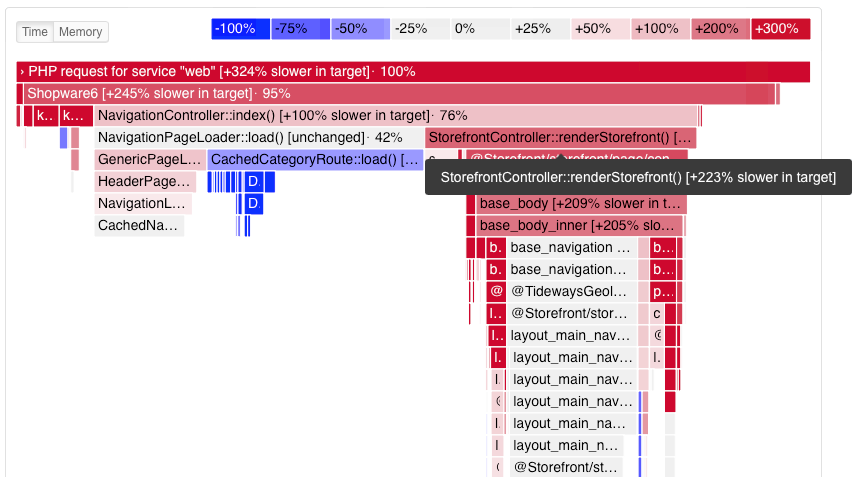
Differential Flame Graph
Differential Flame Graphs are a useful tool to quickly identify the root causes of performance issues. You can now compare two traces and see which span made a trace faster or slower. You can also hover over or click on different areas to get more detailed information.

It’s useful for example to check whether a change in the source code, a system update or a configuration change increased or decreased performance. Red depicts an increase in execution time or resource usage, blue a decrease, neutral colors mean that no significant change has taken place. It’s also possible to compare traces from different time periods or of different system states.