Tideways 2026.2 Release
Product
Understanding complex request traces is one of the hardest parts of performance analysis.
In this Release, we focused on making this significantly easier in Tideways. The Timeline has been redesigned to provide a clearer view of how requests are executed, with new layout modes, improved navigation, and a more consistent span model.
These changes help you follow execution order, understand dependencies, and identify performance bottlenecks faster, even in complex applications.
In addition, we improved instrumentation across frameworks and libraries, making traces more consistent and providing more detailed insights into previously less visible operations.
And finally, a teaser for our next release: AI-assisted performance analysis and optimization through the Tideways CLI, integrated with Claude, Codex, Cursor, Pi Coding Agent, and other coding agents.
Summary
In this article
Improvements to the Timeline Rendering
Waterfall & Condensed Timeline
Our Timeline has been a key part of gaining performance insights with Tideways. It is collected automatically and provides detailed request data, including SQL queries, HTTP requests, and more. We have now improved the visualization to make it more obvious to understand complex request patterns.
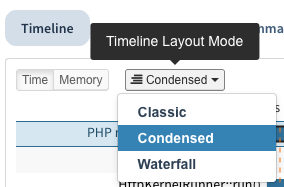
We introduced two new layout modes: Condensed and Waterfall. Condensed is now the default, based on our tests and feedback from beta users. You can still switch to the previous layout, now called Classic, and the preference is saved in the browser.
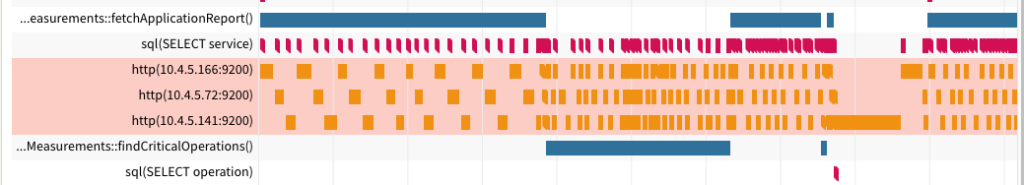
In Classic mode, spans are grouped by their summary. For example, all spans with sql(SELECT service) appear in the same row, regardless of when they occur. This creates a very compact view but makes it harder to follow the sequence of events over time.
The Condensed mode reuses lines only within a defined threshold and ensures that parent spans are always displayed above their children (e.g.,findCriticalOperations). This improves the visibility of dependencies and the chronological order.
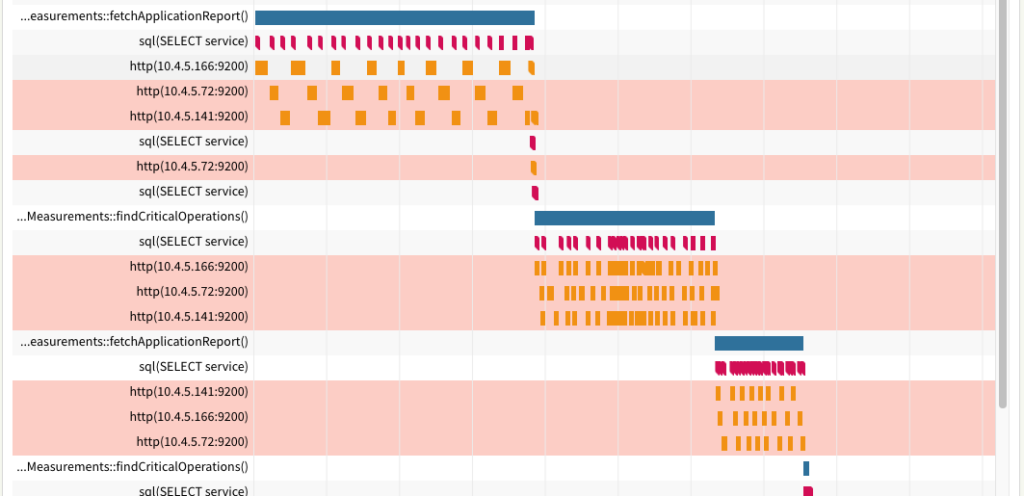
The Waterfall mode is at the other extreme end, where none of the lines are reused. For this, chronological order is as obvious as possible while also often being used in other tools like dev tools in web browsers.
Each mode offers a different balance between compactness and clarity. You can switch between them depending on whether you want a high-level overview or a more detailed, step-by-step view of how a request unfolds.
Documentation: Timeline Layout Modes.
Span Pagination & Mini-Timeline
With the new display modes, it can be less obvious how often and where a span appears across a longer request.
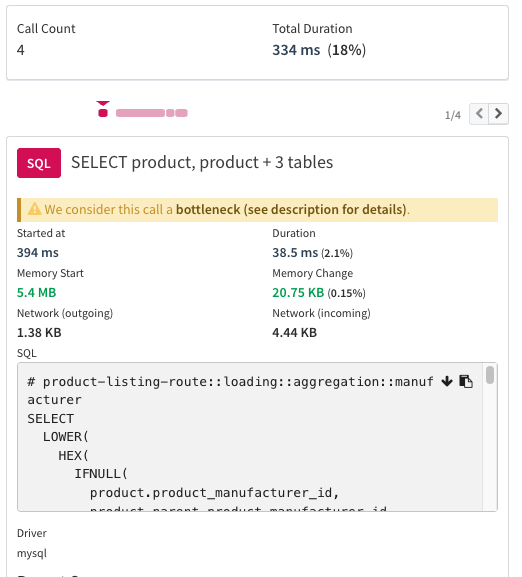
To address this, we added additional navigation and context to the span details view when a span occurs multiple times:
- Summary box: Shows the total count and duration
- Pagination: Jump between occurrences of the same span in the timeline by clicking left/right
- Mini-Timeline: Visualizes the position and duration of each occurrence, with clickable navigation
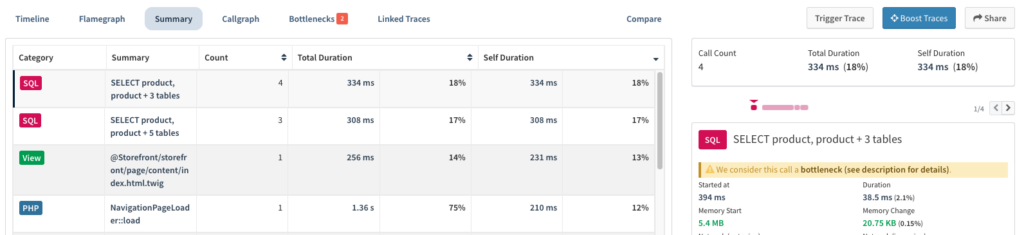
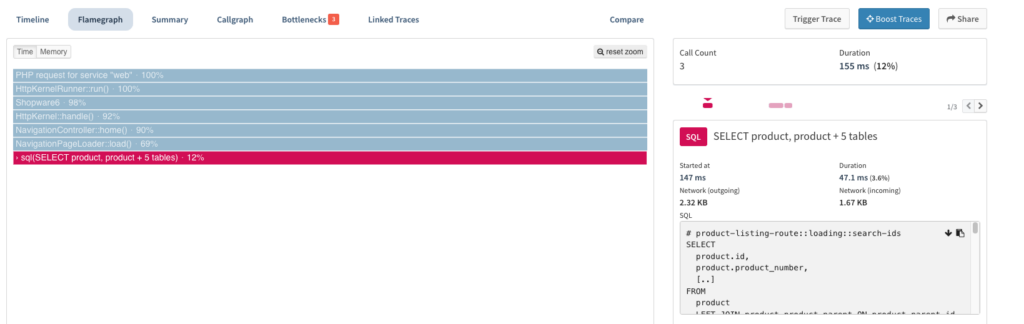
We also added this functionality to the Summary and Flamegraph tabs. Previously, only a single span was shown for the selected Flamegraph frame or table entry. Now, you can view and paginate through all corresponding spans.
More details:
Quality of life improvement: highlight and select lines
Another small improvement to the Timeline that was well received in our tests: the full row of the currently selected span is now always highlighted. In addition, clicking on a row’s summary text selects the first corresponding span automatically.

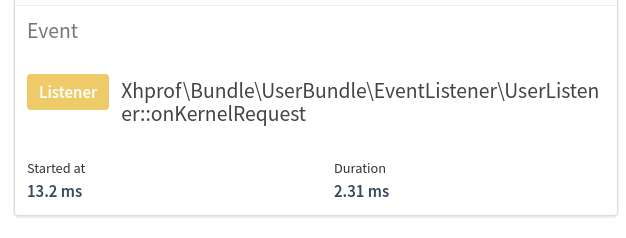
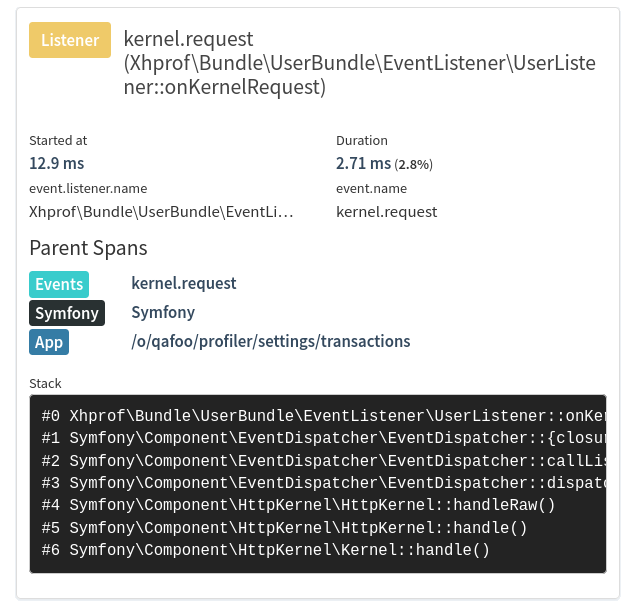
Events, Listeners, Views now with full span details
The Timeline Profiler now does not differentiate between spans and “span-events” anymore; all instrumented function calls are tracked as spans with time, memory, custom annotation context, and stack trace information.
This simplifies the UI of the Timeline Profiler and makes it easier to understand, while at the same time providing more insights individually on operations that were previously stored as just “span-events”.
Before:
After:
This migration started with PHP Extension version 5.36.0 in March 2026 and will continue over the next weeks.
More details:
- Changelog: Event to Span Conversion in Timeline
Response Time Distribution Chart Improvements
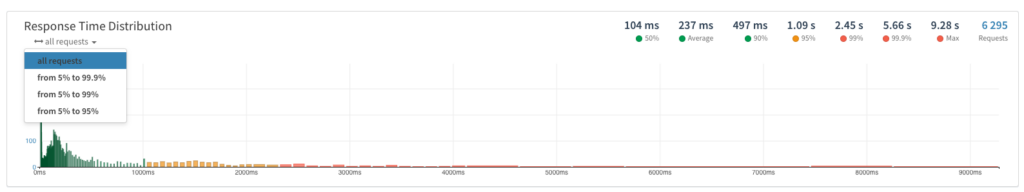
Looking at the response time distribution for a transaction has also become clearer.
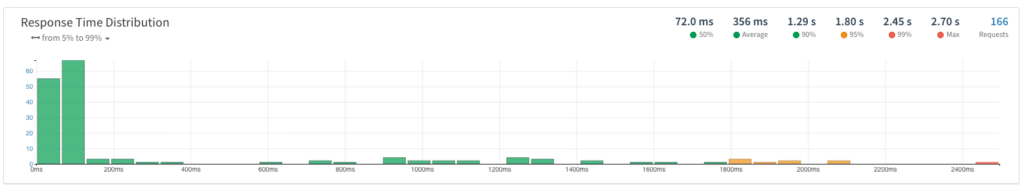
Apart from visual improvements, we also added the possibility for users to choose the data resolution. You can now get a compact “5% to 99%” percentile of the full resolution of our underlying histogram data structure.
Documentation: Response Time Distribution.
GraphQL Instrumentation Improvements
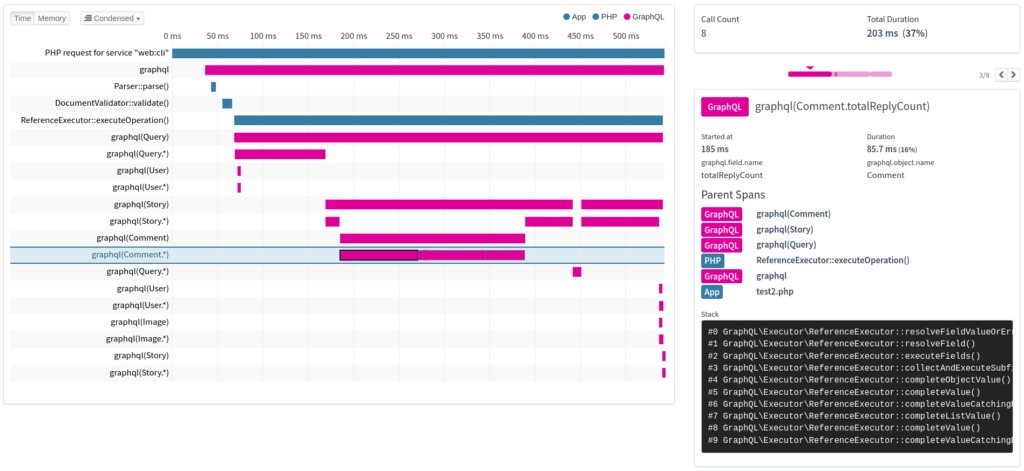
In GraphQL APIs, all business logic runs within a single query. Previously, field retrieval was shown as sub-operations of the GraphQL span, which made it harder to reflect the nested structure of the query.
With this Release, Tideways creates spans for objects and field resolution, making the object graph visible and helping you identify expensive parts of a query more easily.
More details:
- Changelog: Improved GraphQL Instrumentation.
Instrumentation improvements
- Spans for all Symfony lifecycle methods (boot / terminate)
- Symfony EventDispatcher is now instrumented before Symfony’s boot, supporting instrumentation outside Symfony projects.
- Spans for Laravel’s lifecycle.
- Migrated Doctrine spans now include annotations about the size of the workload.
- Event names for Yii 1/Yii 2 are now properly namespaced by the component name.
- Events for Symfony, Laravel, Magento 2, Yii 1, Yii 2, and WordPress were migrated to full-featured spans, and annotations were added where useful.
- PHPUnit test cases now create full-featured spans.
- Ad-hoc tables created by an SQL subselect will now be included in the list of tables shown in the timeline title, allowing to more easily distinguish different queries using dynamic tables.
Outlook: AI Insights Beta
AI-assisted development is one of the most discussed topics in software engineering right now. We are particularly interested in how Tideways performance data can help AI tools identify and resolve performance bottlenecks more effectively.
Over the last two months, we have been laying the foundation for this by making Tideways data accessible through our CLI. As part of our Beta program, we have now released a first version with support for AI-powered performance analysis and optimization.
If you would like to try it out, you can enable the AI Insights Beta in your Tideways organization settings under Beta Features. This unlocks an early preview in the CLI through tideways run.
About the author

I’m a Content and Marketing Manager at Tideways, where I focus on content marketing, community building, and developer-focused communication. I enjoy turning complex technical topics into engaging content and creating meaningful connections within the PHP ecosystem.
As a passionate content creator and published author, I believe that great content starts with curiosity, authentic stories, and a genuine interest in the people behind them. Whether I’m working on marketing campaigns, building communities, or writing, I enjoy thinking outside the box and finding creative ways to engage and inspire others.