
How backend performance affects Google PageSpeed Insights & WebVitals
The most looked-at metric for the performance of websites is the Google Web Vitals score, packaged by Google through three tools: PageSpeed Insights, Lighthouse, and Chrome User Experience Report (CrUX).
These metrics are not only important for frontend and browser performance.
One significant share of the “Largest Contentful Paint” (LCP) metric is the “Time to First Byte” (TTFB), a measure of backend performance.
From our experience, it is the most significant lever for good or bad LCP scores: both metrics are measured in seconds, and TTFB usually makes up 50-75% of the LCP score.
Getting your scores
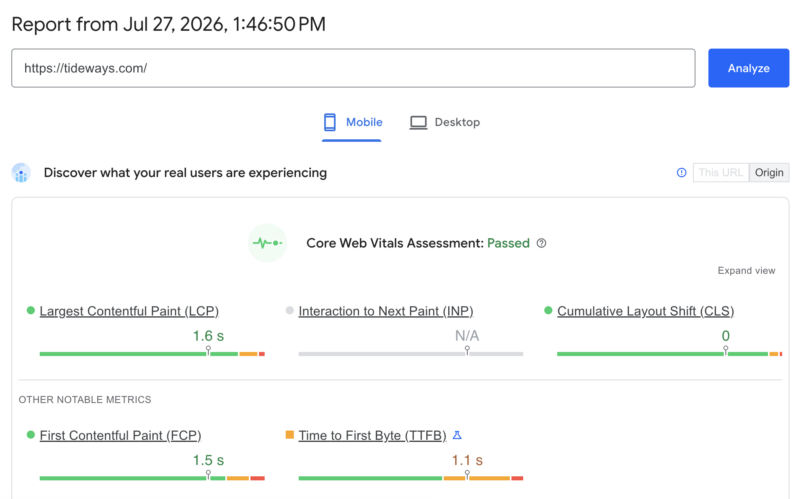
You may have seen a report like this before from PageSpeed Insights, where you enter the domain to evaluate, and for tideways.com it outputs:
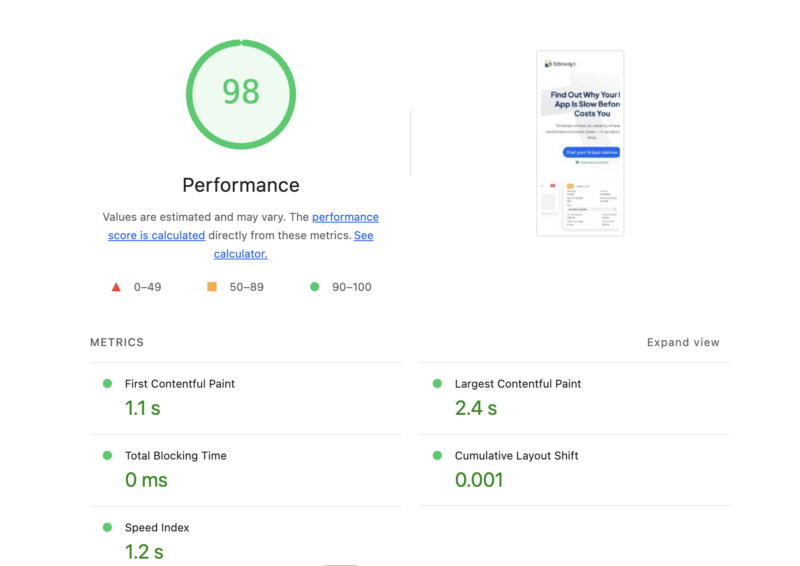
Or when using the Lighthouse Developer Tools tab in your Chrome-based browser:
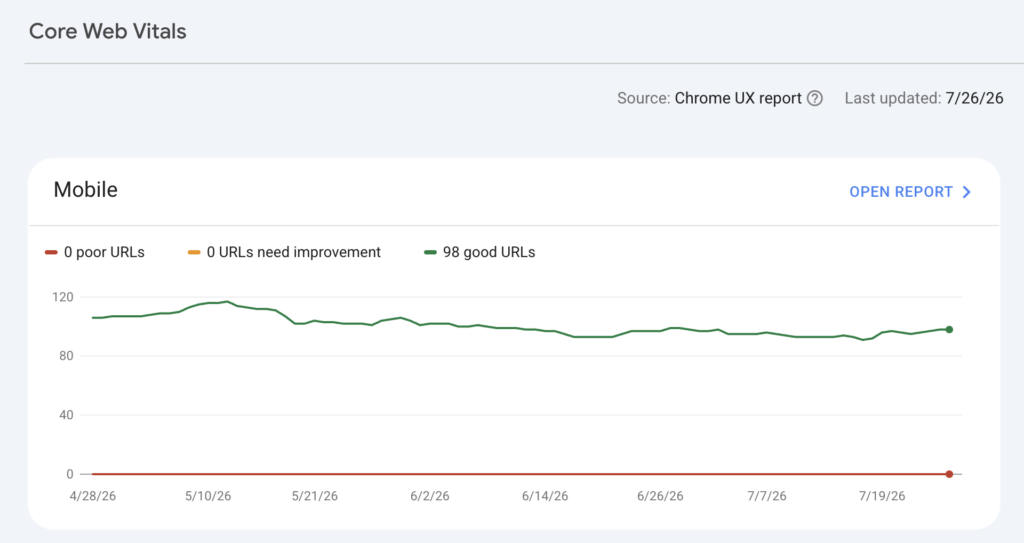
Google then uses the Core Web Vitals to rate URLs in their Search Console:
Why the backend is critical for Google Core Web Vitals
Time to First Byte (TTFB) measures how long it takes from the browser requesting a URL from the server to send the first part of the response back.
This first part of the response usually includes what CSS and JavaScript files to load, which images, and so on. The browser then starts fetching these secondary resources once it knows what they are.
This makes Time to First Byte the most critical part of the overall web vitals score. If TTFB is taking too long, then Largest Contentful Paint (LCP) can never recover from this.
It’s like starting 10 meters behind everyone else in the 100-meter sprint
or running over Lego bricks, where everyone else has a clear lane.
You will not win a prize this way.
Server-side performance is a critical factor of the overall web performance, and as such, Google wants your time to first byte to be lower than 800 ms to be good and lower than 1800 ms to be acceptable.
Tideways benchmarks across hundreds of Shopware 6 and Magento 2 stores show that pure PHP backend performance is often in a range between 200 ms for the top 10% and above 2500 ms (2.5 seconds!) for the bottom 10% of the stores.
Backend performance can be improved in many ways:
- Careful selection and programming of first- and third-party plugins.
- Server-side caching of the output, which can be achieved for 10-50% of the requests in most cases.
- application architecture choices (moving processing into background processes, caching).
- database and query optimizations
- removing N+1 database and cache queries that repeatedly query the same data.
- efficient integration of external services and APIs
- global PHP configuration settings (OPcache, …)
- Hardware selection (adequate CPU and RAM size, SSDs instead of HDDs, ….)
The key is to continuously monitor the backend performance, because with a complex system like a web-shop, you should expect deterioration to happen regularly for many different reasons.
Tideways has features to detect all these and many more performance bottlenecks.
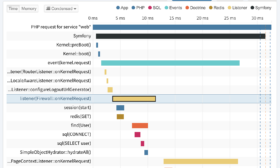
Timeline Visualization
Understand from start to finish of a request, what operations were called sequentially. Tideways automatically collects database queries, external API calls and PHP controllers, events, listeners, templates triggered by supported frameworks and libraries.
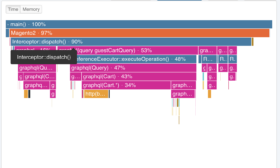
Flamegraph Visualization
The Flame Graph groups similar operations and is a more compact way than the Timeline to view what is happening in a traced request.
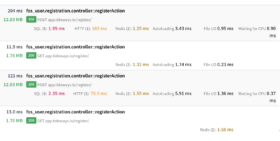
Observing Requests with Low Overhead
We collect very low-overhead performance observations for applications by tracing production servers giving you full visibility into your code.
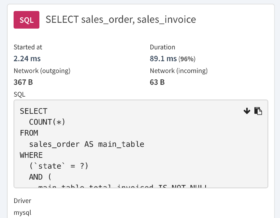
Details on SQL Queries
See an anonymized version of each SQL query, how long it takes and when its executed during the request.
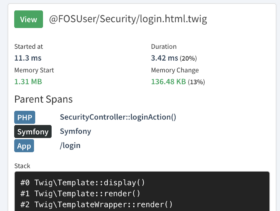
Template Engine Support
Discover the performance of template rendering in your requests from engines such as Twig, Smarty 2 & 3, Magento Blocks, Laravel’s Blade and others.
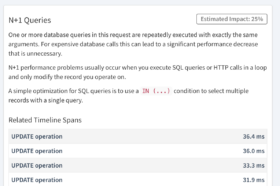
N+1 Detection
Automatic detection of repeated queries and HTTP requests helps you fix one of the most dangerous performance bottleneck.
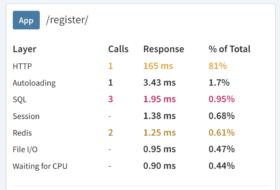
Breakdown by Layer
Requests are made of different layers contributing to the total performance: From PHP and its different execution stages, to SQL queries, HTTP, Redis and many more are automatically detected by Tideways and summed up for every trace.
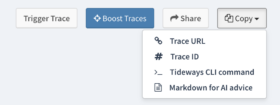
Share with Humans or AI
You can share traces with outside collaborators, or let coding agents analyze the output to help you understand and fix bottlenecks.
How do these performance metrics affect my success?
Google uses the Core Web Vitals to measure the user experience and rank web pages in search results according to these results.
AI bots can also exclude results from their training data or web searches when they take too long.
Finally, performance has been shown to have a significant effect on conversion rates. This was last shown by Shopify again in a big study in April 2026 with a trend:
The trend is clear: for every 100 milliseconds slower a store loads, conversion tends to be about 3.5% lower.
What are the differences in these different Google tools?
When you first hear about Google performance metrics, it’s a bit difficult to understand all the moving parts. The Lighthouse tool does a live request using your own internet connection to a server of your choice and computes the metrics based on this single event. It is therefore not a reliable indicator of the performance of your website and gives you only a rough direction.
Google collects Chrome User Experience Report data from users of the Chrome browser directly. When they visit a website, this performance data is shared with Google. It then aggregates the data over 28 days and publishes it in the Chrome User Experience Report once a week. The aggregated data is using the 75th percentile for LCP (Largest Contentful Paint) and the two other primary metrics, INP (Interaction to Next Paint) and CLS (Cumulative Layout Shift). Because Time to First Byte (TTFB) is such a central part of LCP, it is also listed in this report.
The PageSpeed Insights tool queries both the Chrome User Experience Report data and performs a single Lighthouse test. Because of the 28-day window and once-every-week update period, the CRUX data cannot adequately show changes in performance quickly enough. To bridge the gap between this free data-source with infrequent updates, and a sub-optimal 75th percentile metric choice, you need dedicated monitoring tools:
- For the backend: Tideways covers all angles of PHP, Shopware 6, and Magento 2 backend performance.
- For the frontend: Tools like RumVision cover the browser side of the performance equation and allow getting insights on the other two WebVitals metrics INP and CLS as well.
Our blog post shows how this works in practice with RUMvision, and links to our joint webinar on the topic.