
Average and Slowest response in transaction monitoring list
Instead of the “Typical Response” and “Worst Response” metrics, Tideways now reports the “Average Response” and “Slowest Response” for each transaction on the application/service monitoring screen and in the history.
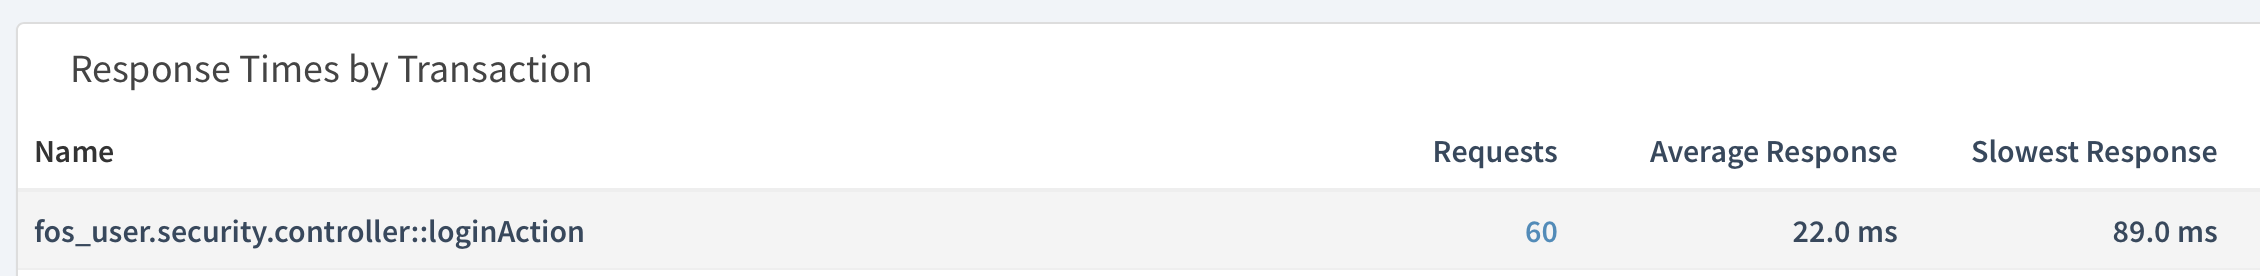
“Typical Response” was already calculated as the “Average Response”, so there has been no change in behavior for the metric. The rename just clarifies how this metric is computed by using a more wide-spread terminology.
For the “Worst Response”, Tideways has historically averaged the 95th percentile values of all datasets, giving a rough estimate of what could be considered “worst” response. However statistically it is not valid averaging percentile values. This is why Tideways now reports the “Slowest Response” in the time period, meaning the maximum measured response time.
The transaction monitoring details screen still shows the percentile values of individual transactions.
The REST API now contains a new key “response_slowest”.
About the author

I am the founder and CEO of Tideways. I started the company over 10 years ago with the mission to move the PHP ecosystem forward, starting with performance. As managing director, I work across product, strategy, and the day-to-day of building a developer-focused SaaS business.
I’m a core contributor to the Doctrine open-source project and a founding board member of the PHP Foundation, which reflects my long-standing commitment to the PHP ecosystem. I particularly enjoy working at the intersection of application performance, developer experience, and the open-source community that makes PHP what it is. Outside of work, I enjoy board games, hiking, and coffee.