Chrome Web Extension 1.5.4 release
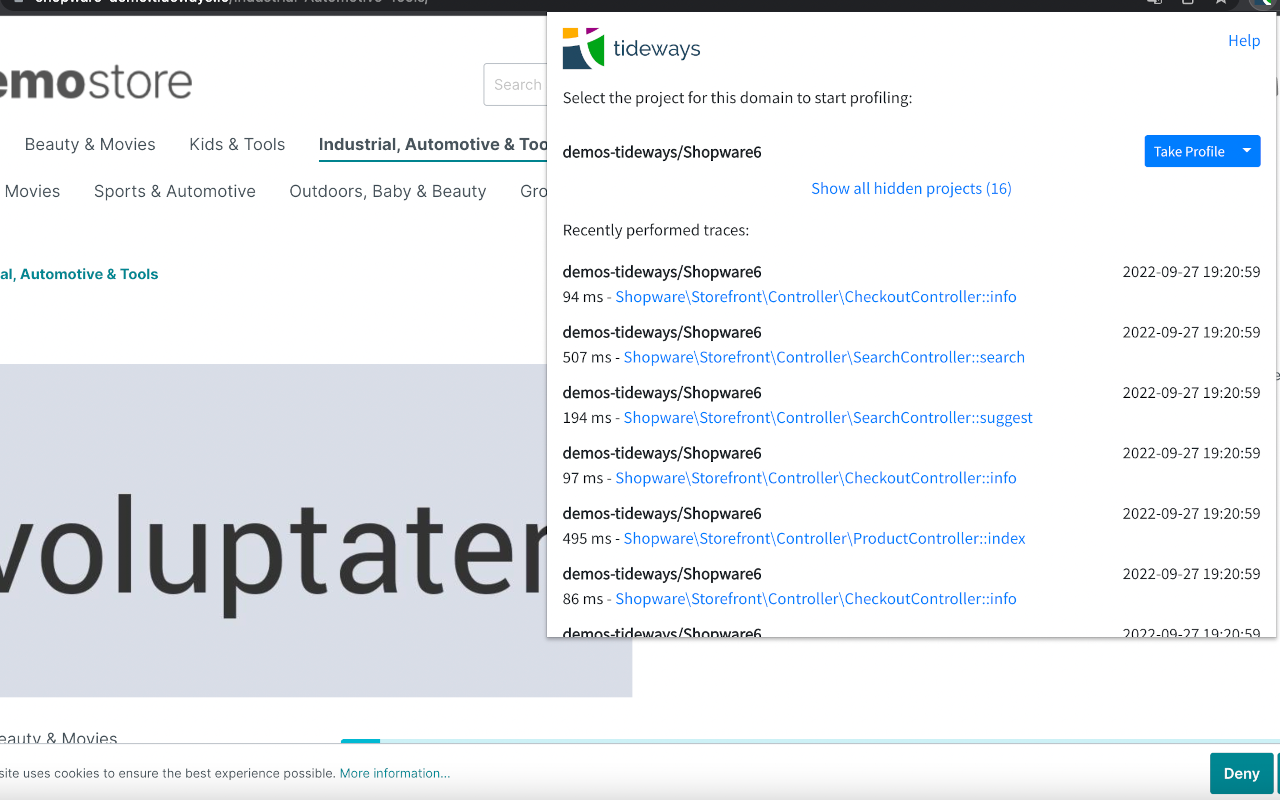
- New Feature: After an active profiling session for 15 or 60 seconds the extension now queries the backend for generated traces and displays them in the “Recently performed traces” section of the extension popup. The generated traces can be directly opened and it is not necessary to look for them in the “Traces” UI screen anymore. All traces of a profiling session are also connected and can be navigated to from the “References” tab of a single trace.
