Developing a time-series “database” based on HdrHistogram
Over the last months we have developed, tested and rolled out a new backend for the time-series information that we collect in Tideways. In this blog post I want to explain some of the implementation details and the journey getting here and why we didn’t use one of the many existing time-series databases out there.
The past: Time-Series with Elasticsearch
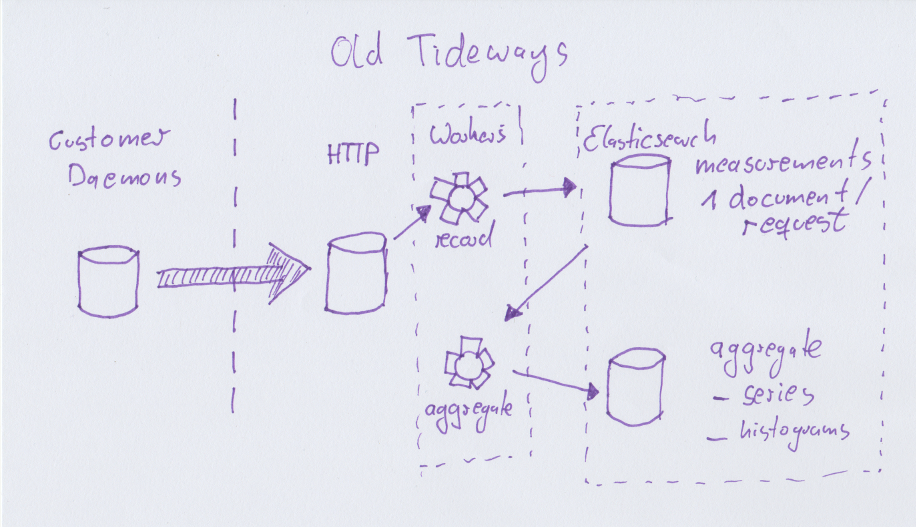
Since the first prototype of Tideways we have used Elasticsearch for storing latency measurements of monitored applications. The decision for Elasticsearch was heavily influenced by ease-of-use over everything else. When building the prototype in 2014, one requirement was that we wanted to calculate percentiles of the latency distribution and skip averages all together, because of their many flaws in performance analysis (topic for another blog post). At the time we already used ES for storing and searching trace data, so we made the naive decision to use it for time series data as well. To counter potential data loss with Elasticsearch we made the decision to keep an event log of all data written and implemented a replay mechanism which safed us from trouble several times.
As a single purpose tool for monitoring latency and profiling, we don’t need to collect thousands of time-series per server every minute, and Elasticsearch works quite well for us on this scale. We did encounter our share of problems and had to learn a lot before efficently operating Elasticsearch as a time-series database, but with a cluster size of never more than 300GB we are far from the “webscale” regions yet but we knew that the current backend implementation wouldn’t get us much further. We also felt some growing pains:
-
Using the percentile aggregations, for some of our customers with 18000 requests per minute, it means about 30 million data points for only one day and performing the calculations took in the range of several seconds, sometimes more than 30 seconds.
-
Storing one document for each request is extremely inefficient, even if Elasticsearch compresses storage effectively. Every day we collect in the range of 500 to 1 billion documents.
-
We can’t store this amount of data for longer than a few days (3 at the moment) so we need expensive aggregation workers that compute aggregations over all endpoints all the time, into different dimensions. If you know a little bit about statistics, once you start aggregating calculating with percentiles is not possible anymore, which forced us to do something very wrong: averaging of percentiles in some places. We also needed to aggregate into multiple different target formats, because our datastructures where naively implemented. Every minute up to 6000 aggregation tasks where performed, causing quite a bit of stress on our backend workers and Elasticsearch cluster.
-
Our daemon on each customers machine already aggregates data into 1 minute intervals, before we deaggregate this again on the backend to allow Elasticsearch to calculate percentiles on it. This felt very inefficient.
-
Due to the massive amount of unaggregated and aggregated data, we are still offering quite a short data-retention period of only up to 14 days. We want to increase this but not at the current data storage efficency.

Looking for a solution using Histogram datatypes
So our next solution needed to be better on several dimensions:
- Fix the aggregation overhead
- Avoid the use of wrong math when calculating percentiles
- Store data more efficiently
- Decrease query response times even for long periods of more than 24 hours.
So when I came across datatypes for histograms, especially HdrHistogram I know I was up to something. Histograms are the perfect datatype for storing latencies.
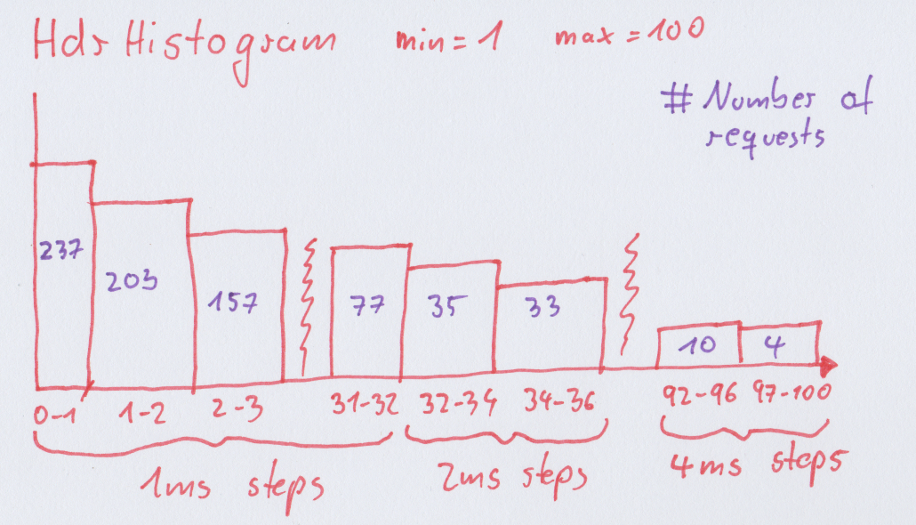
A histogram is an (almost) lossless datatype where we count the number of times a request takes in predefined buckets. For HdrHistogram this works by specifiying a fixed range (1 to 60000ms in our case) and a factor for preciseness that defines small buckets of 1ms steps in the beginning but the larger the range the larger the steps between buckets get.

The benefit of histograms is that you can add many of them together and still compute the exact value of any percentile.
The first step was to find an existing open-source timeseries database that supported storing histograms, but sadly only Prometheus (to my knowledge) does this and its pull metrics model is too different to our current push model that we could easily integrate this in our existing stack without a full rewrite.
Every other time series database stores each measurement individually. Which is completly useless for our latency numbers in pre-aggregated 1 minute intervals. It seems most time-series databases are not primarily written to store latency numbers but instead general purpose time series.
After about a year of contemplation about this problem (remember, we didn’t actually need to improve for scale yet) we decided to implement this ourselves on top of an existing database two months ago.
This was not a decision made lightly, but we figured implementing this for just our special purpose and stored using existing database technology, we would end up with a very small and maintainable codebase to implement this.
Our new timeseries backend
In my head, the ideal solution to combine HdrHistograms and a database looked like this:
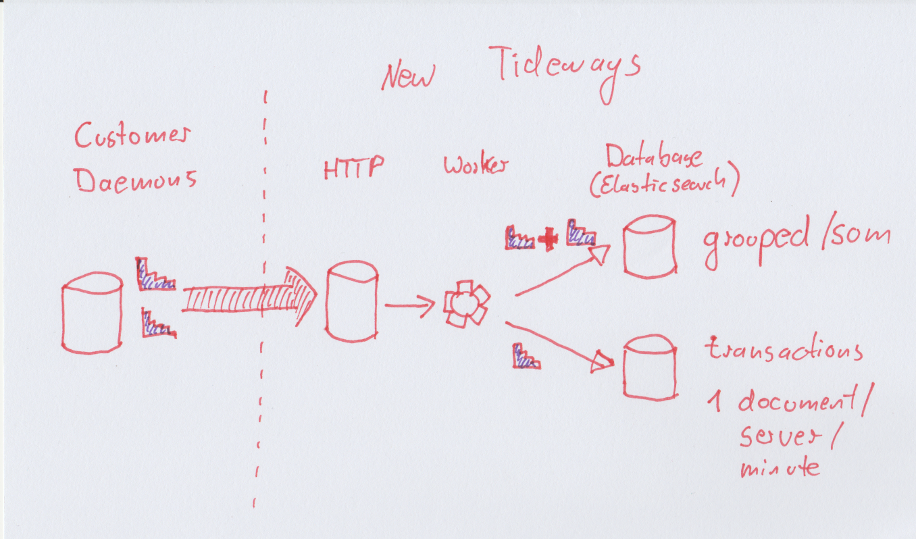
- The daemon already collects latency data as histogram datatype on the customers servers.
- When passed onto our servers we would just store the histograms in a database on our end without having to process the data to make Elasticsearch percentile queries work.
- No aggregation workers are necessary anymore, because we already store aggregated data.
- As a downside, computations have do be done in code, because no database exist that can do histogram additions directly itself.
For the first prototype we took the C port of HdrHistogram by Michael Barker and wrapped it in a PHP extension since all our backend is in PHP. We then built a second implementation for the service storing and querying our monitoring data and came up with something just short of 600 lines of new code. Our daemon does not aggregate Histograms itself yet, this is a next optimization step for the future.
Our new backend now works this way:
-
We store one serialized HDR histogram per observed transaction/server/minute. Some small optimizations reduce the required space for histograms with only a few observerations.
-
For every group of transactions (web, backend, crons, …) we also store one histogram with all requests that is displayed on the main page of the application.
-
For every server/minute we store a ranking of all transactions by “impact” (Sum of all response times as share of total) that can be added up again over arbitrary periods of time without having to use “wrong math”.
-
Queries fetch all histograms in the selected date interval (several thousands if necessary) and adds them on the fly.

All this is still done in Elasticsearch, because it is readily available and we could just plugin our pre-existing abstractions to manage retentions, rotating indexes, clusting and everything else we didn’t want to implement ourselves for now. Technically we don’t need ES anymore, but we keep using it for now, because its easier to use something that already exists.
The solution is so small because we are literally standing on the shoulder of giants here and just plugging two different technologies (HdrHistogram and a database) together.
Results
Using a feature flag we were live with the new backend for a small number of test customers with amazing results:
-
We reduced the required storage space to at least 12% of the original amount.
-
We reduced query times for large periods to consistently under one second, no matter how big the customer is. This is a massive improvement over the really bad 30-45 seconds some of our customers had before for periods >1 day. Using a C-based PHP extension for summing up many histograms helps with the performance.
-
Aggregation workers are not necessary anymore, saving up to 6000 worker tasks per minute at the current workload.
-
Customers with high data retention can now still look at data in one minute intervals for their whole available dataset. No aggregation to one hour buckets anymore for everything older than 3 days.
On top of this we can improve some of the existing features by exposing more detailed information.
After a month of testing this in beta customers and ourselves, we are now slowly rolling it out to all customers.
Future
The next step for the backend is looking into optimizing storage even more. For example we could aggregate histograms into one per transaction/minute if there are more then one server. This could potentially save a lot of data for customers with lots of servers, which are usually the ones sending way more data anyways.
Another thing we want to look into is making the backend more available than Elasticsearch is by default. We will probably try this by using a different underlying database first or even implementing our own special purpose database. We only use Elasticsearch as dumb storage right now, so it should be easy to switch to MySQL/PostgreSQL or any NoSQL database that allows range queries. Building something our own is out of the question.
Ideally at some point we want to extract the code base into a small microservice, since its now entagled into our monolithic backend service.
Of course, I hope to inspire others reading this to jump into building an open source version or integrating HdrHistograms in one of the existing time-series databases 🙂