
Filter traces by bottlenecks, response time, service and release events
Product
We just improved the trace listing screen in Tideways and included four new filters.
First, You can now filter down traces based on the bottlenecks Tideways detected, for example slow or N+1 SQL queries, excessive compile or garbage collection times.
Second, you can filter traces by Release version. If you are using the Event API to create releases whenever you deploy a new version of your code, then you can now find all the traces that were collected during one or more releases.
Third, you can filter traces by Response time. Currently we support 5 common ranges, for example 0 – 50ms and 50 – 250ms. We are working on more advanced filter possibilities to allow any range that you want to filter for.
Fourth, you can filter traces by Service they where collected in.
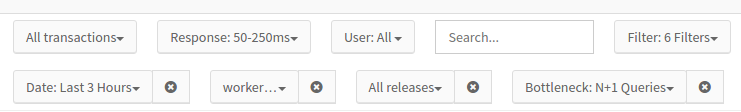
As we are adding more and more filters, we have also improved the user interface to only show the filters that you are currently using. By clicking on the “Filters” button you can see a list of all existing filters and toggle the ones you need for your current task.