
Heatmaps in Weekly Report
Product
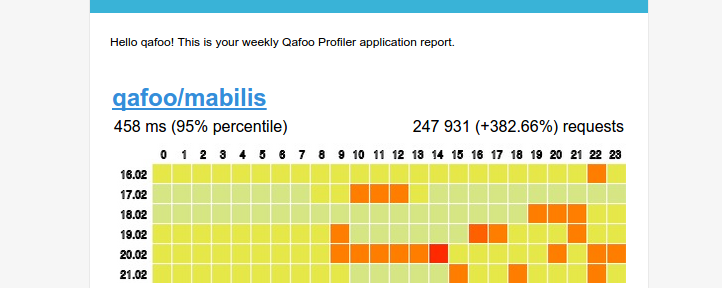
Changes to the weekly mail were already planned for a long time and now we are pushing them forward with heatmaps as an additional tool to find periods of slow response times. The heatmap will show the response time (95% percentile) of all your applications for each hour of the last seven days.
It is now part of the weekly application report that is sent every monday morning.
 Heatmap in Weekly Report Mail
By clicking on the square for any hour you will be redirected to the Profiler, showing the graph of response times in the selected 60 minutes as well as the critically slow transactions and traces.
You will receive the first mail including heatmaps next Monday.