
Improved Dashboard with Preview Chart and Recent Performance Metrics
PHP Performance
We have improved the dashboard in Tideways to include preview charts with the last 24 hours of performance data and the performance of the most recent 15 minute interval. This provides you with a much better overview of all your applications and by selecting any time range in the preview chart you can directly jump to a time-range that interests you.
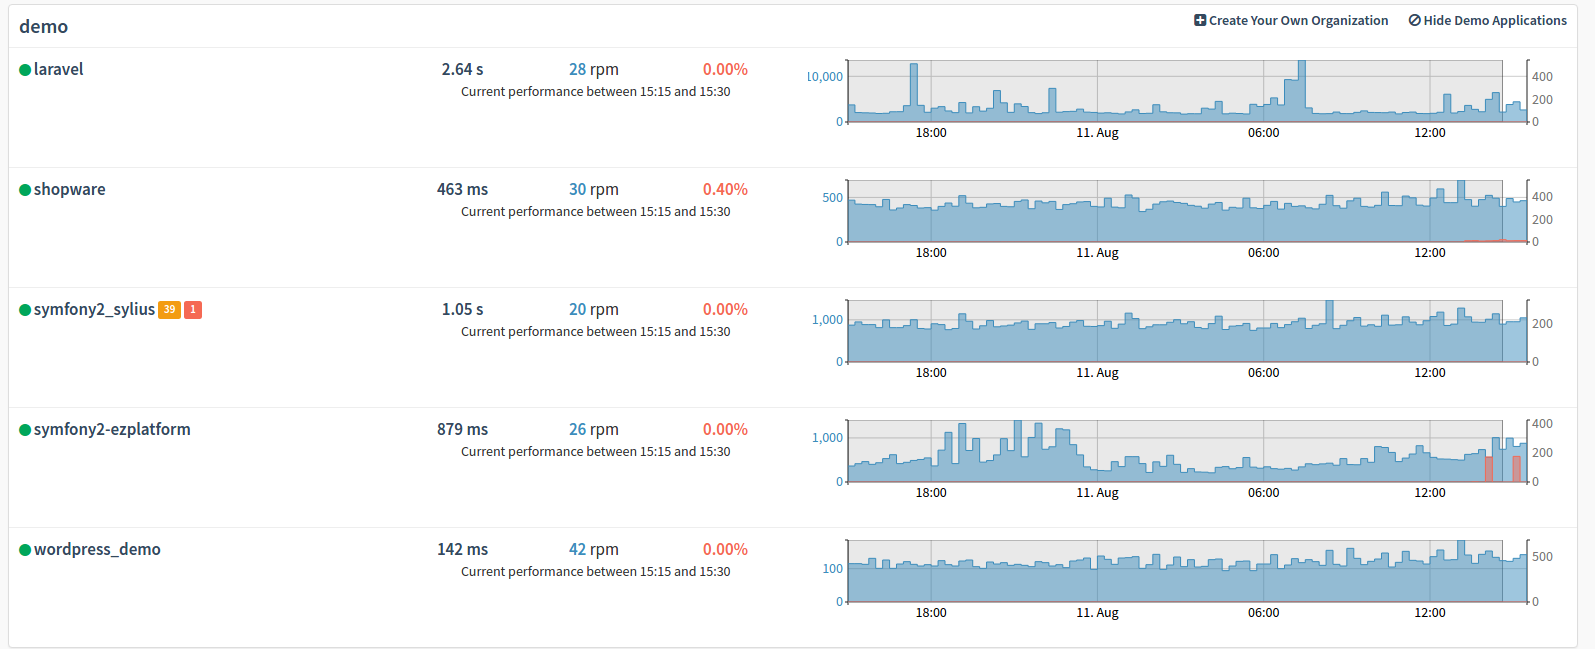 New Dashboard with Preview Charts for demo organization
In this screenshot you can see the dashboard for our current set of five demo applications.
This feature is immediately available for all applications with Lite, Basic and Standard licenses (not staging applications) and for all old request-based plans of sizes “Small”, “Medium” and “Large” (not for the “Extra Small (XS)” plans).
About the author

I am the founder and CEO of Tideways. I started the company over 10 years ago with the mission to move the PHP ecosystem forward, starting with performance. As managing director, I work across product, strategy, and the day-to-day of building a developer-focused SaaS business.
I’m a core contributor to the Doctrine open-source project and a founding board member of the PHP Foundation, which reflects my long-standing commitment to the PHP ecosystem. I particularly enjoy working at the intersection of application performance, developer experience, and the open-source community that makes PHP what it is. Outside of work, I enjoy board games, hiking, and coffee.