Improved Error and Exception Tracking
In the last weeks we rolled out several new features for Error and Exception Tracking in Tideways that we have been missing ourselves in the day to day work.
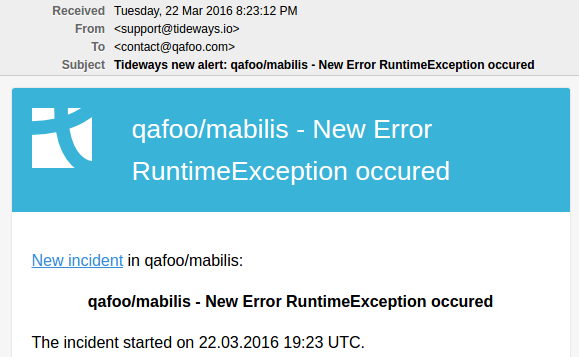
Tideways can now trigger alerts for you when a new type of Exception or Error occured in your application. This is extremely helpful to be up to date with new sources of problems surfacing in your application. Configure these alerts to notify you on Slack, OpsGenie, HipChat, IRC, Flowdock or the classic choice with E-Mail notifications, like this example:
 New Exception E-Mail Example
For errors that you do need to investigate further we have added new features as well. First, you will now see a chart of the occurances of this error in the last 24 hours. This can help you find out how frequently the error is happening.
 Error Occurances Chart
Another new feature Context information about errors, a list of additional information available for debugging the problem. You can pass this information to Tideways from your application using the customization APIs. An example for useful context information are the URL, user id, current users items in a shopping basket, users activated feature flags or A/B testing groups.
Sometimes Exceptions in your application are not exceptional, but just regular error conditions that don’t require further investigation. One such example is Symfony’s NotFoundHttpException which just indicates a 404. You can now ignore exception classes application-wide, when you think they don’t want to see them anymore.
To ignore an exception click “Not Error” first, then wait and click again when the button turns red and shows “Always Ignore”.
 Always Ignore Exception
Once an exception is ignored it will never appear again in the list of errors, won’t trigger alerts when it re-occurs and doesn’t count towards the global application or transaction error rates.
At last, we have fixed a bug that could lead to stacktraces not being reported in exceptions and errors. You need the daemon in the latest version (v1.3.7) to see stacktraces again.