
Improved History View, Traces including Server Metrics
PHP Performance
After a slow December of vacation and holidays we are slowly picking up steam again and are releasing the first new features of 2017 with an improved history and server metrics for traces.
History
The historical performance data that we collect for your application has been well hidden until now and was reached by clicking on links in the weekly report e-mail. Starting today, the history is more prominent and includes more features and data.
We have now enabled the “slim history” that is directly visible from the application overview and shows you the performance from Yesterday, Last Week and Last Month for comparison.

When you follow the links to the history view, then you can now see a more dynamic chart of the performance data and a new histogram that shows the full response distribution.
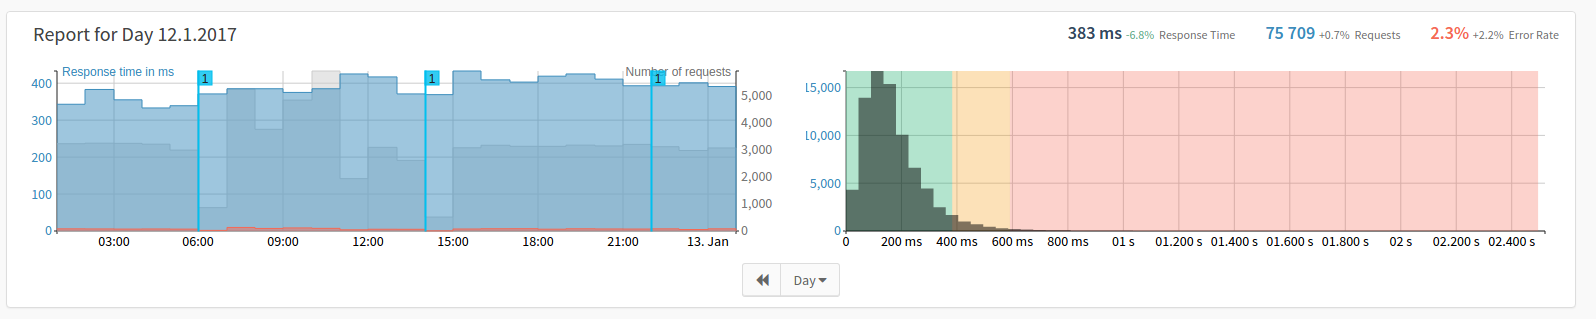
In addition to the weekly report you can now also view the historic data by day or month. Just use the select dropdown to toggle between the different views.
Server Metrics for Traces
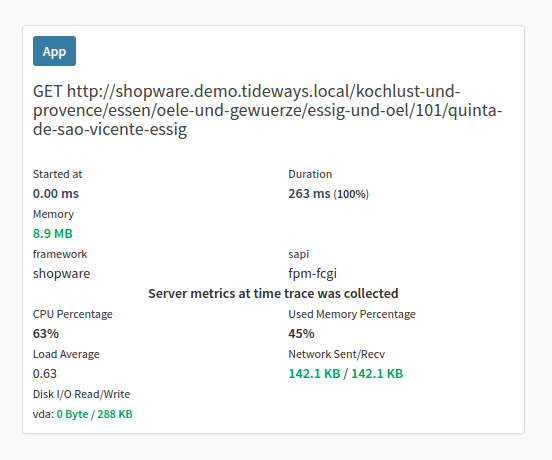
The latest version of the Tideways daemon now collects server metrics on CPU load, memory, I/O and disk usage during the execution of the trace. This information can be viewed directly from the trace details by looking at the main timespan details box on the right.
About the author

I am the founder and CEO of Tideways. I started the company over 10 years ago with the mission to move the PHP ecosystem forward, starting with performance. As managing director, I work across product, strategy, and the day-to-day of building a developer-focused SaaS business.
I’m a core contributor to the Doctrine open-source project and a founding board member of the PHP Foundation, which reflects my long-standing commitment to the PHP ecosystem. I particularly enjoy working at the intersection of application performance, developer experience, and the open-source community that makes PHP what it is. Outside of work, I enjoy board games, hiking, and coffee.