
Improved Time Explorer
PHP Performance
We have just rolled out an improvement to the Time Explorer, the low precision (15 minutes) chart that is rendered in the Dashboard and Application view with performance data for the complete retention period of your plan.
It is now shown directly below the the head navigation now and stays there when navigating through to snapshots or transaction details screen. Additionally it now includes the service and environment switchers that have been part of the main application graph before.
With this change the navigation of monitoring data is much more smooth and you don’t loose the context anymore by a complete re-render when selecting a timeframe.
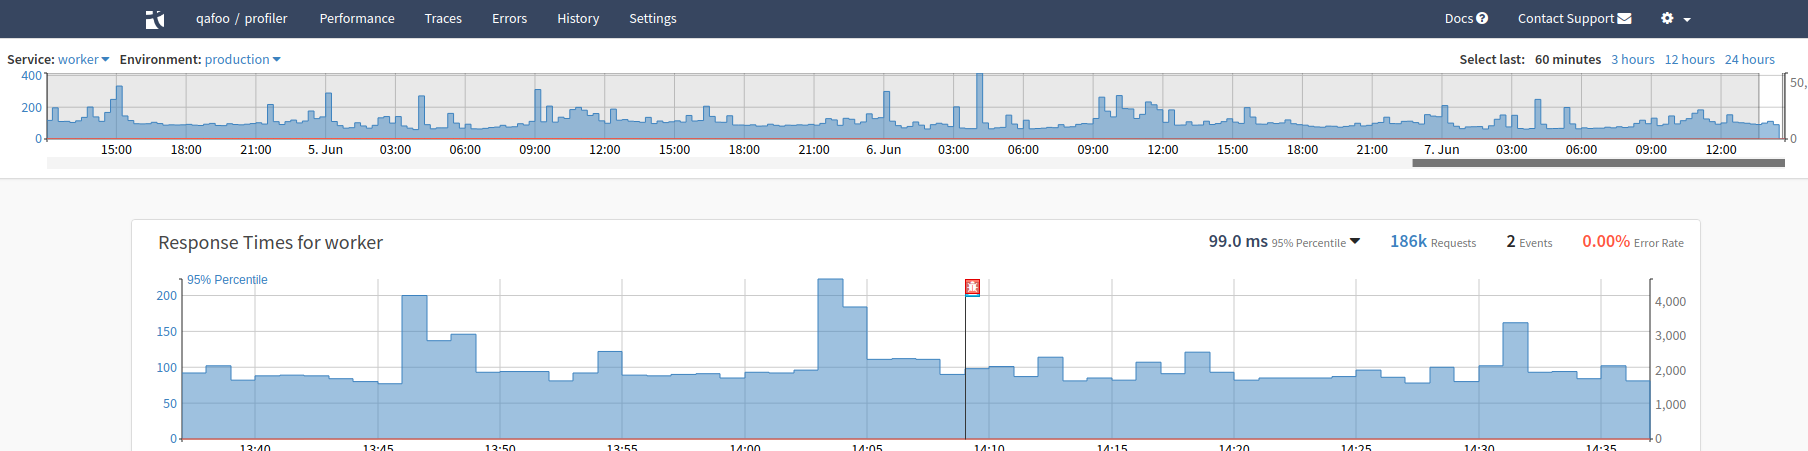
On plan with just 1 day retention no time explorer is rendered and you can still navigate the time using the four period lengths on the right, top side of the new navigation box.
About the author

I am the founder and CEO of Tideways. I started the company over 10 years ago with the mission to move the PHP ecosystem forward, starting with performance. As managing director, I work across product, strategy, and the day-to-day of building a developer-focused SaaS business.
I’m a core contributor to the Doctrine open-source project and a founding board member of the PHP Foundation, which reflects my long-standing commitment to the PHP ecosystem. I particularly enjoy working at the intersection of application performance, developer experience, and the open-source community that makes PHP what it is. Outside of work, I enjoy board games, hiking, and coffee.