
Improved Timeline Profiler with Stacktraces, Zoom and more
PHP Performance
We just shipped a huge update to the Timeline Profiler in Tideways that improves the level of detail and usability of this core profiling feature. This is the first major step of several more updates to come in the next month.
First, we have added a clear parent-child relationship between timespans in the timeline, so that a child span is now rendered below its parent in almost all cases.
In addition we now show the list of parents of a selected span in the details panel:
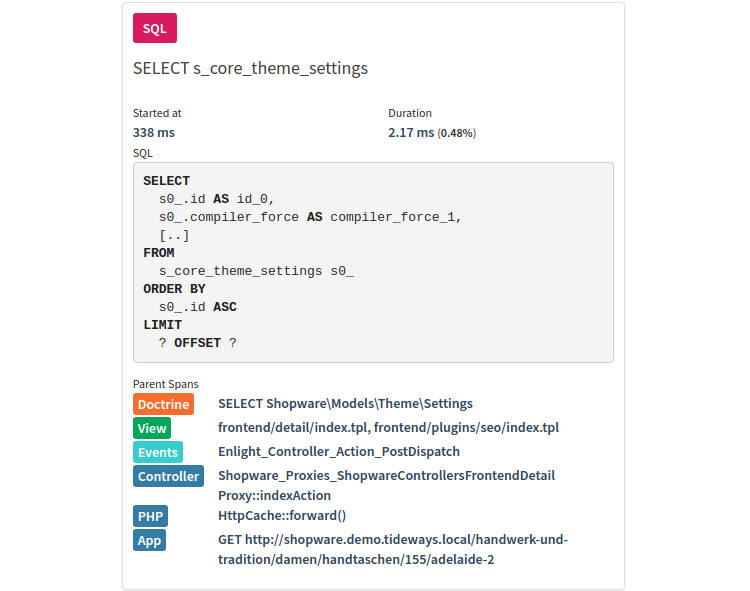 Span in Tideways Timeline Profiler with a list of all its parents
That is not the only information that we have added, with the release of PHP extension version 4.1.3 and daemon 1.5.8 we are now collecting the last 10 stack-trace frames of a span that takes longer than 50 milliseconds.
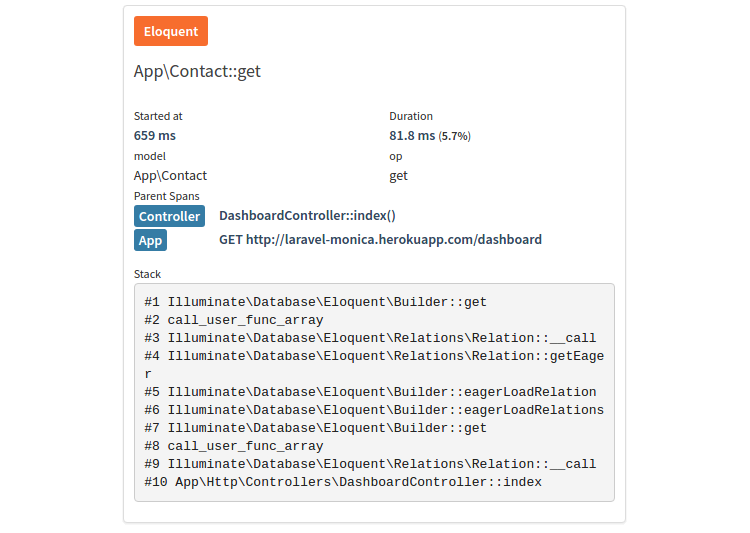 Stacktrace for a slow span in Tideways Timeline Profiler
You can configure this threshold to be lower if your application is very fast but we recommend it not be lower than 5-10% of your usual response time. We are still experimenting a little with the exact limits, but daemon and backend post-filter the amount of stacktraces depending on your plan.
The third improvement we shipped is a zoom behaviour for the timeline itself. When your trace has many small SQL or HTTP queries, potentially on various different datasources, then it helps to select just a portion of the timeline and look at the exact timings of each span more closely.
Using zoom is intuitive and uses a drag and drop behaviour to select the timeline.
 Zoom into a Tideways Timeline Profiler
About the author

I am the founder and CEO of Tideways. I started the company over 10 years ago with the mission to move the PHP ecosystem forward, starting with performance. As managing director, I work across product, strategy, and the day-to-day of building a developer-focused SaaS business.
I’m a core contributor to the Doctrine open-source project and a founding board member of the PHP Foundation, which reflects my long-standing commitment to the PHP ecosystem. I particularly enjoy working at the intersection of application performance, developer experience, and the open-source community that makes PHP what it is. Outside of work, I enjoy board games, hiking, and coffee.