
Summer Release: Slow SQL Query Log, Callgraph Profiler, Memory Tracepoints
Product

This Summer Release of Tideways builds on the previous Beta Announcements in May’s Spring Release and marks the general availability of
- Slow SQL Query Log
- Unified Callgraph UI
- Events and Templates in Callgraph Profiler
- Memory Tracepoints
This new functionality is fully available by updating the Tideways PHP Extension to version 5.2.4 and the Daemon to version 1.6.18.
In addition to rolling out new features, we also renamed the concept of “Application” in Tideways to “Project” and we provide a detailed explanation why at the end of this post.
Slow SQL Query Log
One major source of performance bottlenecks in PHP applications are slow SQL queries for a variety of reasons: Not using indexes, using the wrong index, using temporary tables and much more.
Tideways new Slow SQL Query Log provides a classic database slow query log with the application context to quickly identify and fix the faulty query:
- Transaction, Controller and Action Names
- URL and further information from the HTTP request context
- Stacktrace with all functions
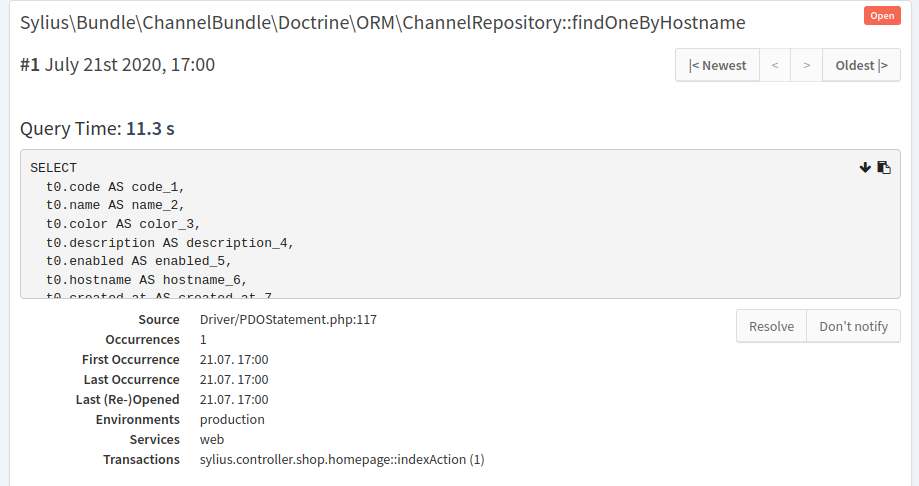
The Slow SQL Query log is using the same UI and workflows that Errors/Exceptions are and both are now grouped under a new main navigation module called “Issues”.
You can configure alerts to be sent when new Slow SQL queries occur in your application.
Unified Callgraph UI
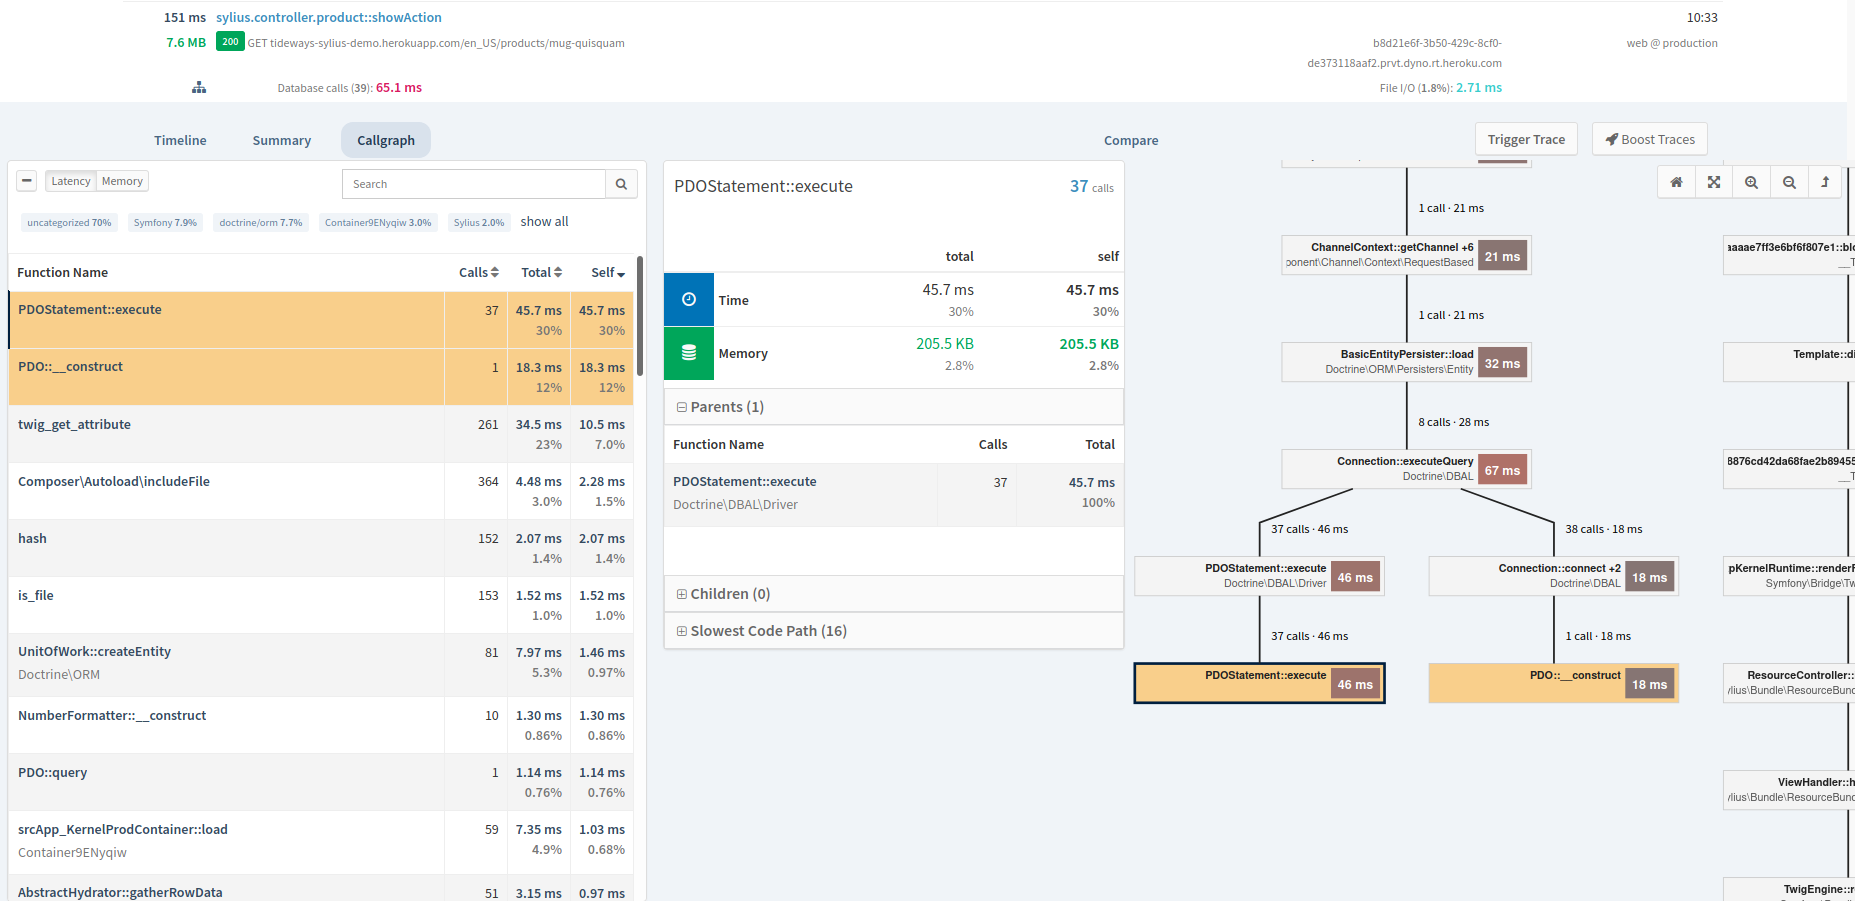
The “Calls” and “Callgraph” tabs in Tideways Profiler have been merged into a single screen to improve the insights into your profiling data. This is the most significant change to the Callgraph UI in over three years. Previously with both separated it often happened that while stepping through callgraph data, you lost the context when switching between both views.
Both calls table and callgraph data is now shown on a single screen and completely synchronized. We achieved this by making use of the full width of the screen and without loosing information that was previously shown.
This change was carefully done with a lot of users feedback and our own tests.
Now that the new Callgraph UI is live for everyone, we are still looking for your feedback: Does it improve or deteriorate your experience with the Callgraph data?
Events and Templates in Callgraph Profiler
A central problem of the Callgraph Profiler until now has been that every function was only present once, with all outgoing and incoming children and parents pointing to it. For applications using centralized Event and Template libraries this makes it harder to find the root cause of a performance problem.
From PHP Extension 5.2 on function nodes in the Callgraph can be split up by a “tag”. This is represented in the UI by adding an argument to the function node with the name of an Event or Template for example.
See this example for a Symfony EventDispatcher function call.
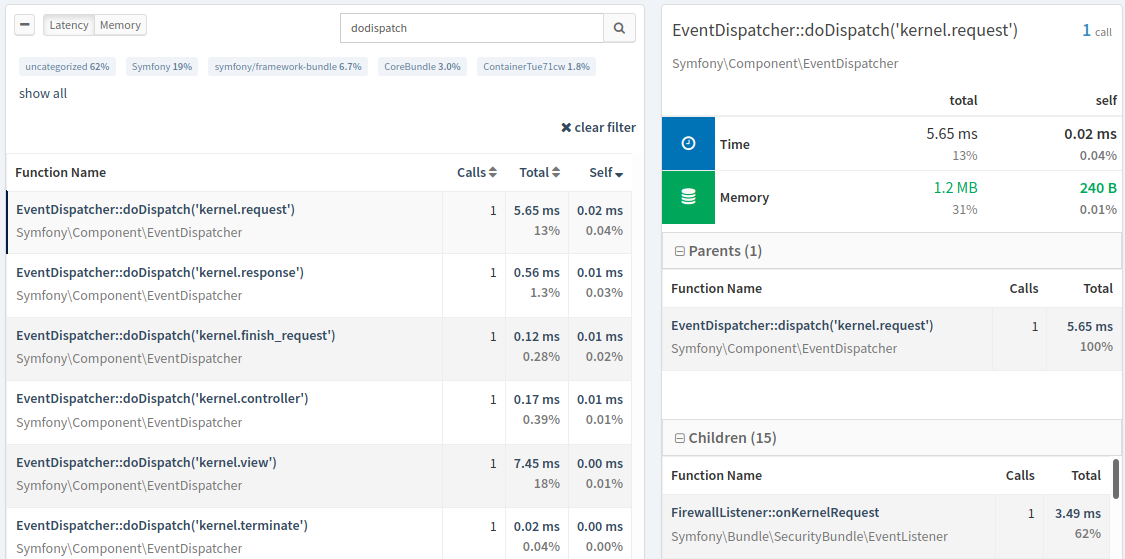
Previously this would be shown as just a single entry in the Calls table and it would be difficult to find out which event is responsible for which share of the EventDispatchers performamce.
Memory Tracepoints
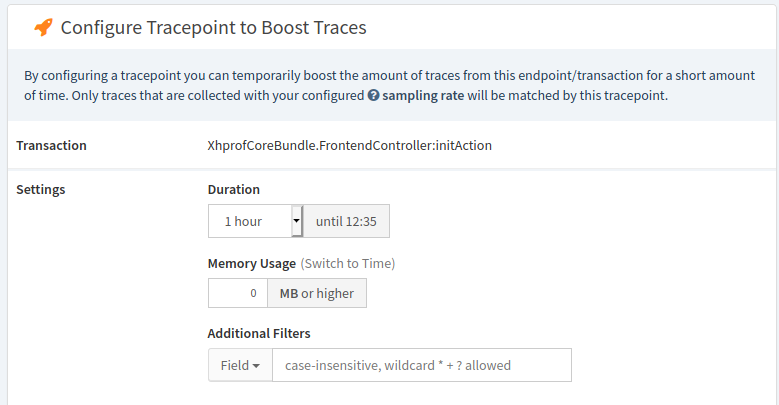
In the Winter release this year we shipped Tracepoints to give you a powerful tool to select the Traces you are interested in. We supplemented this with the Callgraph Tracepoint feature in Spring. Tracepoints so far have focussed on response time as filter criterion.
Starting with Tideways Daemon 1.6.18 you can now change the filter criterion to be memory usage of a trace. This is helpful to get traces including callgraphs for requests that are using excessive amounts of memory.
Renaming Tideways Concept “Application” to “Project”
Since the beginning Tideways used the name “Application” in the UI to represent what is better called a “Project”. The reason we think this name change is necessary can be explained by contrasting different project types.
For Tideways it does not matter if you have a monolithic applications with a single codebase, a few applications composed together or microservice architectures with many small applications. If they belong together they compose a “Project” that should be monitored and profiled together.
We have seen users create multiple Tideways applications, when a single one would provide the same insights. We hope the use of “Project” makes it clearer which applications and services should be grouped together in Tideways and which should be separated.
Every project can be grouped into individual units by the following dimensions:
- Services should be used to view the project from different perspectives: Different user groups interacting with a monolith application or different microservices.
- Environments should be used to split the project into their installations or deployments: Production, Multiple Production Instances by Region, Staging, Acceptance and Development.
About the author

I am the founder and CEO of Tideways. I started the company over 10 years ago with the mission to move the PHP ecosystem forward, starting with performance. As managing director, I work across product, strategy, and the day-to-day of building a developer-focused SaaS business.
I’m a core contributor to the Doctrine open-source project and a founding board member of the PHP Foundation, which reflects my long-standing commitment to the PHP ecosystem. I particularly enjoy working at the intersection of application performance, developer experience, and the open-source community that makes PHP what it is. Outside of work, I enjoy board games, hiking, and coffee.