
Tideways 2022.1 Release
Product
This new release of Tideways includes tracking exceptions with codes, improved notifications, improved trace filtering and sorting, several new features for the Callgraph Profiler and changes to the PHP extension.
Exceptions with Codes
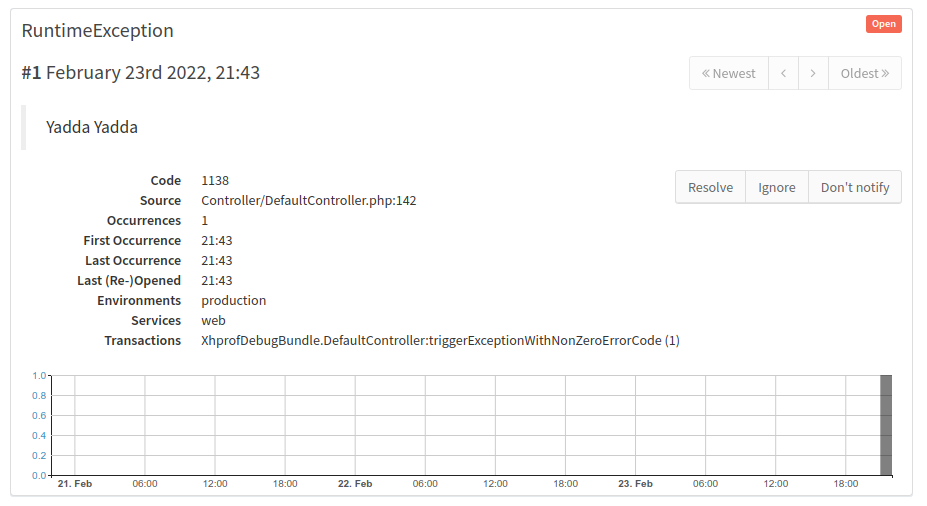
Previously when an exception was tracked by Tideways that had a non-zero Exception code, then this code was not transmitted to Tideways as additional debugging information. If your application code uses Exception codes to convey information this then from PHP Extension 5.4.36 and daemon 1.7.24 Tideways will collect and show it:
Improved Notifications
A few improvements to notifications are in this release.
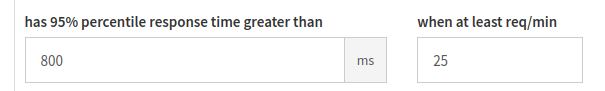
The response time and error rate notifications now only trigger if a minimum number of requests / minute threshold was crossed. This avoids flapping notifications during the times your application has low traffic, for example nights and weekends. For all existing notifications the threshold has been retroactively set to 10 requests / minute, for new ones it starts at 25 requests / minute.
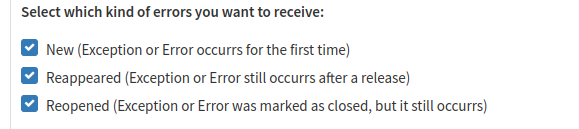
For the New Error/Exception notification there is a new filter to notify or suppress errors by their lifecycle status: New, Reopened or still open after release.
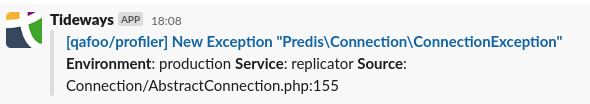
Notifications sent to integrations also include this lifecycle kind in their messaging:
Lastly, when previewing an integration in the configuration, there is now a visual feedback the preview was triggered.
Improved Trace Filtering
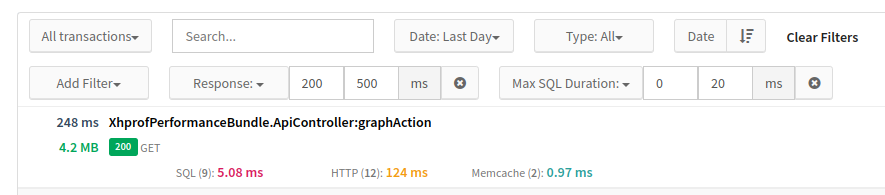
In addition to pre-defined ranges of milliseconds, the response time, SQL duration and other response and count based filters in the Search Traces UI now allow to specify custom ranges with minimum and maximum values.
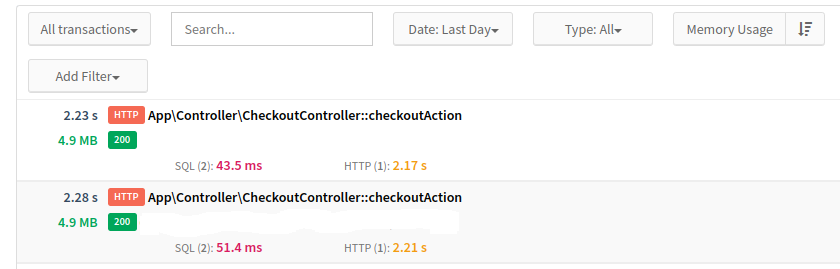
In addition to sorting by date or response time, traces can now be sorted by Memory Usage:
New Features in Callgraph Profiler
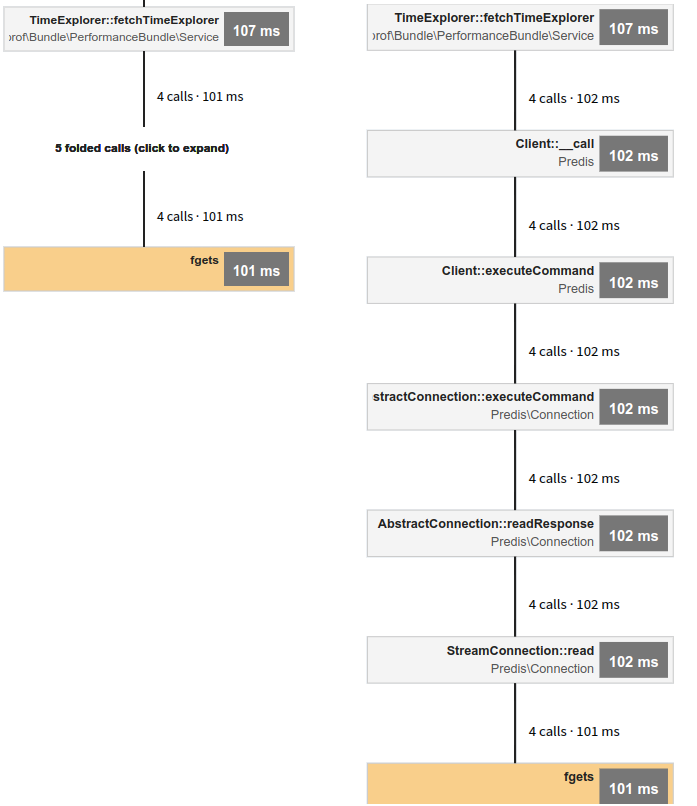
The folding of function calls has been improved by rendering dedicated nodes in the callgraph that state “number of folded calls (click to expand)”. This textual representation gives a much better clue what call folding is about and how you can work with it in the callgraph. By clicking on a folded call notice, the hidden calls in the chain will become visible.
The Profiler now gives a little hint about compiler optimizable functions. To avoid falling into a micro optimization trap, this hint is only shown when the calls are responsible for at least 5% of a requests response time, starting at which case the compiler optimization could realistically provide a benefit.
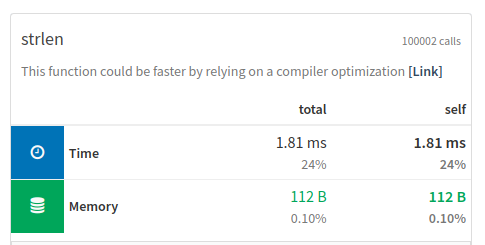
The Tideways reference documentation contains a new page explaining Compiler Optimized Functions in detail and how to automatically benefit from this optimization by using php-cs-fixer.
New and Updated Instrumentation in PHP Extension
With the release of PHP Extension version 5.4.38 and two previous releases in the last few months a number of new automated instrumentation is now included in Tideways:
- Support for detecting the Glue API service in Spryker based applications
- Support for argument capturing entity names from Shopware 6 Data Access Layer APIs (Changelog)
- Elasticsearch Query Payloads now get truncated to a maximum of 4000 characters to avoid extremely large search queries from slowing down serialization and transmission of traces to the daemon and breaking rendering in the trace UI.
- Timeline Profiler Spans created with the programmatic \Tideways\Profiler::createSpan API now receive special handling in the UI and are clearly marked as using the custom API.
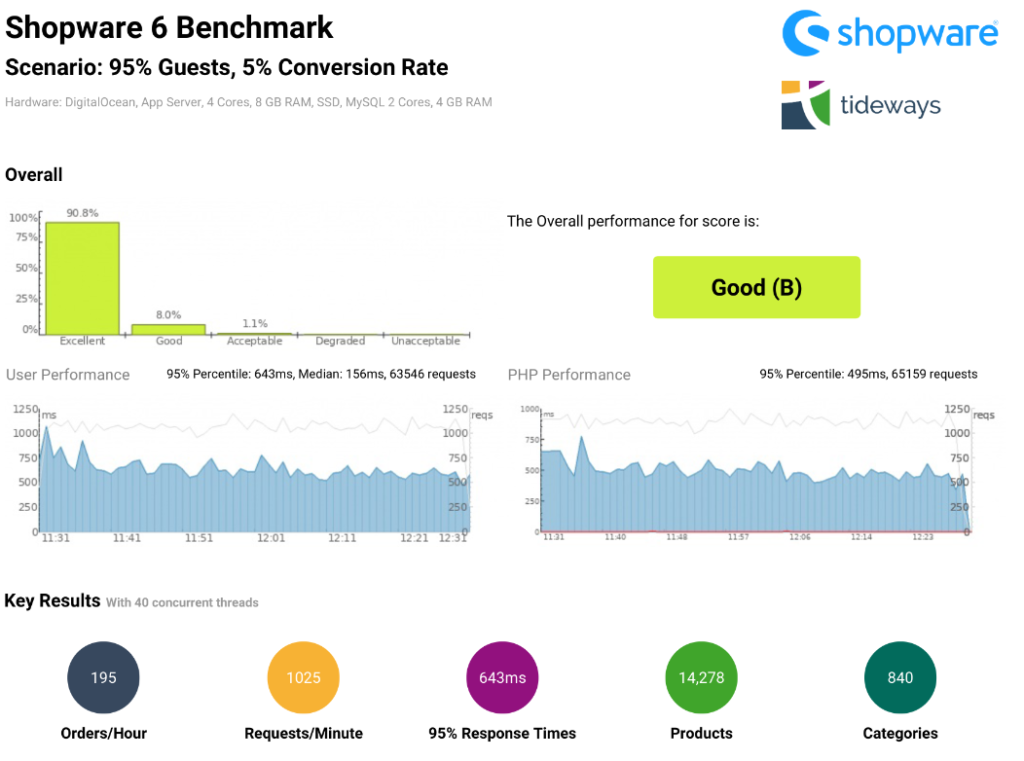
Shopware 6 Benchmarking
In collaboration with Shopware we have released the first beta version of a new open-source tool for benachmarking and load-testing Shopware 6 stores using pre-defined and configurable scenarios and user behavior patterns. See this example PDF report for a demo shop.
About the author

I am the founder and CEO of Tideways. I started the company over 10 years ago with the mission to move the PHP ecosystem forward, starting with performance. As managing director, I work across product, strategy, and the day-to-day of building a developer-focused SaaS business.
I’m a core contributor to the Doctrine open-source project and a founding board member of the PHP Foundation, which reflects my long-standing commitment to the PHP ecosystem. I particularly enjoy working at the intersection of application performance, developer experience, and the open-source community that makes PHP what it is. Outside of work, I enjoy board games, hiking, and coffee.