Tideways August 2015 Release Changelog
This month we have shipped a number of smaller improvements and features in the user interface that you should not miss. We have written an introduction to each of them and included short videos that show how they work.
Improved Bottleneck Detection and Reporting
We have automatically detected common bottlenecks in traces for a while now. In November last year we introduced initial support for SQL and HTTP bottleneck detection and added session block detection in Feburary as well as detection of Garbage Collection.
This month we are adding two new bottlenecks:
- Xdebug Enabled
- Compile Overhead due to missing/full bytecode cache
Additionally, visibility into bottlenecks is now much better, due to a set of changes:
- Each trace that exhibits bottlenecks now has a new tab that explains the bottleneck and suggests one or more detailed solutions to fix them.
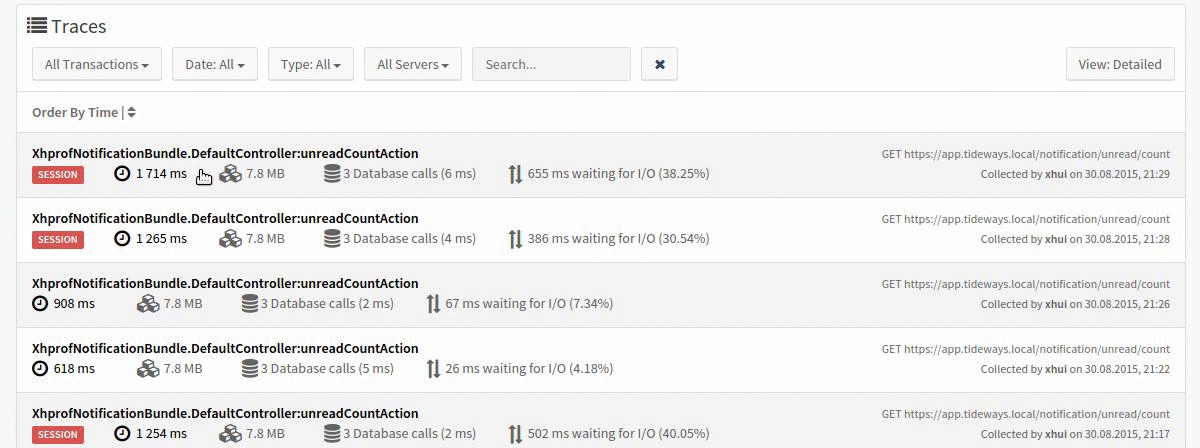
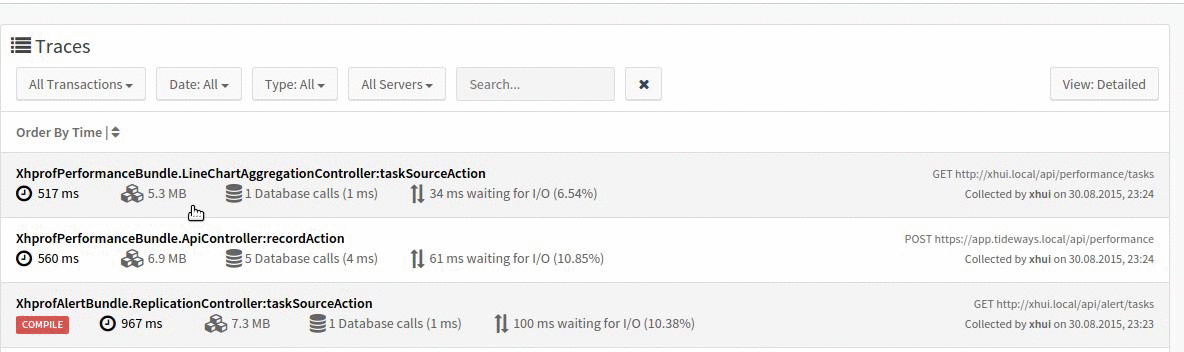
- In every weekly report, we highlight a number of traces with interesting properties. These traces are either very slow or contain significant bottlenecks. You can see them both in the weekly email and in the history screen. Only reports starting from last week will have this information available. This data is available independent of your organizations retention.
Improved Profile Filtering
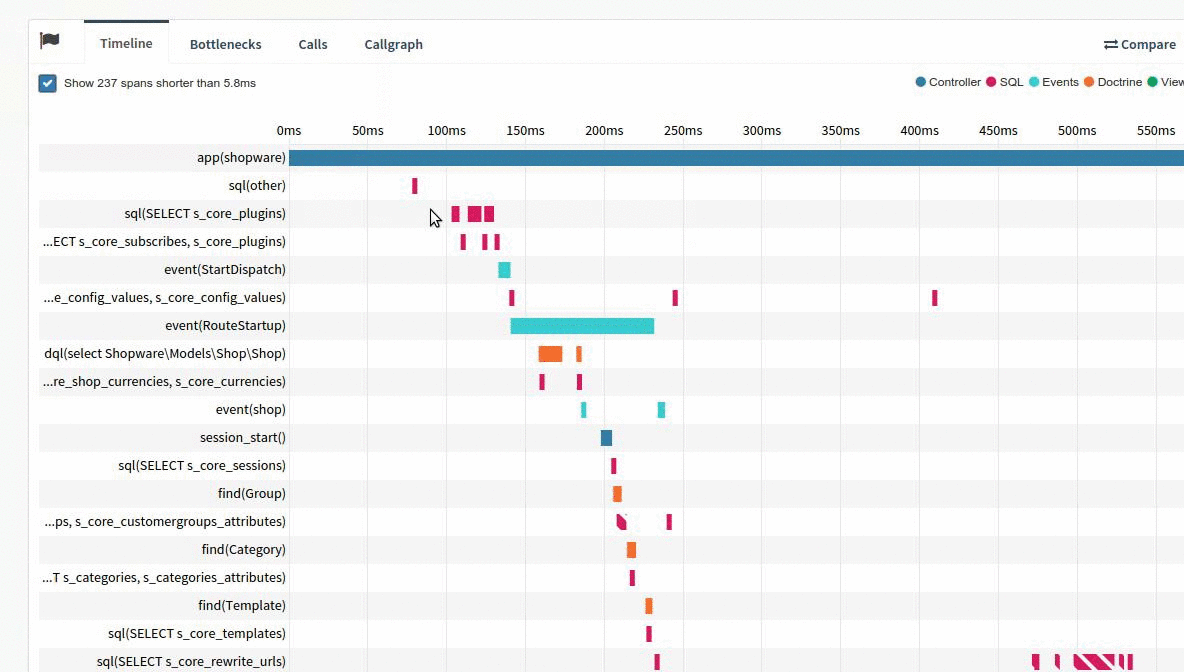
Finding the right trace to analyze requires a good search and filter functionality. This is even more important after we switched from Callgraph (XHprof) to Timeline traces, because we are now collecting more individual traces.
We re-wrote the user interface for profile filtering from scratch. This includes adding more filters, more details in the results and quicker responses and rendering. The selected filters are now stored permanently, so that you can continue with your analysis and navigate around the Profiler without loosing them.
Access Historical Data from UI
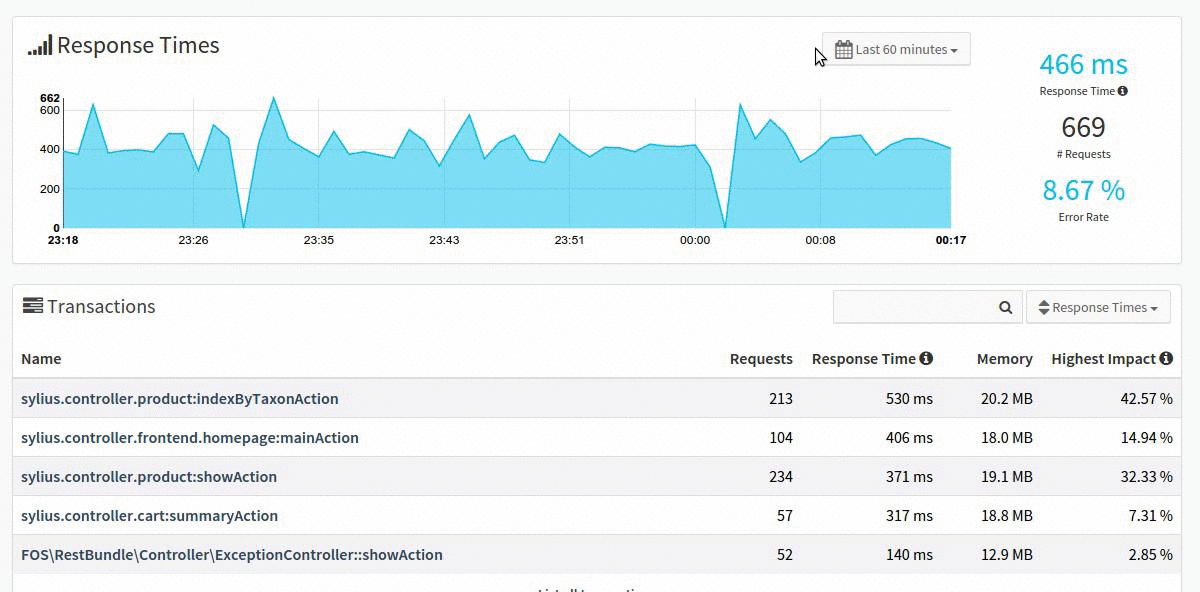
Every Monday we send you an email with the performance data from last week, compared to the previous week. This data is now available in the user interface as well, when clicking on the link for “History” in the Time Selector of the overview screen. The weekly mail links to this page as well.
On the history page, you can see the weekly metrics, interesting traces and a trend report. This data is saved forever and not part of the data that gets pruned after your selected retention.
Roadmap
In September we will focus on improving the Profiler, collecting more and better data and adding support for MongoDB, RabbitMQ, Beanstalkd and Redis. We have been working on a much improved SQL profiling and will ship it to some early testers during the first weeks of September.
You can take a first look at the results from the SQL parser for the Shopware demo application that we are running in the following video: