
Trace Timelines Public Preview Available
Product
We are happy to release a first public preview of Trace Timelines for Linux today that we unveiled two weeks ago. You can find the PHP Extension v2.0.3 on the downloads page. Please note that this a preview and there might still be bugs.
A small number of our customers have tested the new feature already and provided a lot of feedback, most of which we already incorporated into the current version.
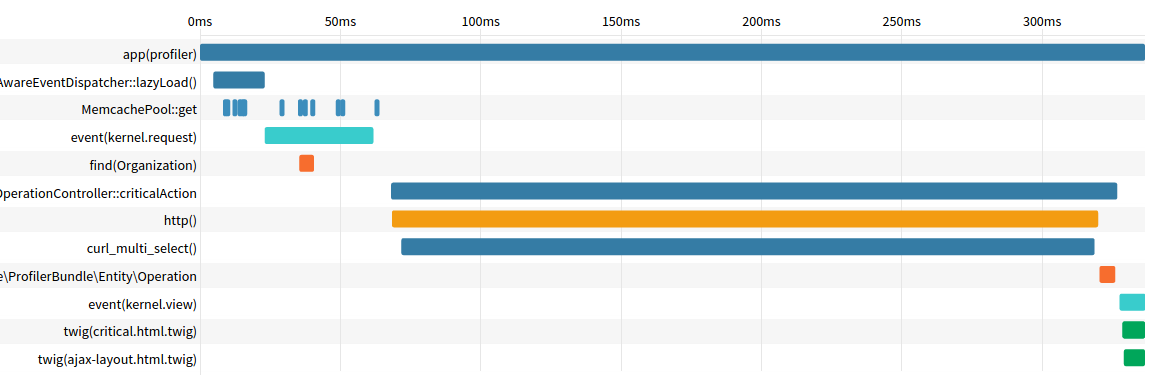
Improvements were made mainly on the user interface, mostly adding much more information to each individual span. Each timeline contains a large number of individual timespans that are PHP calls, Events, SQL or HTTP calls:
 Timeline
More information is available by hovering over each individual timespan.
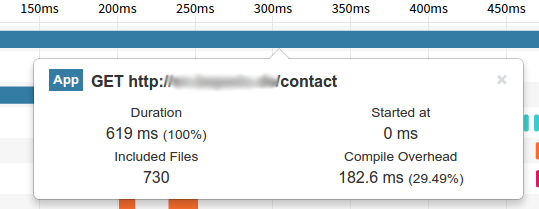
Take this first example for the main PHP request span. It contains the total duration and additional information such as the number of included files and the PHP compile overhead that this request required.
 Request Performance
In this case 29% of the request spent compiling php files points to a missing opcache extension.
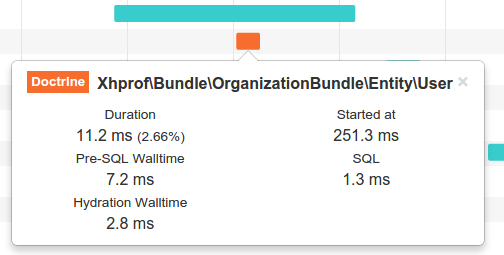
Another example is this Doctrine ORM timespan which contains information about the time spent building the SQL query and the hydration overhead.
 Doctrine Performance
With this information readily available a decision about writing this query manually or keep using the ORM can be quickly made.
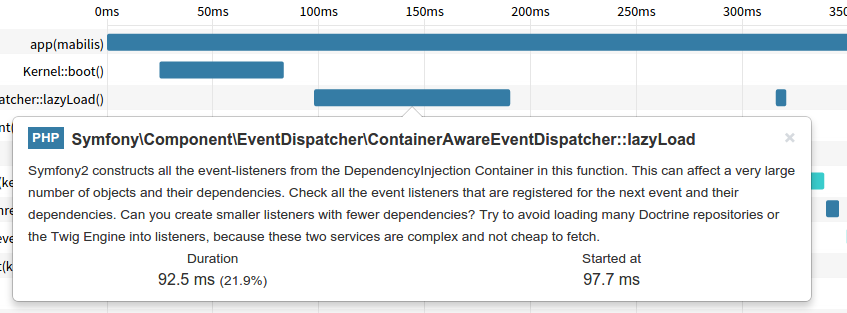
We also hook into framework specific functions that are known to be performance hogs, for example the service lazy load in Symfony’s EventDispatcher can take a significant amount of time per request.
 Symfony Performance
We are adding custom descriptions to guide you towards identification and fixing issues so that you don’t have to dig deep into the internals of third party libraries and frameworks.
These examples show features of the instrumentation that the new Tideways extension detects automatically. But the new Tideways is not limited to automatic instrumentation: Any span can be enriched with custom information and you can create your own spans declaratively and programatically. See the documentation for the API on adding custom spans.
On top of a much better insight into your applications, we can collect this profiling information at a much lower overhead than with XHProf. So far it runs 50% faster and we still have room for additional improvements. Going forward we will be able to trace much more individual requests allowing to paint a much better picture of your applications.
About the author

I am the founder and CEO of Tideways. I started the company over 10 years ago with the mission to move the PHP ecosystem forward, starting with performance. As managing director, I work across product, strategy, and the day-to-day of building a developer-focused SaaS business.
I’m a core contributor to the Doctrine open-source project and a founding board member of the PHP Foundation, which reflects my long-standing commitment to the PHP ecosystem. I particularly enjoy working at the intersection of application performance, developer experience, and the open-source community that makes PHP what it is. Outside of work, I enjoy board games, hiking, and coffee.