
Trigger Trace 2.0 Preview: What’s New
Product
Last year we asked all our customers what they think we should work on and “Triggering Traces” came out on top. We started planning a prototype in Winter last year and are ready to share the current state and a few ideas ideas as we launch the beta program. The general release date is planned for late February/March.
The Problem to Solve
To allow you investigating performance problems, Tideways collects traces from users, sampled to a limited number every minute and allows developers to trigger traces manually using the Chrome Extension or a CLI command.
But sometimes it is not that easy to trigger a trace, and there isn’t exactly the right one available from randomly sampled application requests.
We want the triggering of traces to be as simple as clicking a button or calling one command and you get a trace a few seconds to minutes later when any user of your site triggered the endpoint you are investigating.
So we want Breakpoints, but for Profiling, also commonly known as tracepoints.
Boost Traces of Selected Endpoints
The first pillar of our quest for better trace triggering is what we call “Trace Boosting”. When inside a transaction/endpoint, you will see a button to “Boost Traces”, which massively prioritizes traces of this endpoint being sent from a daemon to Tideways.
 Boost a Trace
You will be able to configure additional criteria when a trace should be boosted, for example only when slower than 500ms, when on specific hosts, urls or when any custom variable matches, for example userId equals 123.
These boosts run for an hour by default and will send you notification e-mails when the first matching trace is collected and a summary when the boosting period is over.
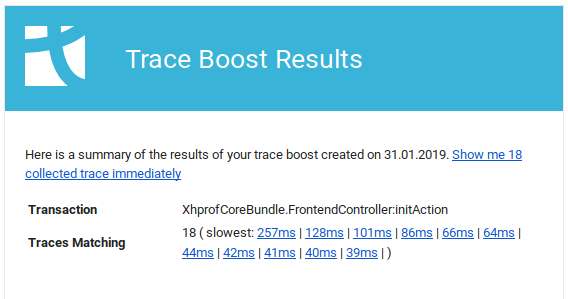 Trace Boost Report after 60 minutes via e-mail
This will give you access to timeline traces in a much more controlled way. But it still relies on traces being randomly sampled by the PHP Extension. If you set a sample rate of 20%, this means only 20% of the requests are evaluated against the trace boosting criteria, and maybe more importantly they only contain timeline profiling data, not function/callgraph level data.
For the first time we will also have a screen that is specific to your user, listing all active and past trace boosts to let you get back to your specific profiling session.
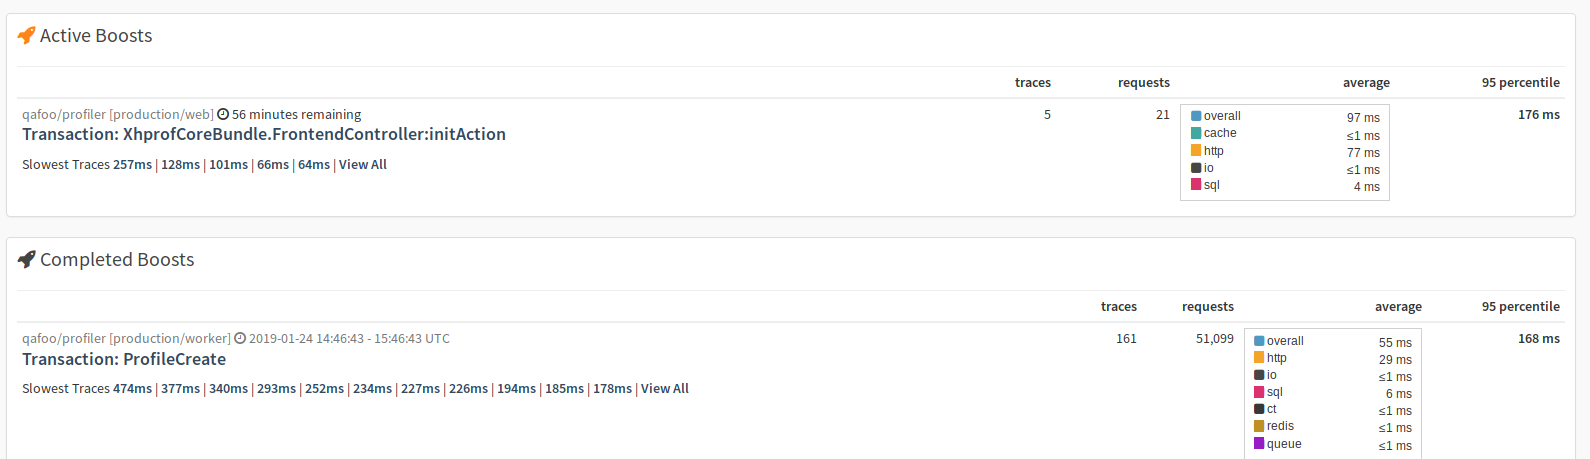 List of active and completed trace boosts
This screen is actually very exciting to ship, because we realized how a user-centric view of traces could massively improve the profiling workflow in general.
Tracepoints
The second pillar is a way to dynamically increase sampling and callgraph profiler activation in selected requests. For this functionality we are working on a feature we call “Tracepoints” that can be used standalone or in combination with “Trace Boosting”.
For a tracepoint you specify an entry point (script name or request uri), a new sample rate and optionally a function name that starts the Callgraph Profiler when called, for example main() or for example a controller name AppDefaultController::indexAction.
Tracepoints are synchronized back to the PHP extension in regular intervals.
Control via REST API and CLI
With trace boosts and tracepoints you get much more control over profiling with Tideways and to make it even more powerful, you can also trigger these features either directly using a REST API or with the “tideways” cli:
$ tideways trace:boost acme/demo-app "AppDefaultController::indexAction" Which is the same as clicking the boost trace button in the UI for this endpoint. Or for a tracepoint:
$ tideways trace:tracepoint acme/demo-app "/foo/bar" --sample-rate=100 --callgraph=AppDefaultController::indexAction Which triggers a callgraph on page /foo/bar with a sample rate of 100%.
Want to see it in action?
We are just finishing the internal alpha of this feature and are looking to roll out a beta version of some functionality to testers. If you want to get into the first batch, send us a ping to [email protected]. We will then activate this feature for more and more customers and incorporate their feedback for the final release sometime in March.
About the author

I am the founder and CEO of Tideways. I started the company over 10 years ago with the mission to move the PHP ecosystem forward, starting with performance. As managing director, I work across product, strategy, and the day-to-day of building a developer-focused SaaS business.
I’m a core contributor to the Doctrine open-source project and a founding board member of the PHP Foundation, which reflects my long-standing commitment to the PHP ecosystem. I particularly enjoy working at the intersection of application performance, developer experience, and the open-source community that makes PHP what it is. Outside of work, I enjoy board games, hiking, and coffee.