
Chrome Web Extension 1.5.4 release
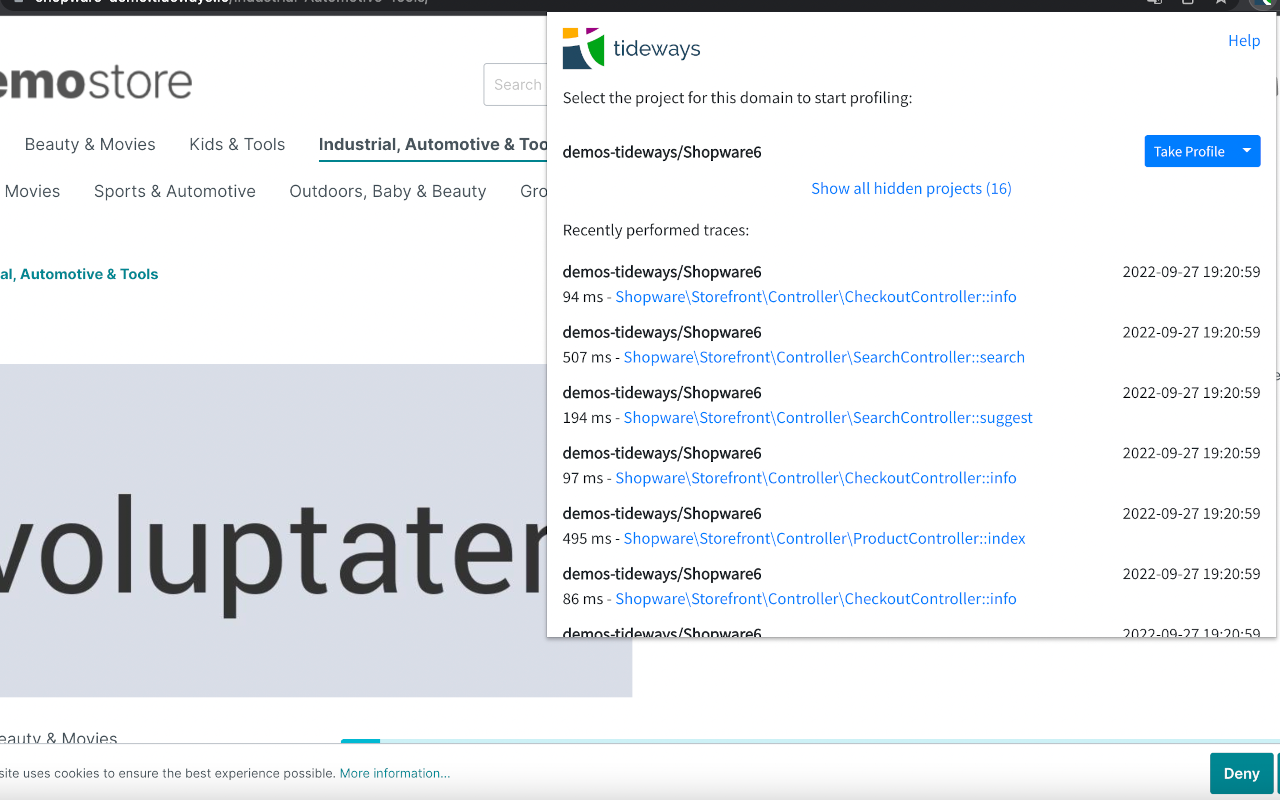
- New Feature: After an active profiling session for 15 or 60 seconds the extension now queries the backend for generated traces and displays them in the “Recently performed traces” section of the extension popup. The generated traces can be directly opened and it is not necessary to look for them in the “Traces” UI screen anymore. All traces of a profiling session are also connected and can be navigated to from the “References” tab of a single trace.
About the author

I am the founder and CEO of Tideways. I started the company over 10 years ago with the mission to move the PHP ecosystem forward, starting with performance. As managing director, I work across product, strategy, and the day-to-day of building a developer-focused SaaS business.
I’m a core contributor to the Doctrine open-source project and a founding board member of the PHP Foundation, which reflects my long-standing commitment to the PHP ecosystem. I particularly enjoy working at the intersection of application performance, developer experience, and the open-source community that makes PHP what it is. Outside of work, I enjoy board games, hiking, and coffee.