
Tideways 2021.2 Release
Product
This quarterly release of Tideways includes External HTTP Monitoring, Observations about PHP Metrics and Application Configuration, a redesigned Callgraph Compare screen, the ability to name traces, a new GitHub app to synchronize users into an organization and many other features.
Update to PHP Extension 5.4 and Daemon 1.7 to access all new features of this release.
In this blog post we will provide a detailed overview of all the changes. We have also recorded a webinar that summarizes and shows all these features if you prefer video.
We also made a decision not to use the seasons for naming releases as Summer/Winter can mean something entirely different depending on your hemisphere. Instead we will now number our quarterly releases with the year as a prefix, starting with 2021.2 for this release.
External HTTP Monitoring
Almost every application needs to integrate with one or many other applications through HTTP-based APIs. These integrations are often the cause of failures and slowdowns and deserve thorough monitoring.
Tideways now supports this with a minute by minute monitoring of every external HTTP host that your application communicates with, recording typical average response times and problem response times and the failure rate of HTTP 500+ requests in proportion to successful requests.
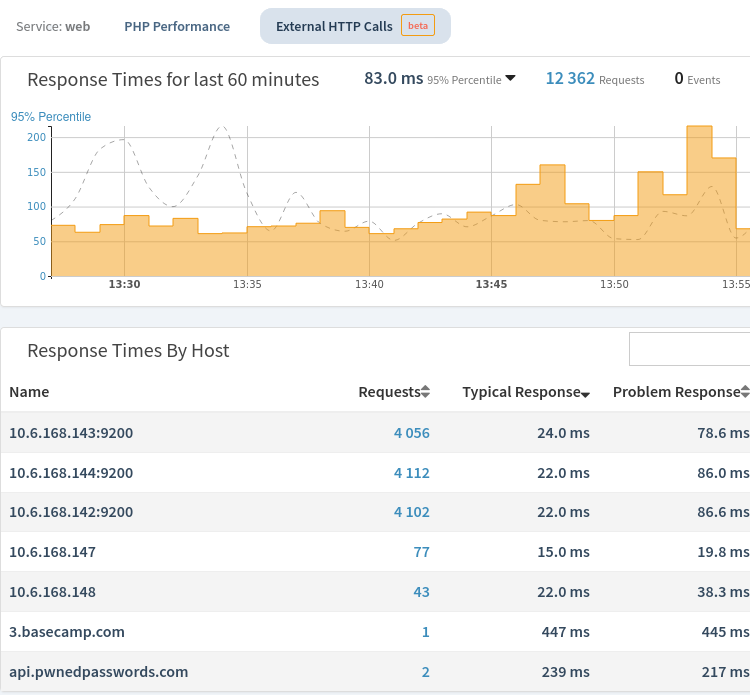
Each HTTP host can be viewed in detail where a list of all traces calling the host are listed in every plan. In the pro plan Tideways also tracks the performance of requests to the external HTTP host over time.
For HTTP Hosts that are monitored by a Service within the same Tideways project you can manually link them to each other through the Services Settings page by linking the primary hostname. The UI then allows to simply switch from HTTP Monitoring directly to the service.
Observing PHP and Application Metrics
Performance does not solely depend on code and databases, but also on PHP and Application configuration and metrics. The most important configuration values for PHP are OPcache related and for many frameworks there are important configuration options that influence performance.
Starting with this release Tideways will observe PHP configuration and runtime metrics as well as known application configuration options that affect performance and make Observations about them.
You’ll find the observations module under “Issues” then “Observations” in the Tideways UI and it will show you all observations in either error, warning or pass state.
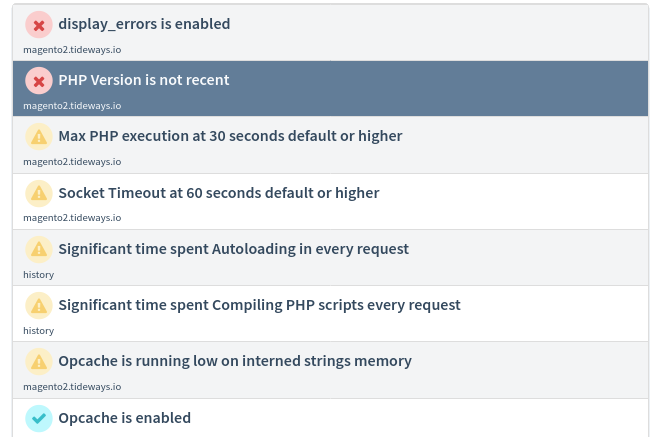
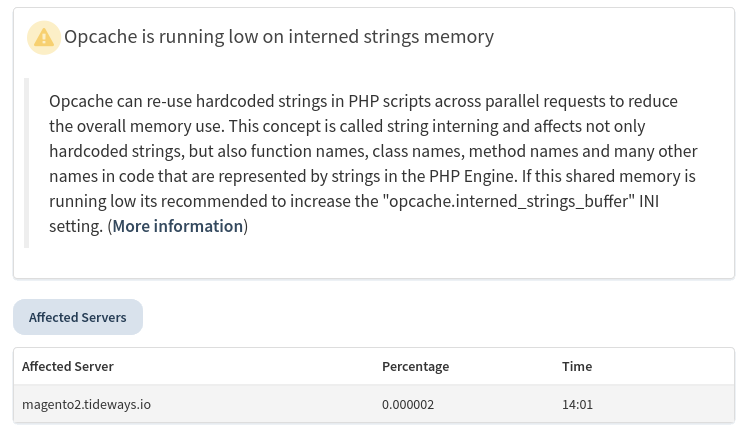
For now the observations are related to OPcache, Realpath Cache, Timeouts and other core PHP metrics. A handful of Shopware 5 and 6 specific observations start our work on application specific observations for now. Each observation provides information about cause and remedy including a detailed documentation page with explanations. Here you an see an application that has the OPCache Interned strings setting configured too low:
Compare Callgraph Redesign
Last year we completely redesigned the callgraph screen to provide a unified UI with better navigation and more information on a single screen. When comparing two callgraphs with each other it now uses the same unified UI.
Start with visiting a trace with callgraph that you want to compare to another. The navigation contains a link to “Compare”. Select the trace to compare with the current trace and the following screen will show the “Callgraph” compare.
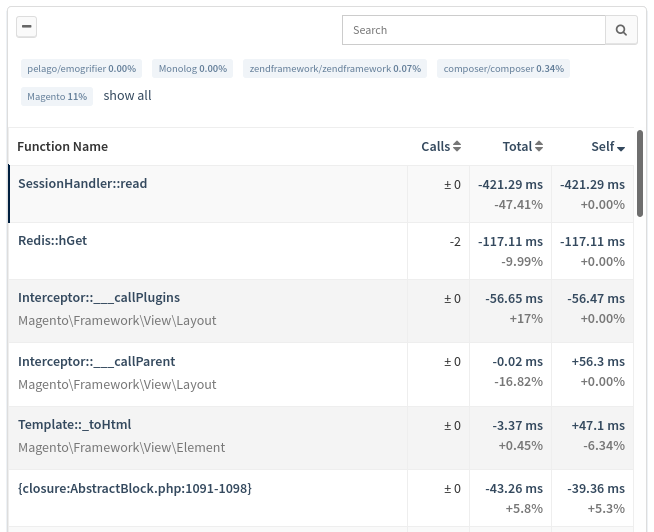
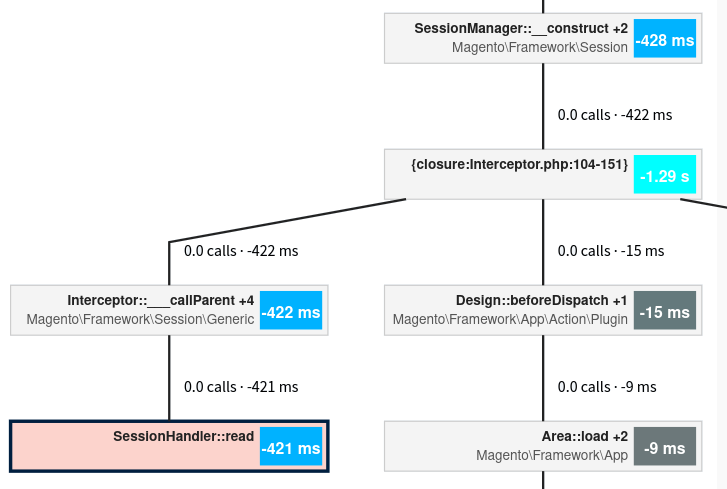
There is also the familiar callgraph view that now shows a diff of the two compared callgraphs:
Give Traces Names
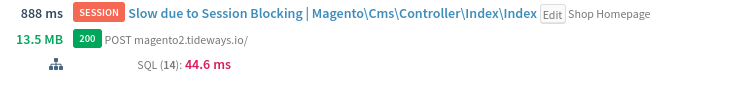
To better aid the performance optimization process you can now give traces a name that describes them and helps you to organize them for reference and comparison.
Click on the “Edit” button next to the transaction name of a trace and enter a name or description of what the trace represents for you.
You can find a list of all the traces you named on the “Traces” “History” screen.
Retry failed data collection requests from Daemon
Starting from version 1.7 of the daemon package, failed network requests with monitoring and profiling payloads for the backend are now retried for a few times instead of dropped immediately. This prevents the occasional one minute drop of data that was happening before, because of network problems and will help with the rare cases where the backend suffers from a downtime.
The retry mechanism works with two failsaves: It only stores up to 50 MB of payloads in memory and retries to send them for a maximum of 5 times in intervals of 60 seconds.
Symfony Messenger and Shopware 6 Worker Integration
While Tideways already supports instrumenting worker queues written in PHP, they currently need custom instrumentation of the processing loop to start and stop individual traces for each processed job/task.
If you are using Symfony Messenger or Shopware 6 worker queues then you can now use our Composer package instead, that makes this instrumentation quick to setup and integrate in your application.
GitHub App to synchronize Users into Teams
Tideways already allowed you to synchronize users from GitHub teams into an organization using their OAuth authentication. But since their OAuth tokens are tied to single users and not to a GitHub organization, this required the user that set up the synchronization to stay a GitHub admin to keep the synchronization working.
We have now migrated to a GitHub app that provides the team synchronization features. You can install the GitHub app between your GitHub and Tideways organizations through the “Integrations” admin screen in Tideways.
Afterwards you can create new teams and link them with a GitHub team in your organization.
Documentation: Synchronize Github Teams
PHP 8 and JIT Support
While Tideways already supported PHP 8 since its release in December 2020, it did not yet work in conjunction with the JIT. We have now rectified this by using the new Zend Observer API which supports both Profiling and JIT to work in combination. As a side effect it should reduce the overhead of Tideways on PHP 8 even more than with the previous profiling hooks that we used.
New Features and Changes in Profiler PHP Extension
The Profiling PHP Extension got new instrumentation since the last release that will collect new or more detailed information in the Timeline and Callgraph Profilers:
- Magento 1: Added automatic transaction detection for SOAP and REST API
- Shopware 5: Detect
HtmlMinCompressor::minifyin Timeline Profiler as common source for bottleneck - Laravel: Added Blade template names as tags to nodes in the Callgraph
- Zend Framework/Laminas: Added template names as tags to nodes in the Callgraph
- Improved cURL Multi Instrumentation to work when
curl_multi_remove_handleis not used.
Additional changes in the extension include:
- New INI setting tideways.traces_max_seconds that defaults to 60 seconds. Traces running for longer than this threshold will stop collecting timeline data as viewing very long traces that take longer in most cases adds no new information that cannot already be seen in the first 60 seconds.
- Runtime metrics of PHP about Opcache and others are exported to the daemon in intervals of 60 seconds. This can be disabled by setting
tideways.features.stats=0 - Better Process / SAPI Information about FPM is sent to daemon, so that Tideways can detect multiple PHP-FPM pools and correctly see runtime metrics for each of them.
- All HTTP requests are always monitored to allow the new HTTP monitoring feature to observe 100% of all HTTP calls. You can disable this to only observe HTTP calls made in sampled traces by setting
tideways.features.monitor_http=0
That is everything for now. If you want to see some of these new features in action you can view a recording of our webinar about all these features.
About the author

I am the founder and CEO of Tideways. I started the company over 10 years ago with the mission to move the PHP ecosystem forward, starting with performance. As managing director, I work across product, strategy, and the day-to-day of building a developer-focused SaaS business.
I’m a core contributor to the Doctrine open-source project and a founding board member of the PHP Foundation, which reflects my long-standing commitment to the PHP ecosystem. I particularly enjoy working at the intersection of application performance, developer experience, and the open-source community that makes PHP what it is. Outside of work, I enjoy board games, hiking, and coffee.