
Tideways 2022.2 Release
Product
In this new release, there are changes to many different parts of the Tideways stack. This includes new releases to the PHP extension (5.5.2), daemon (1.7.26, 1.7.28), CLI (0.4.6), and Chrome Web Extension (1.5.1).
Add Generic Markers to Charts
In addition to the existing Release and Deployment events, it is now possible to add generic markers to the performance charts to indicate an event for example “Beginning of E-Mail Marketing Campaign”, or “OpCache Configuration Change” or “MySQL Upgrade”. Performance before and after the marker event is comparable to allow investigation of its effects on the application.
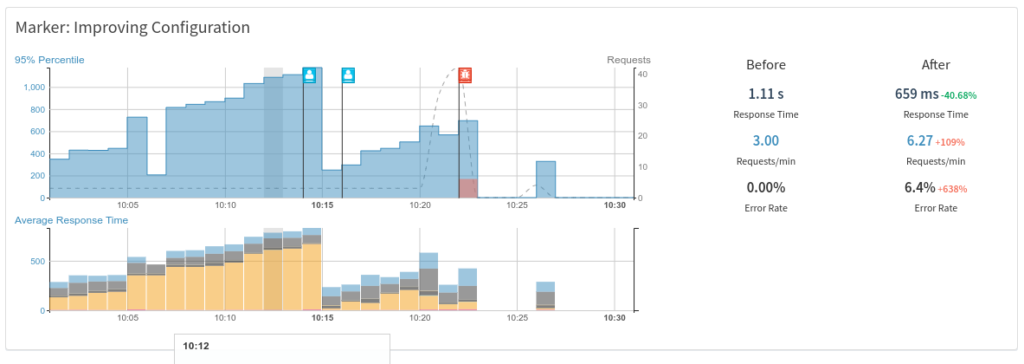
You can create markers through a new button called “Add Marker” that is now present on the Application/Service performance screens and for selected snapshots. In addition, markers can be created through the event REST API or the CLI.
Smarter Long SQL Statement Truncation
SELECT statements longer than 4000 characters are now using a smart parser in the PHP extension to keep all parts beginning with the FROM clause instead of the column list during truncation.
Before the new version 5.5 release (May 2022) of the PHP extension, very long SQL statements were truncated to 4000 characters to reduce the payloads sent from PHP extension to the daemon over socket or TCP/IP. This could produce truncated SELECT statements that did not include the FROM, JOIN or WHERE parts because the column list was already very large, for example including a subselect or entities with many fields in Doctrine ORM.
Chrome Extension shows triggered traces
The Tideways Chrome extension will now store links to the resulting traces when using the “Take Profile” feature. This will allow you to keep going back to the last ten recently generated traces by clicking on the Tideways extension icon inside Chrome.
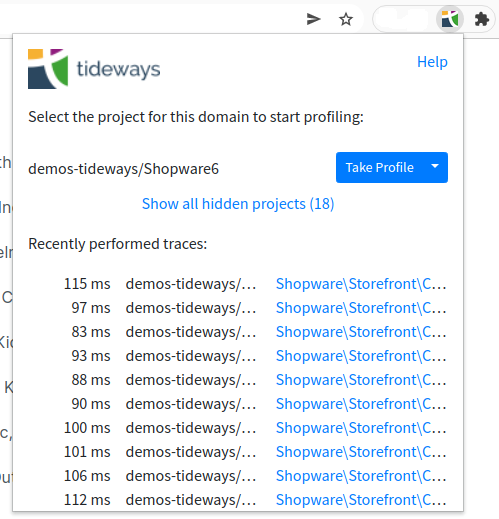
Before this change, it was necessary to click on the traces immediately in the popup to avoid losing the links.
Navigate between Referenced Traces
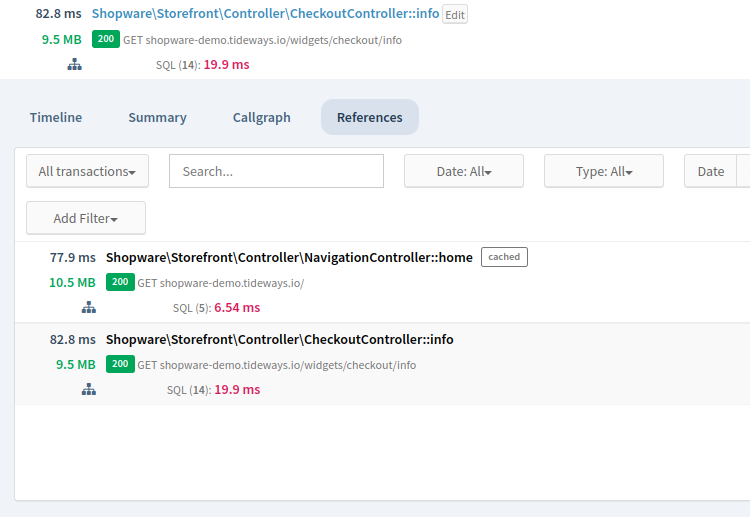
When you trigger traces through the Chrome extension, CLI or tracepoints, all traces include a shared reference UUID generated at the time and stored in our database. The trace view screen now has a new tab called “References”, which shows all referenced traces.
New and Updated Instrumentation in PHP Extension
The version 5.5.2 release of the PHP extension includes a few other notable changes:
- The transaction name of cached requests in Shopware 6 is now correctly detected. Previously the fallback transaction name “public/index.php” was used.
- We improved the Symfony instrumentation for event listeners and transaction name detection.
- Improved Laravel exception tracking support
- A bug was fixed for curl multi instrumentation incorrectly batching spans together, leading to information inaccuracy in the Profiler.
Other notable changes
There are a few other notable changes:
- The Performance Metrics REST API was improved to include median and all downstream layeImproved The Performance Metrics REST API to include median and all downstream layers in the response.
- The weekly report and export charts now show the requests as a second y-axis.
- Updated the CLI tool to allow sending events for any environment via the –environment flag. Previously the environment was hardcoded to “production”.
- SQL Connect operations are now identified as “CONNECT” in the Timeline Profiler instead of “OTHER”.
About the author

I am the founder and CEO of Tideways. I started the company over 10 years ago with the mission to move the PHP ecosystem forward, starting with performance. As managing director, I work across product, strategy, and the day-to-day of building a developer-focused SaaS business.
I’m a core contributor to the Doctrine open-source project and a founding board member of the PHP Foundation, which reflects my long-standing commitment to the PHP ecosystem. I particularly enjoy working at the intersection of application performance, developer experience, and the open-source community that makes PHP what it is. Outside of work, I enjoy board games, hiking, and coffee.