Tideways 2022.3 Release
In this post we post a comprehensive list of all the features that we have worked on and deployed over the last 3 months, all included in this 2022.3 release.
Monitoring
Page Cache Hit Rate for Services and Transactions
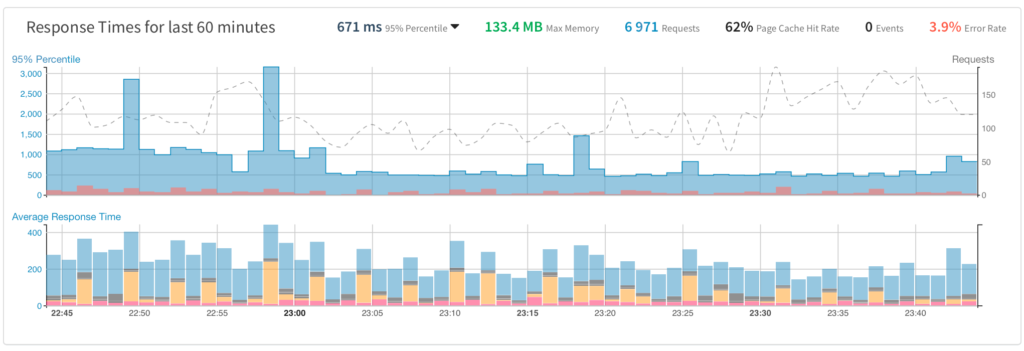
Monitoring for services and transactions now supports calculating the hit rate for PHP-based page caches. For example, if you have a full page cache storing the HTML on the filesystem, Redis or any system, then using the Tideways Profiler API, you can mark a response as cache hit or miss. The hit rate is then calculated on the service and transaction level automatically:

For Shopware 6 applications, automatic instrumentation into the Page Cache API is provided so that no code changes are necessary to calculate the cache hit rate.
In addition to the monitoring, there is also a new observation for the page cache hit rate, letting you know if it’s not doing it’s job. You can find more information in the Page Cache Hit Rate observation documentation.
One more for Shopware 6, there are extras; the product and category details pages have their own page cache hit rate observations.
- Feature Documentation: Page Cache Hit Rates
- API Reference: Tideways\Profiler::markPageCacheHit and Tideways\Profiler::markPageCacheMiss
- Observation Reference: Page Cache Hit Rate is low
Change the Default Environment Name
The environment support in Tideways previously had the hardcoded default environment “production” that received the primary load of traces. It is now possible to change the default environment to something other than “production”. See the documentation on how environments work and how to configure them if you want to make use of this change.
Profiler
Tagging Traces as Cached or Uncached
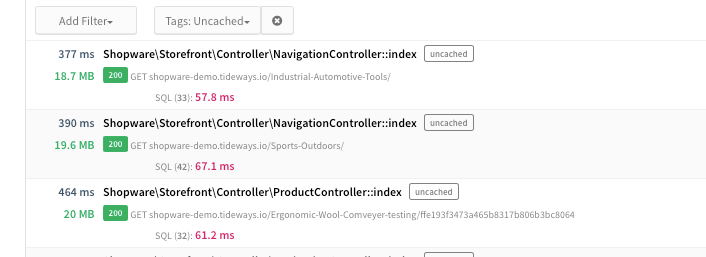
Using the page cache hit rate API introduced in the previous section, traces that are either cached or uncached are tagged as such in the trace list and details now:

There is a new filter “Tags” so that you can select “Cached” or “Uncached”. We are planning to add other tags and an API to add custom tags.
Callgraph Profiler: preg API regular expression profiling
With PHP Extension 5.5.8, the Callgraph Profiler includes support for argument capturing for the PHP functions preg_match, preg_match_all, preg_replace and preg_split. These functions are often performance bottlenecks due to inefficiencies in the patterns combined with their excessive use. By capturing the first 30 characters of all patterns, we group the functions in the callgraph, making it much easier to identify which regular expressions are performance bottlenecks and which are not.

Timeline Profiler: Shopware 6 Data Access Layer
The Timeline Profiler now includes timespans for the Shopware 6 Data Access Layer, similar to our instrumentation of Doctrine or Propel ORMs. For product and category DAL this even includes the Criteria query.
Exception Tracking
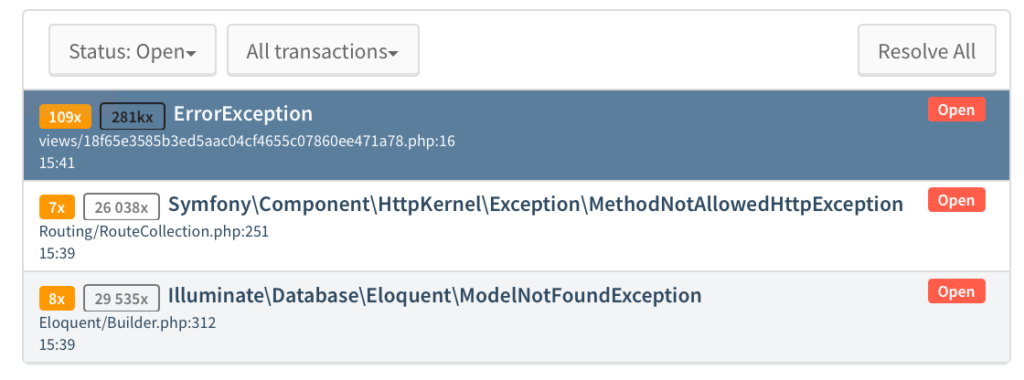
Resolve All Errors
We added a “Resolve All” button in the exception tracking list that allows resolving all open errors. This action only applies to the currently selected environment, service and optionally transaction(s).

This can be helpful when you want to reset the notifications and occurrences without having to create a release event.
Exceptions across Environments
Exceptions will now be tracked separately by environment starting October 1st 2022. The change is dated since its a backwards incompatible break from the previous behavior. You can opt into the feature using the “Beta Features” section of Tideways.
This change to exceptions by environment includes occurrences, stacktraces and notifications. When you are using different environments, then enabling this feature will initially trigger new notifications for all errors in non-production environments.
When triggering a release for an environment and service, only errors of these will get reset and notify again, according to your notification filter settings.
Chrome Extension
Building on the changes in the 2022.2 release, we have improved the Chrome Extension further:
- Show that profiling is still in progress when triggering traces for the next 15 or 60 seconds. This provides better feedback about the current state of a profiling session and prevents the trigger buttons from being clicked multiple times and causing confusion.
- Improve rendering of projects and previously collected traces in the Chrome extension popup screen.
Your chrome extension was auto-updated to version 1.5.2 a few weeks ago, which already includes these changes.
Commandline Interface (CLI)
We have relased the tideways CLI tool as version 1.0.0 now, it required very little changes and bugfixes in the past years, so that a 0-point version number does not communicate the stability of it well.
One user facing changes is included in this release:
- Bugfix: Always query backend for traces, even when executed PHP command failed with non-zero exit code. This is important when running for example phpunit, psalm or php-stan under Tideways profiling, while they throw errors.