Tideways 2025.2 Release
Product
In our second Release in 2025, we’re introducing additional performance insights to help you identify and resolve even more Bottlenecks faster and more effectively.
Detailed information is now integrated in our Weekly Report, namely the number and types of the observations discovered in your application. We’re eager to make it easier than ever to stay on top of optimizations.
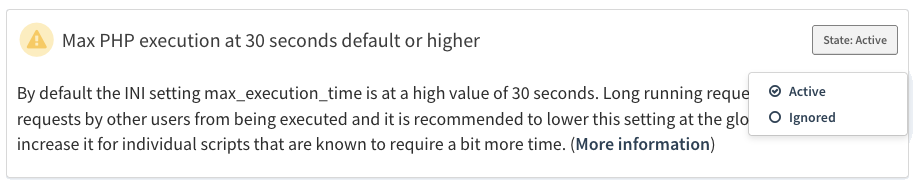
If some of the Bottlenecks should not match your particular project, you now have the option to ignore them, giving you greater control and flexibility.
We’ve also streamlined Checks and Alerts with a more intuitive service and environment selection UI – so setup is simpler and more user-friendly.
The Profiler was extended: We’ve added automatic insights for MySQL queries, flagging cases with missing or inefficient indexes. You’ll also get better visibility into session handler behavior, helping you catch subtle performance issues earlier.
More context. Smarter detection. Fewer surprises. Browse through our latest Release and keep your stack running smooth.
Dive into the Release and take your application performance to the next level.
Summary:
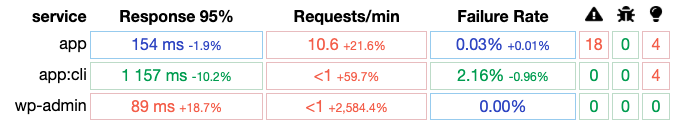
Bottlenecks in Weekly Report
Integrated into the Weekly Report, each customer can now find the statistics on the various observations, namely the number and type that were detected in their application during the past week. We have chosen the light bulb as symbol.
Mute Bottlenecks
Tideways’s list of observations has been growing steadily. If some of those don’t match your particular project, you now have the option to ignore them and to decide that they will no longer be displayed in your list by default giving you greater control and flexibility.

New Automatically Detected Bottlenecks
- Significant sleep/usleep usage You will get alerted if traces take a long time calling sleep/usleep and removing or optimizing can improve performance.
- Shopware6 / Consider using Elasticsearch/OpenSearch This Bottleneck highlights the need to consider using Shopware with Elasticsearch, especially given the potentially slow SQL aggregation queries (for price and properties).
- Symfony ErrorHandler::handleError If lots of deprecations, notices or warnings are being triggered, Symfony’s error handler can slow down requests significantly. Take a deep dive with our blog post on Composer Patches.
- ORM Query Parsing takes significant time Frequent use of Doctrine’s query parsing function can negatively impact performance.
- Doctrine ORM: Entity Metadata not cached This suggests metadata caching may not be enabled—something strongly recommended for production uses of Doctrine ORM.
- Refactor use of array_unique The Bottleneck array_unique suggests inefficient use of arrays; using unique identifiers as keys to maintain uniqueness automatically during insertion would be a suitable remedy. Looking for more details? Read our related blog post.
- wp_nav_menu usage takes up a significant amount of time Heavy use of wp_nav_menu may affect performance—consider using the Automatic plugin to cache navigation menus.
- Slow Google Analytics/Tag Manager Plugin Shopware, Magento and WordPress sites often use plugins integrating with Google Tag Manager. Caching these API calls or using custom implementations can increase performance significantly.
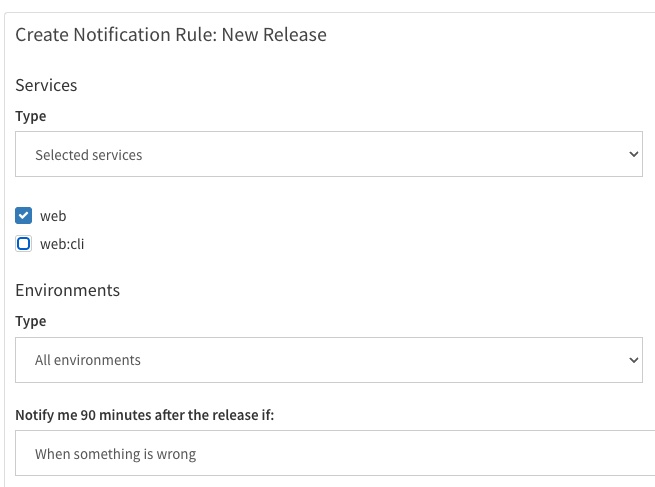
Overhaul of Service/Environment Filter for Checks & Alerts
You can now select which services and environments should trigger notifications via a drop-down menu. That means you don’t have to enter the complex services and environments filter language anymore to make this selection.
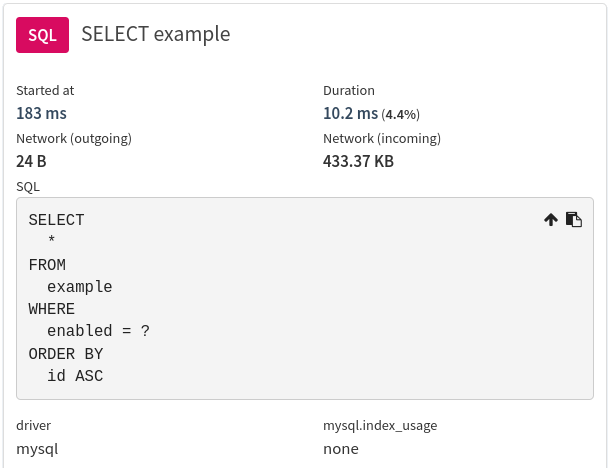
MySQL Statistics in Query Spans
When using MySQL, SQL spans in the timeline will now include additional annotations. The new mysql.index_usage annotation indicates when MySQL reported that no (none) or a bad index (bad) was used by the query.
The “Network” annotations known from HTTP spans are now also available on MySQL spans, giving better visibility into the size of query payloads and the amount of data fetched.
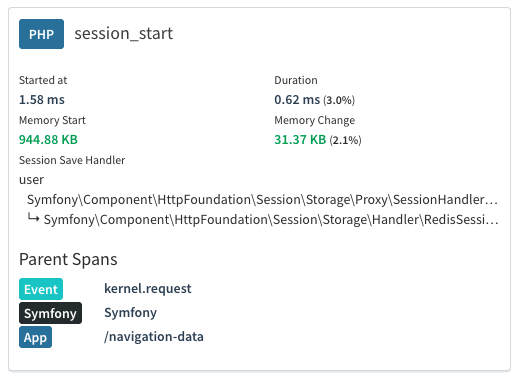
Insights on Session Handlers
During session initialization, it’s important to measure how long the process takes ****to ensure optimal performance. Blocking sessions is a regular bottleneck in PHP applications that Tideways points out.
A key configuration impacting session performance and blocking is the INI setting session.save_handler.
Traces in Tideways that open a session now show the save handler that is being used.
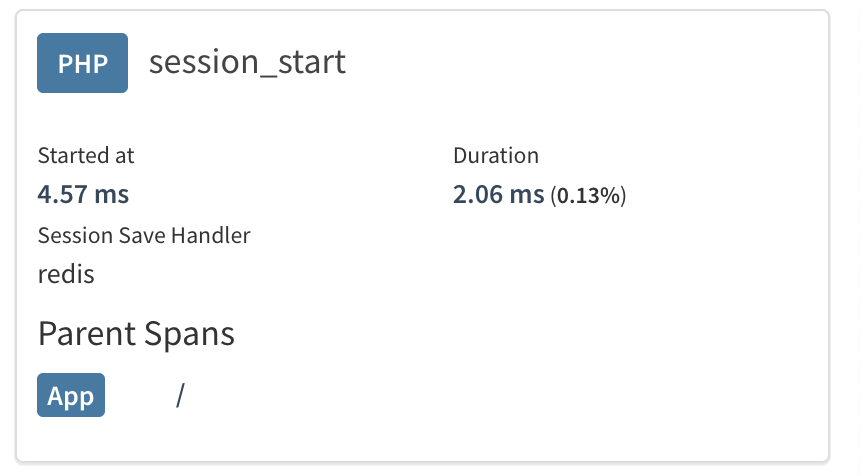
With this you can more get more insights on the current session behavior in your application.
For “user”-implemented session handlers, Tideways provides additional clarity on exactly what storage mechanism is being used by highlighting the concrete class.
Improve WordPress service and transactions
Several enhancements have been made to improve WordPress service performance and transaction handling:
WordPress cronjobs (wp-cron) are now fully integrated with Tideways’ transaction detection, allowing Tideways to capture each individual cronjob’s performance metrics.
The admin and the user interface of a WordPress application are now separated into two services automatically. This allows a clear distinction of their respective performance. Usually the user interface must remain fast and responsive, and for the admin interface performance is less critical.
Layer Metrics API in PHP Extension
Support has been added to make the raw layer metrics accessible via a new API. This means that the timings of the various layers (e.g. SQL Database, External HTTP calls) are now available to the application itself.
The primary use-case we have in mind for this API is the Server-Timing HTTP response header and its integration into frontend performance testing tools.
This feature is made available through the new method \Tideways\Profiler::getLayerMetrics().
This enhancement empowers developers and users to better integrate these information with other performance tools.
Time to get started with Profiling! With our free trial.
About the author

I’m a Content and Marketing Manager at Tideways, where I focus on content marketing, community building, and developer-focused communication. I enjoy turning complex technical topics into engaging content and creating meaningful connections within the PHP ecosystem.
As a passionate content creator and published author, I believe that great content starts with curiosity, authentic stories, and a genuine interest in the people behind them. Whether I’m working on marketing campaigns, building communities, or writing, I enjoy thinking outside the box and finding creative ways to engage and inspire others.