Posts

Performance Benchmark Report second half of 2025 for Shopware 6

How does your Shopware 6 store’s PHP backend performance compare to other operators of Shopware in general?

To answer this question, we have aggregated and anonymized performance data from over 200 Shopware 6 stores over the second half of 2025 and computed benchmark numbers to compare to for the most important page types: Product details, Category, Search, and Homepage.

We previously made these benchmarks for 2025 Q1, and 2025 Q2. Going forward, these will be published every 6 months.

Executive Summary

  • For the Shopware 6 operators in the Top 10% and 25%, the numbers show what is possible if you operate with a focus on backend performance. The top 10% of shops perform in the range of 200-300 ms on average and 400-600 ms in the 95th percentile.
  • Comparing with the previous Q2 benchmark, we see the numbers for product and category pages improving slightly across all categories on average, and decreasing for the 95th percentile. For search, performance degrades by 20%–40% in all cohorts.
  • The slowest 25% of shops have worse performance than in Q2 2025, showing a negative trend. This trend persists even when accounting for the high traffic Christmas season.
  • The fastest and slowest 10% are 6–26 times apart, showing that there is tremendous potential in analyzing and optimizing PHP backend performance with tools like Tideways.
  • Clearly, Shopware shops are not taking advantage yet of the performance improvements made to HTTP caching and other subsystems in the 6.6 and 6.7 versions.

Benchmark of average response times

Page10% Best25% BestMedian25% Worst10% Worst
Product Details271 ms415 ms639 ms927 ms1535 ms
Category Page247 ms463 ms735 ms1215 ms1919 ms
Search335 ms495 ms927 ms1663 ms3967 ms
Homepage57 ms135 ms335 ms671 ms1279 ms

Benchmark of 95th percentile response times

Page10% Best25% BestMedian25% Worst10% Worst
Product Details447 ms703 ms1151 ms1727 ms3071 ms
Category Page575 ms991 ms1599 ms2559 ms4607 ms
Search575 ms863 ms1663 ms3199 ms7679 ms
Homepage95 ms335 ms735 ms1471 ms2943 ms

Methodology

The data foundation for this is daily average and 95th response times of PHP requests in Shopware 6 shops that have an active Tideways subscription or trial during the second half of 2025 and reported data to our backend. This is measured through the Tideways PHP extension, tapping into the PHP runtime.

From a Core Web Vitals perspective, this is an approximate benchmark for the Time to First Byte (TTFB) of all requests in the shop that are served by the PHP backend. Requests served cached from Varnish, Fastly or other HTTP cache in front of the shop are not included.

A shop must have had at least 5,000 storefront requests that day processed by PHP in the backend and 250 requests of the page type to be included. Only shops using the default controllers for the product details, category list, search, cart, and homepage page types are considered. This leads to 151,193 data points included in the report, over 74,607 more compared to the last report.

Take these numbers with a grain of salt because they intentionally include Shopware users across all major PHP and Shopware versions, with Elasticsearch or MySQL-based search, with Shopware’s HTTP Cache enabled or using external HTTP caches (Varnish) and across all industries and customer personas.

See where your store ranks

To see where your Shopware 6 store is ranking, sign up for a free trial with Tideways and collect backend performance data. Tideways can recommend performance optimizations and provides effortless insights into all code-level performance problems.

PHP Benchmarks: 8.5 vs 8.4, 8.3 and 7.4

Each year, right on schedule, a new version of PHP is released at the end of November.

So, how much faster is this new release across popular frameworks and applications?

Our tests show that, in general, the performance between 8.2, 8.3, 8.4 and 8.5 does not move much for a Laravel, Symfony and WordPress demo application.

Moving to the newest PHP version isn’t a magic shortcut to better performance.

Not everything is bleak, though. In our post on PHP 8.5 Performance, Operations, and Debugging, we highlight several concrete ways to leverage new features to boost performance.

Keep in mind, however, that these improvements are only relevant if you use the corresponding functionality and may require some effort to integrate.

The most significant factor for performance is your application architecture and the code you write. To identify where to begin optimizing your application, Tideways—our production-ready profiling and monitoring tool—can help pinpoint areas for improvement.

To benchmark PHP, we have set up these popular PHP projects:

  • Symfony with PHP 8.5, 8.4, 8.3, and 8.2
  • WordPress with PHP 8.5, 8.4, 8.3, and 7.4
  • Laravel with PHP 8.5, 8.4, 8.3, 8.2

Our intention is to give you a rough idea of how much performance is improved as a percentage by just updating the PHP version.

WordPress supports many PHP versions in parallel, so we use it as a good yardstick for performance changes from PHP 7 to 8.5.

Setup

The benchmarking is done under these conditions:

  • Code and Infrastructure Provisioning: github.com/tideways/php-benchmarks
  • Machine: Hetzner CCX 33 (8 dedicated vCores on AMD)
  • OS: Debian 13 („Trixie“)
  • Database:
    • MySQL 8.4.7 for WordPress and Laravel
    • SQLite 3 for Symfony
  • PHP (all built by deb.sury.org): 7.4.33, 8.2.29, 8.3.27, 8.4.14, 8.5.0 RC 3
    • JIT not enabled
    • FPM with static pool and 17 workers.
  • Projects: Laravel 12.37.0, Symfony 7.3.6, WordPress 6.8.3
  • Vegeta v12.12.0
  • HAProxy 3.0.11

You can find more on methodology after the results.

Results

Symfony

Upgrading just PHP 8.4 to 8.5 makes the Symfony demo application run with almost the same performance when simulating a fixed number of 100 requests/minute. Fluctuations are within the margin of error.

When run with 15 concurrent requests, the requests/seconds also do not vary significantly between PHP versions:

Laravel

Upgrading just PHP 8.4 to 8.5 shows no visible difference to response times of the Laravel demo application.

And the requests/seconds are close to each other as well.

WordPress

Similar with WordPress, upgrading from PHP 8.4 to 8.5 shows no significant change in response times.

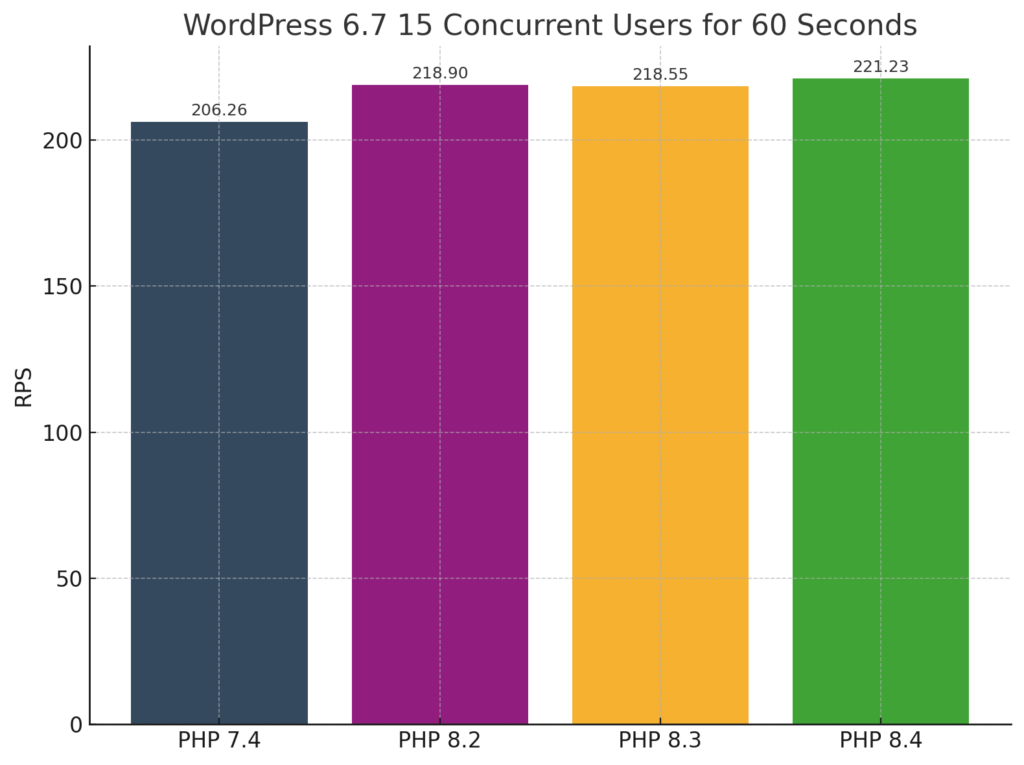
And the requests/seconds for 15 concurrent users are close to each other, with only PHP 7.4 showing a ~5% lower number.

❗With Tideways PHP Profiler, you can find bottlenecks in your application code by continuously profiling the production environment at low overhead. Get your free 14 -day trial to start optimizing.

More Notes on Methodology

With benchmarking, the results heavily rely on the assumptions and setup. There are a few changes we have made to other popular PHP benchmarks, and we want to discuss our methodology here.

We run the benchmarks in two modes:

  • With fixed requests per second, with a focus on response times
  • With a fixed level of concurrency, with a focus on requests per second.

Why do we not only report performance in requests per second? Other benchmarks often compare if a new PHP version can serve more requests per second. They do this by running as many requests as possible with a fixed number of concurrent threads that create new requests.

This provides synthetic or artificial comparisons because for real-world scenarios you would never run your PHP application at the limit of capacity and getting as many requests out as possible.

Instead, response time or time-to-first-byte (TTFB) under regular load is what you are interested in to understand how performance affects real users.

We don’t run the tests with very high concurrency because we want to make sure the numbers reflect PHP performance, not the operating system’s process scheduler, thus no CPU contention is happening.

Performance Benchmark Report Q2 2025 for Shopware 6

How does your Shopware 6 store’s PHP backend performance compare to other operators of Shopware in general?

To answer this question, we have aggregated and anonymized performance data from over 200 Shopware 6 stores over the last quarter and computed benchmark numbers to compare to for the most important page types: Product details, Category, Search, and Homepage.

Executive Summary

  • For the Shopware 6 operators in the Top 10% and 25%, the numbers show what is possible if you operate with a focus on backend performance. The top 10% of shops perform in the range of 270 ms on average and 400 ms in the 95% percentile.
  • Comparing with the previous Q1 benchmark, we see the numbers in the top 10% improving for product and category pages. For search, performance degrades by 20%–40% in all cohorts.
  • The slowest 25% of shops have their pages perform around 1 second on average, and closer to 2 seconds for the 95%. This will affect the Largest Contentful Paint (LCP) scoring negatively.
  • The fastest and slowest 10% are 6–26 times apart, showing that there is tremendous potential in analyzing and optimizing PHP backend performance with tools like Tideways.

Benchmark of average response times

Page10% Best25% BestMedian25% Worst10% Worst
Product Details271 ms415 ms607 ms895 ms1599 ms
Category Page271 ms479 ms799 ms1215 ms1791 ms
Search303 ms639 ms991 ms1407 ms2943 ms
Homepage51 ms135 ms319 ms607 ms1343 ms

Benchmark of 95% percentile response times

Page10% Best25% BestMedian25% Worst10% Worst
Product Details431 ms671 ms991 ms1599 ms2815 ms
Category Page479 ms927 ms1535 ms2431 ms3583 ms
Search575 ms1023 ms1471 ms2175 ms5375 ms
Homepage99 ms271 ms575 ms1215 ms1983 ms

Methodology

The data foundation for this is daily average and 95% response times of PHP requests in Shopware 6 shops that have an active Tideways subscription or trial during the first quarter of 2025 and reported data to our backend. This is measured through the Tideways PHP extension, tapping into the PHP runtime.

From a Core Web Vitals perspective, this is an approximate benchmark for the Time to First Byte (TTFB) of all requests in the shop that are served by the PHP backend. Requests served cached from Varnish, Fastly or other HTTP cache in front of the shop are not included.

A shop must have had at least 5,000 storefront requests that day processed by PHP in the backend and 250 requests of the page type to be included. Only shops using the default controllers for the product details, category list, search, cart, and homepage page types are considered. This leads to 74,607 data points included in the report, over 67,711 from the last report.

Take these numbers with a grain of salt because they intentionally include Shopware users across all major PHP and Shopware versions, with Elasticsearch or MySQL-based search, with Shopware’s HTTP Cache enabled or using external HTTP caches (Varnish) and across all industries and customer personas.

See where your store ranks

To see where your Shopware 6 store is ranking, sign up to a free trial with Tideways and collect backend performance data. Tideways can recommend performance optimizations and provides effortless insights into all code-level performance problems.

PHP Benchmarks: 8.4 performance is steady compared to 8.3 and 8.2

Every year, like clockwork, a new version of PHP is released at the end of November.

Naturally, you want to know, how much performance gain is in this new release across common frameworks and applications?

Our tests show that, in general, the performance between 8.2, 8.3 and 8.4 does not move much for a Laravel, Symfony and WordPress demo application.

Upgrading to the latest PHP version is not a magic pill to improve performance.

Not all is gloomy though, in our PHP 8.4 Performance, Operations and Debugging post you find a few specific ideas how you can use new features to improve your performance, for example sprintf compile time optimizations, SHA-NI or Lazy Objects. However, these will only be useful when using the respective functionality and might require some work on your part to integrate.

The biggest lever for performance is the application architecture and the code you write. If you want to find out where to start optimizing your application code, Tideways, our production-ready profiling and monitoring, can help you detect areas for improvement.

To benchmark PHP, we have set up these popular PHP projects:

  • Symfony with PHP 8.4, 8.3, and 8.2
  • WordPress with PHP 8.4, 8.3, 8.2, and 7.4
  • Laravel with PHP 8.4, 8.3, 8.2

Our intention is to give you a rough idea of how much performance is improved as a percentage by just updating the PHP version.

WordPress supports many PHP versions in parallel, so we use it as a good yardstick for performance changes from PHP 7 to 8.4.

Setup

The benchmarking is done under these conditions:

  • Code and Infrastructure Provisioning: github.com/tideways/php-benchmarks
  • Machine: Hetzner CCX 31 (8 dedicated vCores on EPYC 7003 or EPYC 9004)
  • OS: Debian 12 („Bookworm“)
  • Database:
    • MySQL 8.4.4 for WordPress and Laravel
    • SQLite 3 for Symfony
  • PHP (all built by deb.sury.org): 7.4.33, 8.2.28, 8.3.20, 8.4.6
    • JIT not enabled
    • FPM with static pool and 17 workers.
  • Projects: Laravel 12.3.0, Symfony 7.1.1, WordPress 6.7.2
  • Vegeta v12.12.0
  • HAProxy 3.0.9

You can find more on methodology after the results.

Results

Symfony

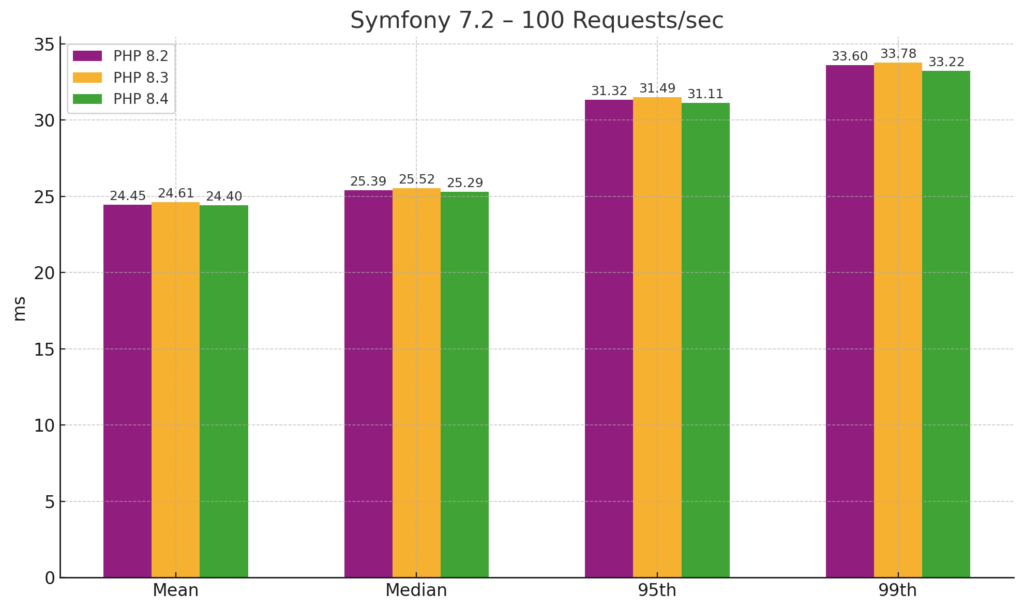
Upgrading just PHP 8.3 to 8.4 makes the Symfony demo application run with the same performance when simulating a fixed number of 100 requests/minute. Fluctuations are within the margin of error.

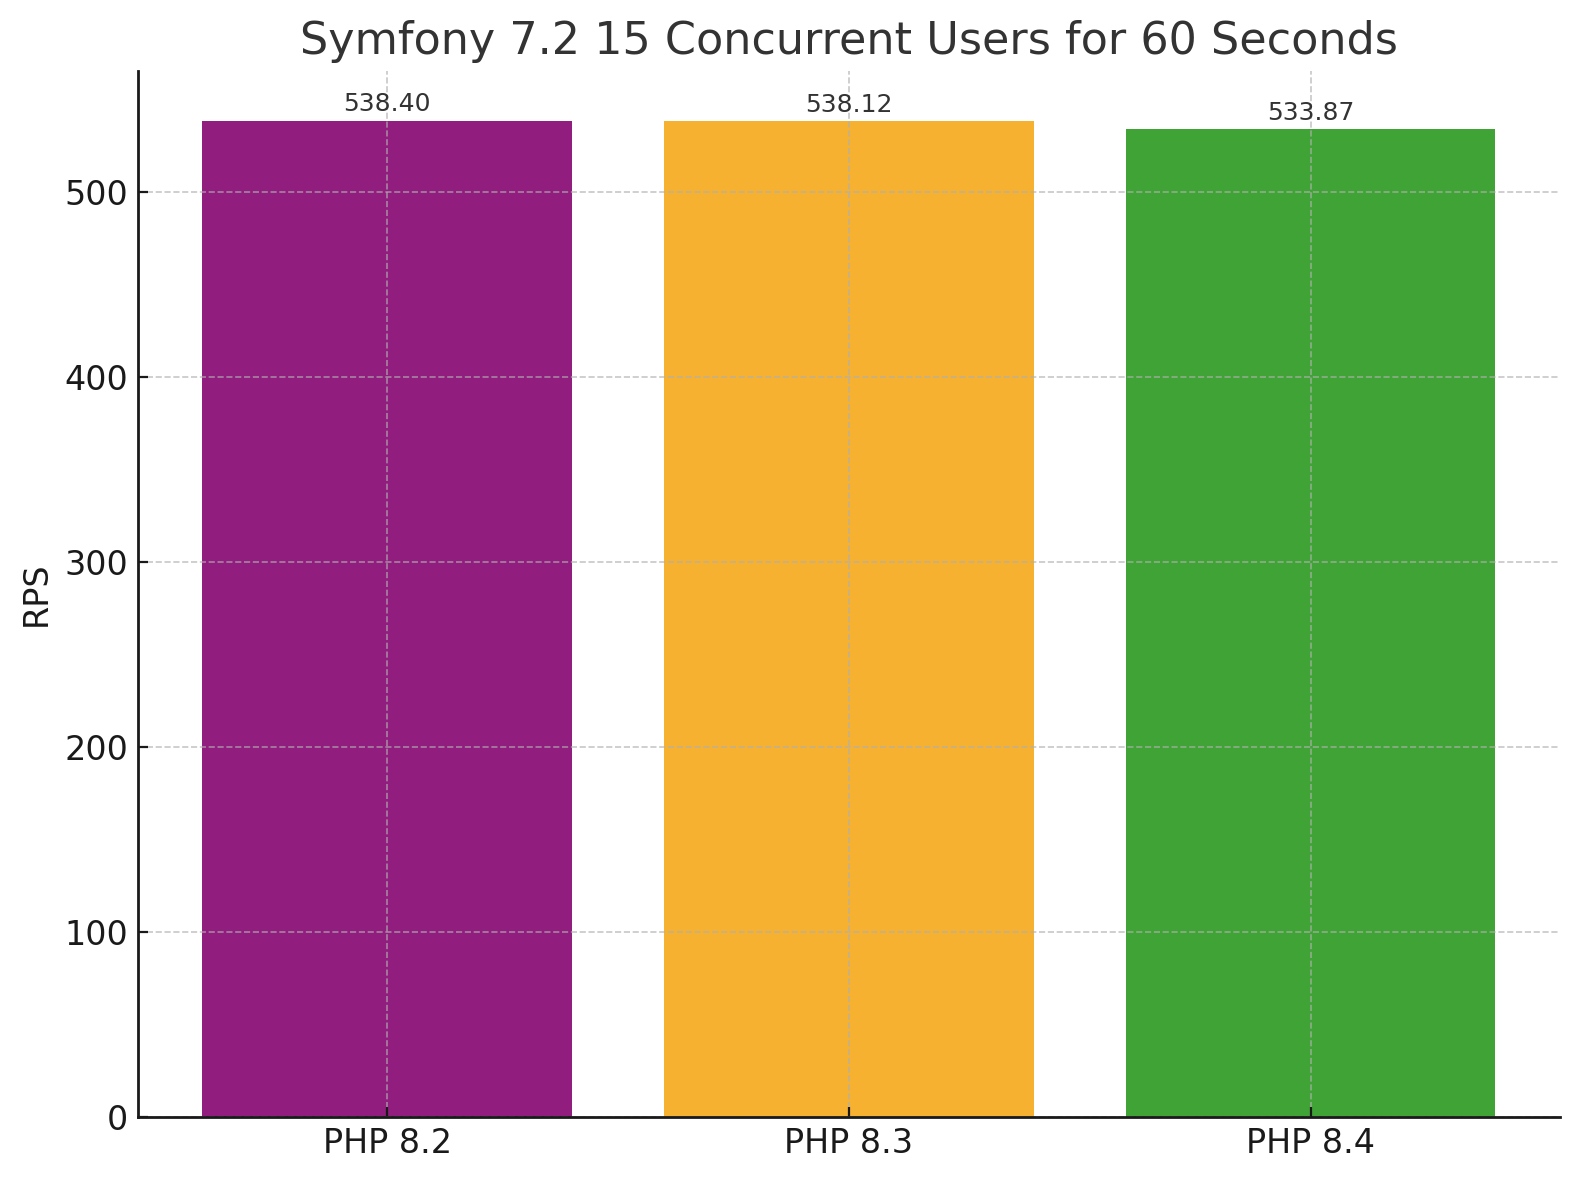
When run with 15 concurrent requests, the requests/seconds also do not vary significantly between PHP versions:

Laravel

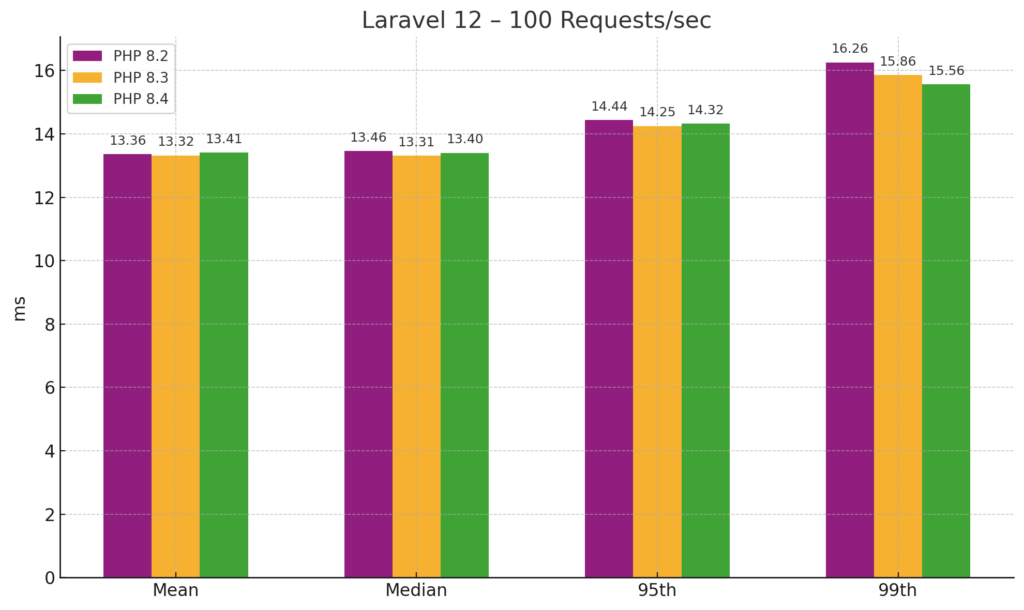
Upgrading just PHP 8.3 to 8.4 shows no visible difference to response times of the Laravel demo application, except for a small improvement in the 99th percentile.

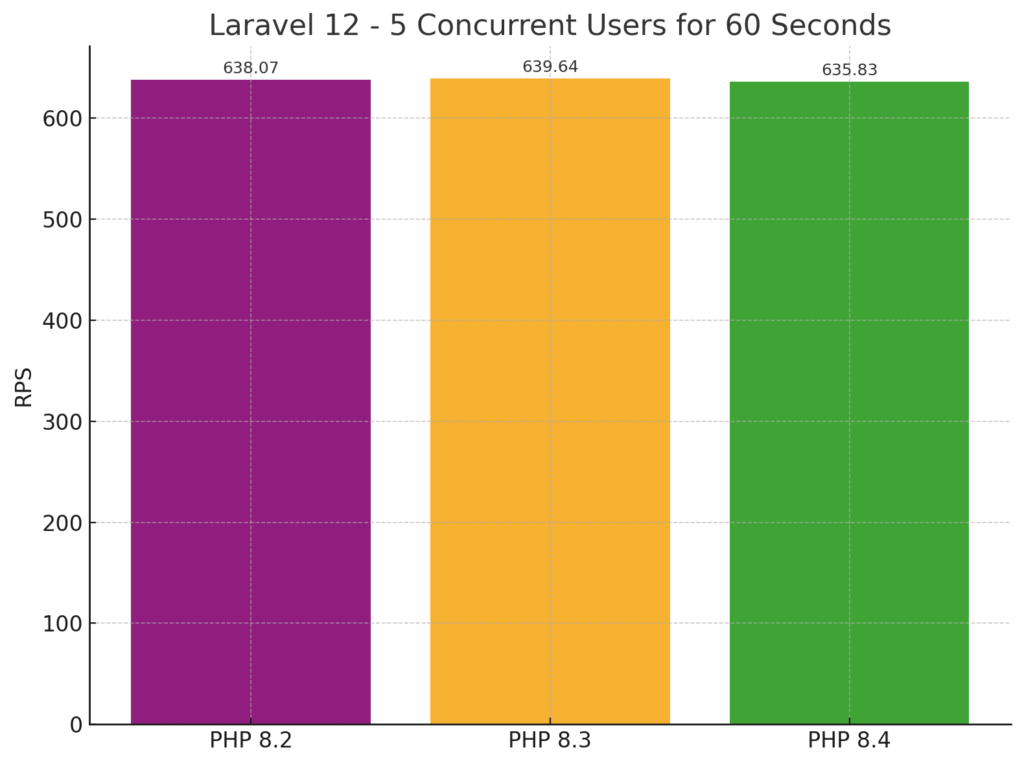
And the requests/seconds are close to each other as well.

In contrast to both Symfony and WordPress, we used our results for 5 concurrent users here and not 15, because for Laravel in particular the application was constrained by CPU scheduling with 15 concurrent users on just 8 cores and we didn’t want this effect to muddy the results.

WordPress

Similar with WordPress, upgrading from PHP 8.3 to 8.4 shows no significant change in response times. The comparison to PHP 7.4 does show that PHP 8 overall became slightly faster, though.

And again the requests/seconds are close to each other, with only PHP 7.4 showing a ~5% lower number.

❗With Tideways PHP Profiler, you can find bottlenecks in your application code by continuously profiling the production environment at low overhead. Get your free 14 -day trial to start optimizing.

More Notes on Methodology

With benchmarking, the results heavily rely on the assumptions and setup. There are a few changes we have made to other popular PHP benchmarks, and we want to discuss our methodology here.

We run the benchmarks in two modes:

  • With fixed requests per second, with a focus on response times
  • With a fixed level of concurrency, with a focus on requests per second.

Why do we not only report performance in requests per second? Other benchmarks often compare if a new PHP version can serve more requests per second. They do this by running as many requests as possible with a fixed number of concurrent threads that create new requests.

This provides synthetic or artificial comparisons because for real-world scenarios you would never run your PHP application at the limit of capacity and getting as many requests out as possible.

Instead, response time or time-to-first-byte (TTFB) under regular load is what you are interested in to understand how performance affects real users.

We don’t run the tests with very high concurrency because we want to make sure the numbers reflect PHP performance, not the operating system’s process scheduler, thus no CPU contention is happening.

Performance Benchmark Report Q1 2025 for Shopware 6

How does your Shopware 6 store’s PHP backend performance compare to other operators of Shopware in general?

To answer this question, we have aggregated and anonymized performance data from over 150 Shopware 6 stores over the last quarter and computed benchmark numbers to compare to for the most important page types: Product details, Category, Search, and Homepage.

Executive Summary

  • For the Shopware 6 operators in the Top 10% and 25%, the numbers show what is possible if you operate with a focus on backend performance. The top 10% of shops perform in the range of 300 ms on average and 500 ms in the 95% percentile.
  • The slowest 25% of shops have their pages perform significantly above 1 second, which will certainly affect the Largest Contentful Paint (LCP) scoring, that turns from Good to “Needs Improvement” at 2.5 seconds.
  • The fastest and slowest 10% are 5–10 times apart, showing that there is tremendous potential in analyzing and optimizing PHP backend performance with tools like Tideways.

Benchmark of average response times

Page10% Best25% BestMedian25% Worst10% Worst
Product Details303 ms399 ms607 ms895 ms1599 ms
Category Page287 ms463 ms767 ms1215 ms1855 ms
Search303 ms607 ms927 ms1407 ms2943 ms
Homepage51 ms127 ms303 ms575 ms1343 ms

Benchmark of 95% percentile response times

Page10% Best25% BestMedian25% Worst10% Worst
Product Details447 ms639 ms1023 ms1599 ms2815 ms
Category Page463 ms927 ms1471 ms2431 ms3711 ms
Search399 ms799 ms1407 ms2303 ms4351 ms
Homepage91 ms239 ms495 ms1087 ms2047 ms

Outlook

Going forward, we plan to update these numbers regularly and hopefully get a good data basis that allows us to spot and discuss trends. By continuously measuring them from now, in the next round we expect there will be another +50% shops included and giving better data.

Methodology

The data foundation for this is daily average and 95% response times of PHP requests in Shopware 6 shops that have an active Tideways subscription or trial during the first quarter of 2025 and reported data to our backend. This is measured through the Tideways PHP extension, tapping into the PHP runtime.

From a Core Web Vitals perspective, this is an approximate benchmark for the Time to First Byte (TTFB) of all requests in the shop that are served by the PHP backend. Requests served cached from Varnish, Fastly or other HTTP cache in front of the shop are not included.

A shop must have had at least 5,000 storefront requests that day processed by PHP in the backend and 250 requests of the page type to be included. Only shops using the default controllers for the product details, category list, search, cart, and homepage page types are considered. This leads to 67,711 data points included in the report.

Take these numbers with a grain of salt because they intentionally include Shopware users across all major PHP and Shopware versions, with Elasticsearch or MySQL-based search, with Shopware’s HTTP Cache enabled or using external HTTP caches (Varnish) and across all industries and customer personas.

See where your store ranks

To see where your Shopware 6 store is ranking, sign up to a free trial with Tideways and collect backend performance data. Tideways can recommend performance optimizations and provides effortless insights into all code-level performance problems.

Black Friday Performance of Magento, Oxid, Shopware shops 2016/2017

With all the customers running Tideways on their Magento, Oxid or Shopware shops I was interested in how in the aggregated average, those shops usually perform on Black Friday compared to the 8 weeks before and the weeks after leading up to Christmas.

A lot of e-commerce shops have either large Black Friday, Cyber Monday or week long christmas campaigns, which can increase the traffic to the shops significantly. Both with and without caching a lot of this traffic will directly slow down PHP application servers because of the additional requests that compete for the same amount of Server, CPU & Memory resources.

To quantify this effect across all our customers we looked at the aggregated, anonymized historical data of all our customers with either a Magento, Oxid or Shopware shop for the years 2016 and 2017. We only looked at shops that had at least 100.000 requests on Black Friday and at least 14 days of data reported before and after that date. The sample size of this study is 168.

What change in requests can you expect on Black Friday?

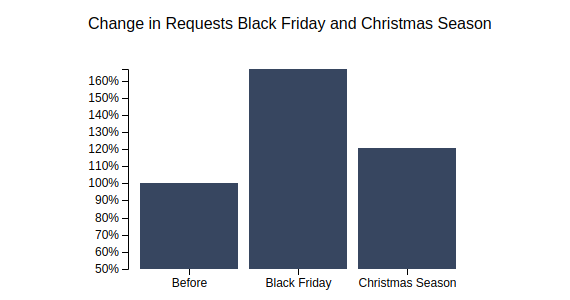
On average across all 168 applications we saw an increase in the number of PHP backend requests (behind any potential caches) of 66% on Black Friday. The maximum increase was 874%.

30 of the 168 shops did not run specific Black Friday campaigns as their requests were equal or lower than each day before. Shops without Black Friday campaigns seem to have a dip in requests and then recover immediately in the time afterwards. Another interpretation that we cannot see from our data is that their shops were not available 100% on Black Friday due to too much traffic.

In the days after Black Friday the increase in PHP requests compared to October and November still amounted to 20% on average across all 168 shops with the highest increase being 287%.

How does increased BlackFriday traffic affect performance?

From the Tideways perspective the changes in requests are not the most interesting part that we can study from our historical data, but we are interested in subsequent performance changes.

Of our 168 applications we found that 49 were optimized by their operators in the time before Black Friday or received additional computing resources (we can’t see that from our data), leading to a better performance on Black Friday and afterwards.

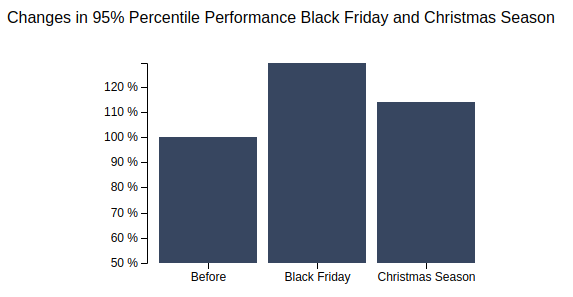
If we look at all the shops that haven’t optimized their performance or scaled computing resources before Black Friday sufficiently, then we can see that their 95% percentile performance increases by around 29% on average. The shops that got hit hardest were bogged down by 95% percentile increases of 500% and more, sometimes leading to response times way above 10 seconds.

Even if your shop uses caching for most of your frontend, getting hit by these performance increases means that the basket and checkout process is much slower than usually and can lead to aborted carts and customer that leave your shop because of slowness.

The relationship of slow performance with increased page abandonment has been studied by Google, Amazon and many other major e-commerce players. They leave no doubt that it is important to get in front of your shop performance when planning small and large Black Friday, Cyber Monday and Christmas campaigns.

And if you know that your shop can’t handle a large increase in traffic, then maybe optimize your campaigns to be smaller and more spread across christmas season.

Ready for Black Friday with insights from Tideways Profiler

If you run a Magento, Spryker, Oxid, Shopware or any other PHP based webshop, then Tideways can help you find out about the endpoints with the highest impact on performance, bottlenecks, slow SQL queries and help you find optimizations to get ready for Black Friday and Christmas season.

This includes the personalized Black Friday preparation report that we will sent you in the aftermath of Christmas 2018 and again next year in August.