Posts

Fine-Tune Your OPcache Configuration to Avoid Caching Surprises

Learn more about one of the most important levers for optimal PHP performance. OPcache provides support for byte-code caching of PHP scripts. For a dynamic language such as PHP, a byte-code cache can increase the performance significantly because it guarantees a script is compiled only once. OPcache has been bundled with PHP as a loadable extension since PHP 5.5. Starting with PHP 8.5 OPcache is an integral part of PHP and always installed, but not necessarily always enabled.

Normally PHP executes scripts in two steps:

  1. PHP source code is compiled into bytecode
  2. The PHP virtual machine executes that bytecode

OPcache stores compiled bytecode in shared memory so that subsequent requests can skip the compilation step entirely.

The default settings of the OPcache extension already boost PHP performance by a large amount, but you can tune the configuration settings to get even more out of it.

The Three Most Important OPcache Configuration Options

In practice, most performance improvements from OPcache come from configuring three settings correctly:

  • opcache.memory_consumption
  • opcache.interned_strings_buffer
  • opcache.max_accelerated_files

If these are configured properly, you usually achieve around 95% of the possible OPcache performance gains.

A word of caution: This post repeatedly mentions monitoring stats with opcache_get_status(false). Because OPcache uses a unique pool of shared memory for every SAPI, you cannot access the webserver’s statistics from the console. The call has to be made through Apache or PHP-FPM.

Avoid Destructive Caching Behavior When Memory is Too Small

OPcache uses 128 MB of RAM to save the compiled PHP scripts by default and up to 16,229 PHP scripts. This sounds more than enough to store your PHP application scripts, but there are caveats:

  • If your application uses code generation or a PHP file-based cache such as Symfony, Magento or Shopware, then there might be a large amount of scripts that are not part of your source control.
  • If you do validate timestamps and your code changes in production, then the old cache entries are marked as “waste”. This waste adds to the memory consumption of OPcache.
  • If you use the “new checkout for every release” deployment strategy, then OPcache might cache the same script multiple times in different filesystem locations. This can crowd out the available memory fast.

When OPcache is “full”, under some circumstances it will wipe all cache entries and start over from an empty cache. When this happens and your server gets large amounts of traffic, this can cause a thundering herd problem or cache slam: lots of requests simultaneously generating the same cache entries.

You absolutely want to avoid OPcache to restart with an empty cache.

The algorithm that detects whether OPcache is “full” depends on an interaction between three different INI settings, which is not intuitive and currently not documented. It helped to dig through the C code to understand it.

The three relevant INI variables are defined as follows:

  • opcache.memory_consumption defaults to 128 MB for caching all compiled scripts.
  • opcache.max_accelerated_files defaults to 10,000 cacheable files, but there is a calculation in place that always picks the next specific higher number in a list of possible values. While this is documented, it is counterintuitive. The maximum is 1,000,000.
  • opcache.max_wasted_percentage is the percentage of wasted space in OPcache that is necessary to trigger a restart (default 5).

OPcache works on a first-come, first-serve basis for the cache and does not use an eviction strategy such as Least Recently Used (LRU).

Whenever maximum memory consumption or maximum accelerated files is reached, OPcache attempts to restart the cache. However, if the wasted memory inside OPcache does not exceed the max_wasted_percentage, OPcache will not restart, and every uncached script will be recompiled every request as if there was no OPcache extension available.

This means you absolutely want to avoid OPcache being full.

To find the right configuration, you should monitor the output of opcache_get_status(false) which you can use to check for the memory, waste and number of used cache keys:

  • If cache_full is true and a restart is neither pending nor in progress, that probably means that the waste is not high enough to exceed the max waste percentage. You can check by comparing current_wasted_percentage with the INI variable opcache.max_wasted_percentage. In this case also the cache hit rate opcache_hit_rate will drop below 99%, where ideally it gets as closely as possible to 100%. Solution: Increase the opcache.memory_consumption setting.
  • If cache_full is true and num_cached_keys equals max_cached_keys then you have too many files. When there is not enough waste, no restart will be triggered. As a result, there are scripts that don’t get cached, even though there might be memory available. Solution: Increase the opcache.max_accelerated_files setting.
  • If your cache is never full, but you are still seeing a lot of restarts, that can happen when you have too much waste or configured the max waste percentage too low. Solution: Increase the opcache.max_waste_percentage setting.

To look for inefficient restart behavior, you can evaluate the oom_restarts (related to the opcache.memory_consumption setting) and hash_restarts (related to opcache.max_accelerated_files). Make sure to check when the last restart happened with last_restart_time statistic.

To find a good value for opcache.max_accelerated_files you can use this Bash one-liner to get the number of PHP files in your project:

$ find project/ -type f -iname "*.php" | wc -l
    45311

Make sure to account for code-generated, Composer vendor and cache files or multiple applications running inside the same FPM worker pool.

Increase Interned Strings Buffer

When parsing PHP files that contain hardcoded strings, OPcache converts them to interned strings in memory. Meaning that a string "foo" in the code used at different locations and executed in different requests at the same time all point to a single place in memory. This reduces the memory overhead of PHP massively. However, the interned strings buffer is only 8 MB large by default. For applications using frameworks, it makes sense to increase this significantly to 32 MB or 64 MB:

opcache.interned_strings_buffer=64

Interned strings include many elements of PHP code, such as class names, function names, constants, or string literals. Reusing these across requests can significantly reduce memory allocations during execution.

Note that the interned strings buffer is allocated from the total OPcache memory pool. If you increase this value significantly, you also need to increaseopcache.memory_consumption. These two variables are linked.

You can find information on this in the Tideways app and get recommendations on if you should change variables or if you are fine as it is.

Avoid Unnecessary Filesystem Calls by Disabling Timestamp Validation

With the default settings, whenever a PHP file is executed (for example, through include or require) OPcache checks the last time it was modified on disk. Then it compares this time with the last time it cached the compilation of that script. When the file was modified after being cached, the compile cache for the script will be regenerated.

This validation is not necessary in production when you know the files never change. To disable timestamp validation, add the following line to your php.ini:

opcache.validate_timestamps=0

Disabling timestamp validation also avoids filesystem stat calls during script execution. In practice this can improve performance by roughly 1–3%, depending on the type of application.

With this configuration, you have to make sure that during a deployment, all the caches get invalidated. There are several ways to ensure this happens:

  • Restart PHP FPM or Apache – The sledgehammer method of invalidating files in OPcache has the downside that it might lead to aborted requests and a very small amount of time when requests get lost.
  • Calling opcache_reset(), which is tricky because it has to be called in a script executed by Apache or PHP-FPM to affect the webserver’s OPcache. You can add a special endpoint to your application and secure it using a secret hash.
  • Changing the document root and reloading the Nginx webserver configuration. Nginx completes all the currently running requests and starts new workers in parallel that serve requests with the new configuration.
  • For Apache, Rasmus has a blog post detailing their approach at Etsy.

Be careful with the last two approaches because using them results in making the available OPcache memory “full” very fast. See the previous section for more information on how memory configuration works.

For both cases you might need a maintenance script that calls opcache_invalidate($file, true) on all scripts in old deployments or opcache_reset() directly. Otherwise, old deployments crowd out the cache for new ones, and you might end up with a full cache and an unaccelerated application.

Advanced OPcache Optimizations

OPcache Preloading

We have a separate article on OPcache Preloading. There is also a video on the topic on our YouTube channel.

OPcache on the Commandline

By default, OPcache is disabled for CLI scripts, the since the INI setting is opcache.enable_cli=0 by default.

This is intentional because each CLI invocation runs in its own process and cannot share cached bytecode. In fact each of them need to allocate the memory for OPcache over and over again.

Enabling OPcache can be beneficial for long-running CLI workers, as enabling OPcache will also enable the bytecode Optimizer that can make the the script run faster.

However, this requires additional memory, and if you’re running a lot of workers or cron jobs in parallel, you get closer to the maximum memory of the server.

Therefore, often it does not make sense to enable OPcache for the CLI.

OPcache File Cache

OPcache can also store compiled bytecode on disk using the file cache feature.

This can help reduce cold start times in environments where PHP processes start frequently. This makes sense for use-cases like PHP on AWS Lambda using Bref.

You can enable the file cache with the following INI setting:

opcache.file_cache=/path/to/cache/

Now, PHP 8.5 introduced the setting:

opcache.file_cache_read_only=1

which allows using the OPcache file cache on read-only file systems, making it easier to use in container images.

Configuring OPcache in FPM Pool file does not work

A common configuration mistake occurs when OPcache memory settings are configured inside PHP-FPM pool configuration:

php_admin_value[opcache.memory_consumption]=256

This does not work as expected.

OPcache memory is allocated when PHP starts, before PHP-FPM pool configuration is applied.

As a result, phpinfo() may show the changed value while the actual allocated memory still uses the default.

Always configure OPcache memory settings in:

php.ini

Starting with PHP 8.5, PHP will emit a warning in such situations, making this issue easier to detect.

Joining The Threads Together

Everything together gives you the following php.ini settings file:

opcache.memory_consumption=256
opcache.interned_strings_buffer=64
opcache.max_accelerated_files=100000
opcache.validate_timestamps=0

; for cases with cold start or containers
opcache.file_cache=/path/to/cache/

Conclusion

Even though OPcache already provides a significant boost in PHP performance, you can still improve on it. This blog post expands on the information available in the PHP documentation on opcache_get_status and the opcache configuration.

By tuning the most important configuration settings and monitoring OPcache statistics, you can ensure that scripts are consistently served from cache and avoid unexpected performance issues.

We tried backslashing all the functions

When applications need to transfer cryptographic identifiers into other systems, for example within JSON, they often need to encode them into a safe format. This can however leak information about the secret, unless the encoding is done with a “constant time” algorithm, such as implemented by the paragonie/constant_time_encoding library.

Constant time algorithms are generally slower than the equivalent non-constant time algorithm due to the additional work that needs to be done. Nevertheless we should strive to make them as fast as possible as long as security is maintained.

This blog post discusses the pull request that makes the encoding algorithm quite a bit faster by relying on a simple PHP OPcache optimization.

Pure PHP vs Native Libsodium Implementation

The library is implemented in pure PHP for maximum compatibility across a wide range of web hosting services and PHP versions, which might not necessarily have all optional PHP extensions available. In version 3.1.0, the maintainers, however added optional support for the “sodium” extension, which includes constant time implementations for common encodings. This optional support is implemented by checking for the availability of the sodium extension whenever the encoding function is called and then either using the functions from sodium or the pure PHP implementation.

   // https://github.com/paragonie/constant_time_encoding/blob/master/src/Hex.php
    public static function encode(
        #[\SensitiveParameter]
        string $binString
    ): string {
        if (extension_loaded('sodium')) {
            try {
                return sodium_bin2hex($binString);
            } catch (SodiumException $ex) {
                throw new RangeException($ex->getMessage(), $ex->getCode(), $ex);
            }
        }
        $hex = '';
        $len = Binary::safeStrlen($binString);
        for ($i = 0; $i < $len; ++$i) {
            /** @var array $chunk */
            $chunk = \unpack('C', $binString[$i]);
            $c = $chunk[1] & 0xf;
            $b = $chunk[1] >> 4;

            $hex .= \pack(
                'CC',
                (87 + $b + ((($b - 10) >> 8) & ~38)),
                (87 + $c + ((($c - 10) >> 8) & ~38))
            );
        }
        return $hex;
    }

For a simple test script:


require('vendor/autoload.php');

$secret = random_bytes(16);
$length = 0;
for ($i = 0; $i < 1000000; $i++) {
        $length += strlen(\ParagonIE\ConstantTime\Hex::encode($secret));
}
var_dump($length);

This provided for an impressive 14× improvement in performance with libsodium vs the pure PHP variant:

Benchmark 1: php -d opcache.enable_cli=1 constant_time_encoding_pure_php/test.php
  Time (mean ± σ):      2.012 s ±  0.010 s    [User: 1.993 s, System: 0.018 s]
  Range (min … max):    2.000 s …  2.033 s    10 runs
 
Benchmark 2: php -d opcache.enable_cli=1 constant_time_encoding_sodium/test.php
  Time (mean ± σ):     143.5 ms ±   6.1 ms    [User: 125.6 ms, System: 17.4 ms]
  Range (min … max):   134.5 ms … 158.3 ms    21 runs
 
Summary
  php -d opcache.enable_cli=1 constant_time_encoding_sodium/test.php ran
   14.02 ± 0.60 times faster than php -d opcache.enable_cli=1 constant_time_encoding_pure_php/test.php

Adding Backslashes to All Function Calls

An astute observer might have noticed that some of the functions in the above snippet from the library have a leading backslash, whereas some do not. Adding the backslash is commonly done in security-sensitive code to make sure that a malicious library is not able to “sneak in” fake implementations into the namespace of the security-sensitive library. We should therefore add a leading backslash to the extension_loaded() and sodium_bin2hex() calls as well to make sure we are actually using the Sodium extension and nothing else. We will take a closer look at the following change which is an excerpt from our PR #64.

diff --git a/src/Hex.php b/src/Hex.php
index d4d5259..50f77d1 100644
--- a/src/Hex.php
+++ b/src/Hex.php
@@ -48,9 +48,9 @@ abstract class Hex implements EncoderInterface
         #[\SensitiveParameter]
         string $binString
     ): string {
-        if (extension_loaded('sodium')) {
+        if (\extension_loaded('sodium')) {
             try {
-                return sodium_bin2hex($binString);
+                return \sodium_bin2hex($binString);
             } catch (SodiumException $ex) {
                 throw new RangeException($ex->getMessage(), $ex->getCode(), $ex);
             }

It turns out this also further improves performance to 18× the baseline (1.3× the original sodium implementation):

Benchmark 1: php -d opcache.enable_cli=1 constant_time_encoding_pure_php/test.php
  Time (mean ± σ):      2.130 s ±  0.112 s    [User: 2.115 s, System: 0.014 s]
  Range (min … max):    1.998 s …  2.350 s    10 runs
 
Benchmark 2: php -d opcache.enable_cli=1 constant_time_encoding_sodium/test.php
  Time (mean ± σ):     149.8 ms ±   3.7 ms    [User: 131.4 ms, System: 18.1 ms]
  Range (min … max):   142.9 ms … 157.5 ms    20 runs
 
Benchmark 3: php -d opcache.enable_cli=1 constant_time_encoding_sodium_backslashes/test.php
  Time (mean ± σ):     115.6 ms ±   4.8 ms    [User: 97.5 ms, System: 17.8 ms]
  Range (min … max):   108.2 ms … 129.7 ms    25 runs
 
Summary
  php -d opcache.enable_cli=1 constant_time_encoding_sodium_backslashes/test.php ran
    1.30 ± 0.06 times faster than php -d opcache.enable_cli=1 constant_time_encoding_sodium/test.php
   18.43 ± 1.23 times faster than php -d opcache.enable_cli=1 constant_time_encoding_pure_php/test.php

How the code is optimized by PHP

There are two reasons why this code is much faster:

  1. Without the backslash, PHP will first need to check whether there’s a sodium_bin2hex() in the current namespace before falling back to the global function. This fallback is cached per call and thus only happens once, though.
  2. We wrote about “compiler optimized functions” before, which OPcache evaluates at compile-time. \extension_loaded() is among these functions.

This means that OPcache will replace the extension_loaded() check by just true :

 // Optimization after 1 Iteration
    public static function encode(
        #[\SensitiveParameter]
        string $binString
    ): string {
        if (true) {
            try {
                return \sodium_bin2hex($binString);
            } catch (SodiumException $ex) {
                throw new RangeException($ex->getMessage(), $ex->getCode(), $ex);
            }
        }
        $hex = '';
        $len = Binary::safeStrlen($binString);
        for ($i = 0; $i < $len; ++$i) {
            /** @var array $chunk */
            $chunk = \unpack('C', $binString[$i]);
            $c = $chunk[1] & 0xf;
            $b = $chunk[1] >> 4;

            $hex .= \pack(
                'CC',
                (87 + $b + ((($b - 10) >> 8) & ~38)),
                (87 + $c + ((($c - 10) >> 8) & ~38))
            );
        }
        return $hex;
    }

It will then notice that the if() is useless and remove it:

// Optimization after 2 Iterations
    public static function encode(
        #[\SensitiveParameter]
        string $binString
    ): string {
        try {
            return \sodium_bin2hex($binString);
        } catch (SodiumException $ex) {
            throw new RangeException($ex->getMessage(), $ex->getCode(), $ex);
        }
        $hex = '';
        $len = Binary::safeStrlen($binString);
        for ($i = 0; $i < $len; ++$i) {
            /** @var array $chunk */
            $chunk = \unpack('C', $binString[$i]);
            $c = $chunk[1] & 0xf;
            $b = $chunk[1] >> 4;

            $hex .= \pack(
                'CC',
                (87 + $b + ((($b - 10) >> 8) & ~38)),
                (87 + $c + ((($c - 10) >> 8) & ~38))
            );
        }
        return $hex;
    }

And then the entire code after the try-catch becomes unreachable, since either a return statement will be hit or an Exception will be thrown:

 // Optimization after 3 Iterations
    public static function encode(
        #[\SensitiveParameter]
        string $binString
    ): string {
        try {
            return \sodium_bin2hex($binString);
        } catch (SodiumException $ex) {
            throw new RangeException($ex->getMessage(), $ex->getCode(), $ex);
        }
    }

In the end, the entire pure-PHP implementation is gone and the check whether or not to use it is as well. Instead the Hex::encode() method has become a thin wrapper around \sodium_bin2hex(). This is also visible in the resulting OPcodes.

Before:

ParagonIE\ConstantTime\Hex::encode:
     ; (lines=61, args=1, vars=8, tmps=3)
     ; (after optimizer)
     ; constant_time_encoding_sodium/src/Hex.php:47-73
0000 CV0($binString) = RECV 1
0001 INIT_NS_FCALL_BY_NAME 1 string("ParagonIE\\ConstantTime\\extension_loaded")
0002 SEND_VAL_EX string("sodium") 1
0003 V8 = DO_FCALL_BY_NAME
0004 JMPZ V8 0021
0005 INIT_NS_FCALL_BY_NAME 1 string("ParagonIE\\ConstantTime\\sodium_bin2hex")
0006 SEND_VAR_EX CV0($binString) 1
0007 V8 = DO_FCALL_BY_NAME
0008 VERIFY_RETURN_TYPE V8
0009 RETURN V8
0010 CV1($ex) = CATCH string("SodiumException")
0011 V8 = NEW 3 string("RangeException")
0012 INIT_METHOD_CALL 0 CV1($ex) string("getMessage")
0013 V9 = DO_FCALL
0014 SEND_VAR_NO_REF_EX V9 1
0015 INIT_METHOD_CALL 0 CV1($ex) string("getCode")
0016 V9 = DO_FCALL
0017 SEND_VAR_NO_REF_EX V9 2
0018 SEND_VAR_EX CV1($ex) 3
0019 DO_FCALL
0020 THROW V8
0021 ASSIGN CV2($hex) string("")
0022 INIT_STATIC_METHOD_CALL 1 string("ParagonIE\\ConstantTime\\Binary") string("safeStrlen")
0023 SEND_VAR_EX CV0($binString) 1
0024 V8 = DO_FCALL
0025 ASSIGN CV3($len) V8
0026 ASSIGN CV4($i) int(0)
0027 JMP 0057
0028 INIT_FCALL 2 112 string("unpack")
0029 SEND_VAL string("C") 1
0030 T8 = FETCH_DIM_R CV0($binString) CV4($i)
0031 SEND_VAL T8 2
0032 V8 = DO_ICALL
0033 ASSIGN CV5($chunk) V8
0034 T9 = FETCH_DIM_R CV5($chunk) int(1)
0035 T8 = BW_AND T9 int(15)
0036 ASSIGN CV6($c) T8
0037 T9 = FETCH_DIM_R CV5($chunk) int(1)
0038 T8 = SR T9 int(4)
0039 ASSIGN CV7($b) T8
0040 INIT_FCALL 3 128 string("pack")
0041 SEND_VAL string("CC") 1
0042 T9 = ADD int(87) CV7($b)
0043 T10 = SUB CV7($b) int(10)
0044 T8 = SR T10 int(8)
0045 T10 = BW_AND T8 int(-39)
0046 T8 = ADD T9 T10
0047 SEND_VAL T8 2
0048 T9 = ADD int(87) CV6($c)
0049 T10 = SUB CV6($c) int(10)
0050 T8 = SR T10 int(8)
0051 T10 = BW_AND T8 int(-39)
0052 T8 = ADD T9 T10
0053 SEND_VAL T8 3
0054 V8 = DO_ICALL
0055 ASSIGN_OP (CONCAT) CV2($hex) V8
0056 PRE_INC CV4($i)
0057 T8 = IS_SMALLER CV4($i) CV3($len)
0058 JMPNZ T8 0028
0059 VERIFY_RETURN_TYPE CV2($hex)
0060 RETURN CV2($hex)
LIVE RANGES:
     8: 0008 - 0009 (tmp/var)
     8: 0012 - 0020 (new)
     9: 0043 - 0046 (tmp/var)
     9: 0049 - 0052 (tmp/var)
EXCEPTION TABLE:
     0005, 0010, -, -

After:

ParagonIE\ConstantTime\Hex::encode:
     ; (lines=17, args=1, vars=2, tmps=2)
     ; (after optimizer)
     ; constant_time_encoding_sodium_backslashes/src/Hex.php:47-73
0000 CV0($binString) = RECV 1
0001 INIT_FCALL 1 96 string("sodium_bin2hex")
0002 SEND_VAR CV0($binString) 1
0003 V2 = DO_ICALL
0004 VERIFY_RETURN_TYPE V2
0005 RETURN V2
0006 CV1($ex) = CATCH string("SodiumException")
0007 V2 = NEW 3 string("RangeException")
0008 INIT_METHOD_CALL 0 CV1($ex) string("getMessage")
0009 V3 = DO_FCALL
0010 SEND_VAR_NO_REF_EX V3 1
0011 INIT_METHOD_CALL 0 CV1($ex) string("getCode")
0012 V3 = DO_FCALL
0013 SEND_VAR_NO_REF_EX V3 2
0014 SEND_VAR_EX CV1($ex) 3
0015 DO_FCALL
0016 THROW V2
LIVE RANGES:
     2: 0004 - 0005 (tmp/var)
     2: 0008 - 0016 (new)
EXCEPTION TABLE:
     0001, 0006, -, -

After all the optimizations—both the Sodium support added by the maintainer and the backslashes added by the featured PR #64—, the hexadecimal encoder now only has a roughly 2.1× overhead over the non-constant-time bin2hex() when the Sodium extension is installed. This makes it feasible to err on the side of caution and use the constant time encoder as the default choice, falling back to the insecure alternatives only when best performance is required for a confirmed non-security-sensitive use case.

Benchmark 1: php -d opcache.enable_cli=1 constant_time_encoding_pure_php/test.php
  Time (mean ± σ):      2.010 s ±  0.009 s    [User: 1.993 s, System: 0.016 s]
  Range (min … max):    1.995 s …  2.025 s    10 runs
 
Benchmark 2: php -d opcache.enable_cli=1 constant_time_encoding_sodium/test.php
  Time (mean ± σ):     143.5 ms ±   6.8 ms    [User: 126.6 ms, System: 16.7 ms]
  Range (min … max):   133.4 ms … 159.4 ms    20 runs
 
Benchmark 3: php -d opcache.enable_cli=1 constant_time_encoding_sodium_backslashes/test.php
  Time (mean ± σ):     107.8 ms ±   3.4 ms    [User: 90.5 ms, System: 17.0 ms]
  Range (min … max):   102.6 ms … 115.3 ms    28 runs
 
Benchmark 4: php -d opcache.enable_cli=1 bin2hex/test.php
  Time (mean ± σ):      52.0 ms ±   3.4 ms    [User: 38.1 ms, System: 13.6 ms]
  Range (min … max):    46.6 ms …  63.9 ms    60 runs
 
Summary
  php -d opcache.enable_cli=1 bin2hex/test.php ran
    2.07 ± 0.15 times faster than php -d opcache.enable_cli=1 constant_time_encoding_sodium_backslashes/test.php
    2.76 ± 0.22 times faster than php -d opcache.enable_cli=1 constant_time_encoding_sodium/test.php
   38.62 ± 2.53 times faster than php -d opcache.enable_cli=1 constant_time_encoding_pure_php/test.php

The same optimization is applicable not just to functions, but also to constants. If the constant is provided by an extension and the name is fully-qualified, this allows OPcache to insert the constant’s value at compile time, which then might allow to fully evaluate individual expressions. A PHP version-compatibility check using if (\PHP_VERSION_ID < 80500) { /* … */ } would be an example. The compatibility code within the if() will only exist for PHP versions below PHP 8.5, and the if() will be fully removed at runtime when upgrading to PHP 8.5.

Time to get started with Profiling! With our free trial.

PHP 8.5 Garbage Collection Improvements

Big optimizations in PHP’s memory consumption have become exceedingly rare. Since then, memory improvements have been smaller in scope, focusing on little details for certain types of variables.

Like improving the Garbage Collector (GC) in edge cases, which Iljia Tovilo contributed to PHP 8.5 titled “Mark enums and static fake closures as not collectable”.

In short, this means that for these two variable types, the cycle collector will not attempt to “collect” them, preventing unnecessary runs if lots of those instances are in use.

This does not come with any downsides, as these types cannot be cyclic and are therefore not subject to the GC anyway.

Quick Detour: How does PHP’s Garbage Collector work?

To understand why this is useful, we should remind ourselves quickly how garbage collection in PHP operates. For more details, you can take a look at our blog post and podcast episode on the topic.

In short, PHP’s GC does not run continuously but is triggered by a threshold. The threshold being that there are currently at least 10,000 possibly cyclic objects or arrays in memory. If the number of these instances increases without the possibility to clean up, the GC might be running over increasingly large numbers of objects, consuming valuable computational resources.

As a result, reducing the number of objects eligible for garbage collection reduces the chance of GC runs and therefore improves performance.

One neat function, added in PHP 7.3, was not mentioned in our blog post. With gc_status() (Docs) it is quite easy to gain insights into garbage collection performance.

What do we actually gain?

Looking at the example from the pull request, we can see that plenty of instances of first class callables are added to and iterated over afterward.


function foo() {}

$array = [];
for ($i = 0; $i < 10_000_000; $i++) {
    $array[] = foo(...);
}

//
// The loop is needed to make sure that the cycle collector is triggered:
// - `as $foo` increases the refcount of the array elements 
// - which is decreased again after the variable runs out of scope
//
foreach ($array as $foo) {}

echo json_encode(gc_status(), JSON_PRETTY_PRINT);

With older PHP versions, this will trigger the cycle collector to check all of those instances for cyclic references. Since these instances cannot have cyclic references, these checks are unnecessary. With 10 million entries, this resulted in 44 runs, while anything from PHP 8.5 onwards has 0 runs with the same code.

Definition: “static fake closures”

The pull request’s title states that the optimization applies to “enums and static fake closures”. Since static fake closures are definitely the more relevant case and the terminology does not match userland namings, let’s dive into this: what are “static fake closures”?

The example (see last chapter) does use “static fake closures”, which are commonly called “first-class callables” in userland. In this example, this means foo(...).

To determine if a callable is a “fake closure”, you can run a check if the anonymous flag returns false on the callable’s reflection class, i.e., (new \\ReflectionFunction($callable))->isAnonymous();.

The “static” part of the type refers to what we understand in OOP as static: not having access to an object instance (i.e., $this).

In this list of different closures, you can see which ones are considered static fake closures by the PR and which are not:


class Foo 
{
    public static function bar(): void {}
    public function baz(): void {}    
}

function bar(): void {}

//
// static fake closures
//
var_dump(...);
bar(...);
Foo::bar(...);
$callable = Closure::fromCallable('bar');
$callable(...);

// fake closure, but non-static
(new Foo())->baz(...);
// anonymous function, no fake closure
$anon = static function () {};
$anon(...);

The Enum Case

The second type that was optimized are instances of Enum. This will most likely have relatively minimal effects in real projects, as this would only impact performance if a codebase contains many Enums with many cases. Enum instances are singletons, so each Enum’s case is instantiated exactly once. This would not have any effect if there are thousands of references to the same three or four enum cases, since each enum case can only appears once in the GC’s root buffer.

Conclusion

Tiny wins like these show that PHP’s memory management can still be improved while already being quite mature.

This change might improve performance in some cases, but most importantly, it makes sure that garbage collection runs do not waste time on irrelevant checks.

Thanks for the contribution, Iljia Tovilo.

Time to get started with Profiling! With our free trial.

PHP Benchmarks: 8.5 vs 8.4, 8.3 and 7.4

Each year, right on schedule, a new version of PHP is released at the end of November.

So, how much faster is this new release across popular frameworks and applications?

Our tests show that, in general, the performance between 8.2, 8.3, 8.4 and 8.5 does not move much for a Laravel, Symfony and WordPress demo application.

Moving to the newest PHP version isn’t a magic shortcut to better performance.

Not everything is bleak, though. In our post on PHP 8.5 Performance, Operations, and Debugging, we highlight several concrete ways to leverage new features to boost performance.

Keep in mind, however, that these improvements are only relevant if you use the corresponding functionality and may require some effort to integrate.

The most significant factor for performance is your application architecture and the code you write. To identify where to begin optimizing your application, Tideways—our production-ready profiling and monitoring tool—can help pinpoint areas for improvement.

To benchmark PHP, we have set up these popular PHP projects:

  • Symfony with PHP 8.5, 8.4, 8.3, and 8.2
  • WordPress with PHP 8.5, 8.4, 8.3, and 7.4
  • Laravel with PHP 8.5, 8.4, 8.3, 8.2

Our intention is to give you a rough idea of how much performance is improved as a percentage by just updating the PHP version.

WordPress supports many PHP versions in parallel, so we use it as a good yardstick for performance changes from PHP 7 to 8.5.

Setup

The benchmarking is done under these conditions:

  • Code and Infrastructure Provisioning: github.com/tideways/php-benchmarks
  • Machine: Hetzner CCX 33 (8 dedicated vCores on AMD)
  • OS: Debian 13 („Trixie“)
  • Database:
    • MySQL 8.4.7 for WordPress and Laravel
    • SQLite 3 for Symfony
  • PHP (all built by deb.sury.org): 7.4.33, 8.2.29, 8.3.27, 8.4.14, 8.5.0 RC 3
    • JIT not enabled
    • FPM with static pool and 17 workers.
  • Projects: Laravel 12.37.0, Symfony 7.3.6, WordPress 6.8.3
  • Vegeta v12.12.0
  • HAProxy 3.0.11

You can find more on methodology after the results.

Results

Symfony

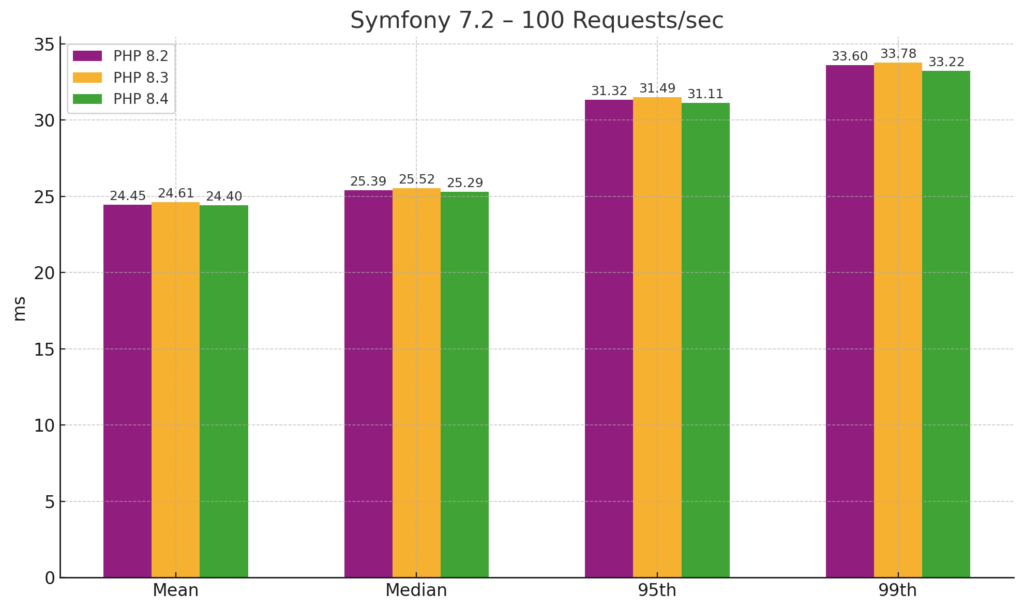
Upgrading just PHP 8.4 to 8.5 makes the Symfony demo application run with almost the same performance when simulating a fixed number of 100 requests/minute. Fluctuations are within the margin of error.

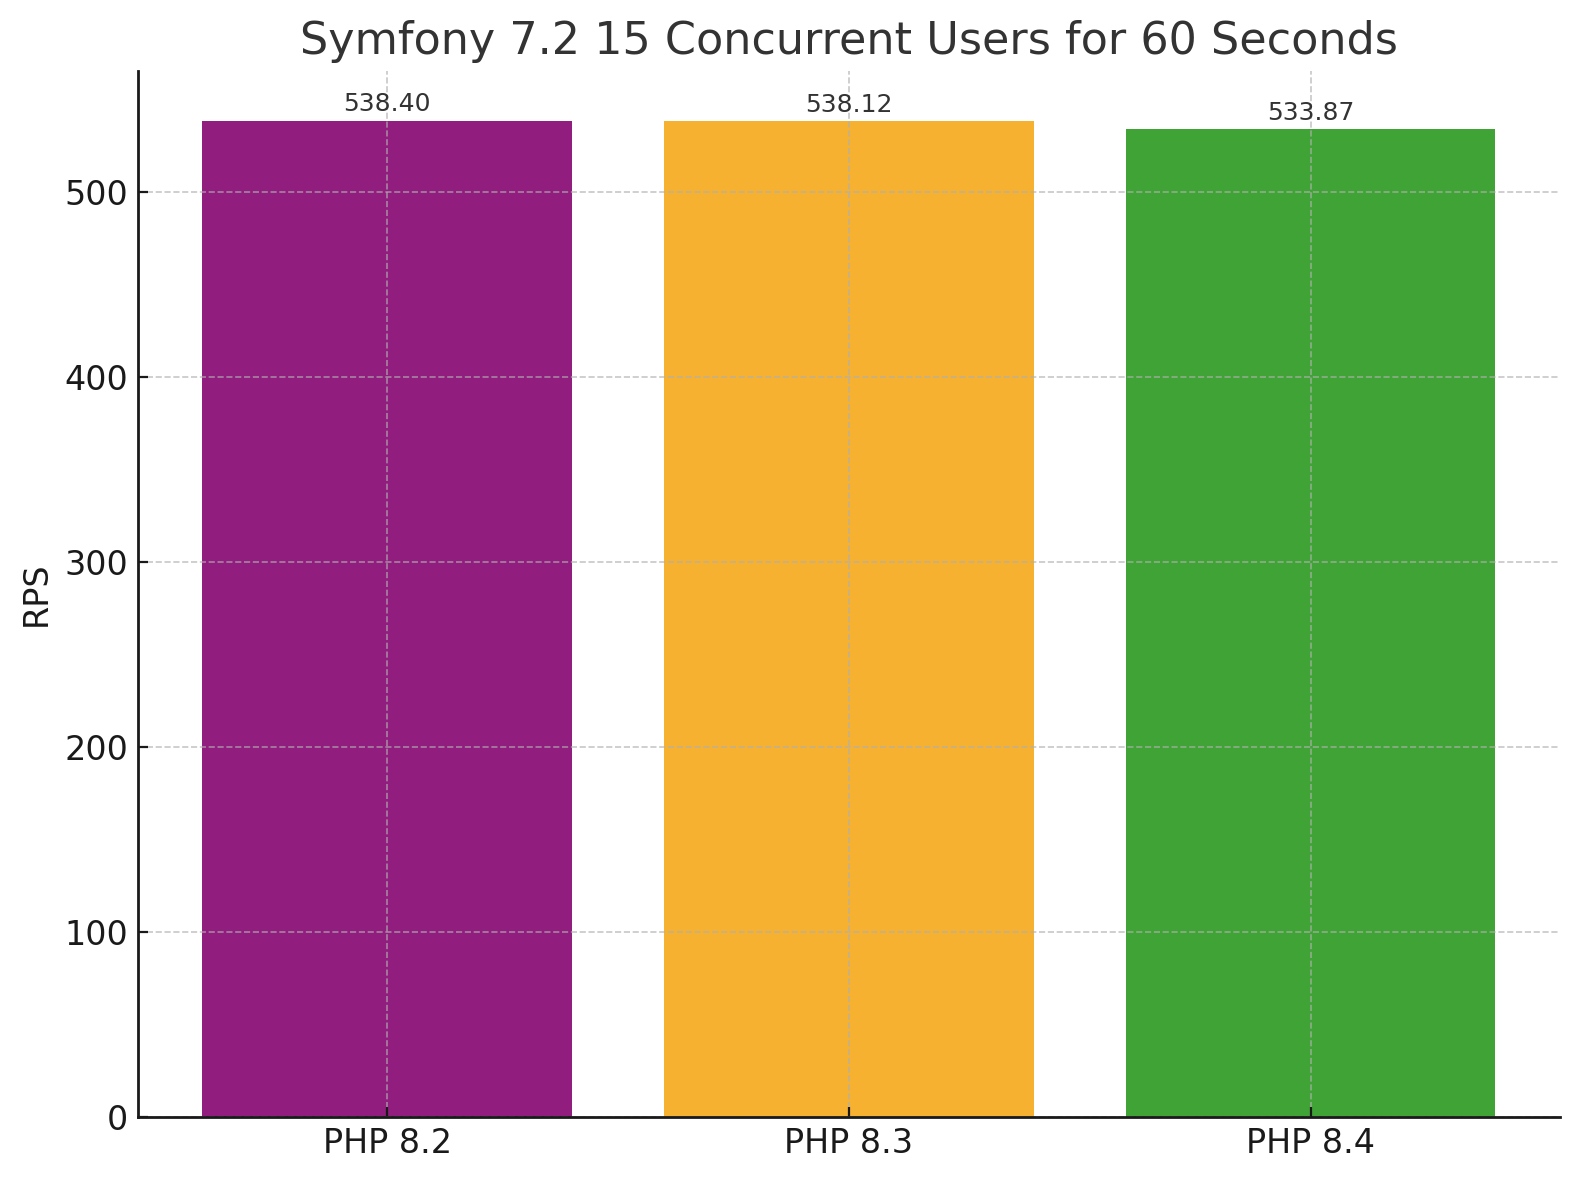
When run with 15 concurrent requests, the requests/seconds also do not vary significantly between PHP versions:

Laravel

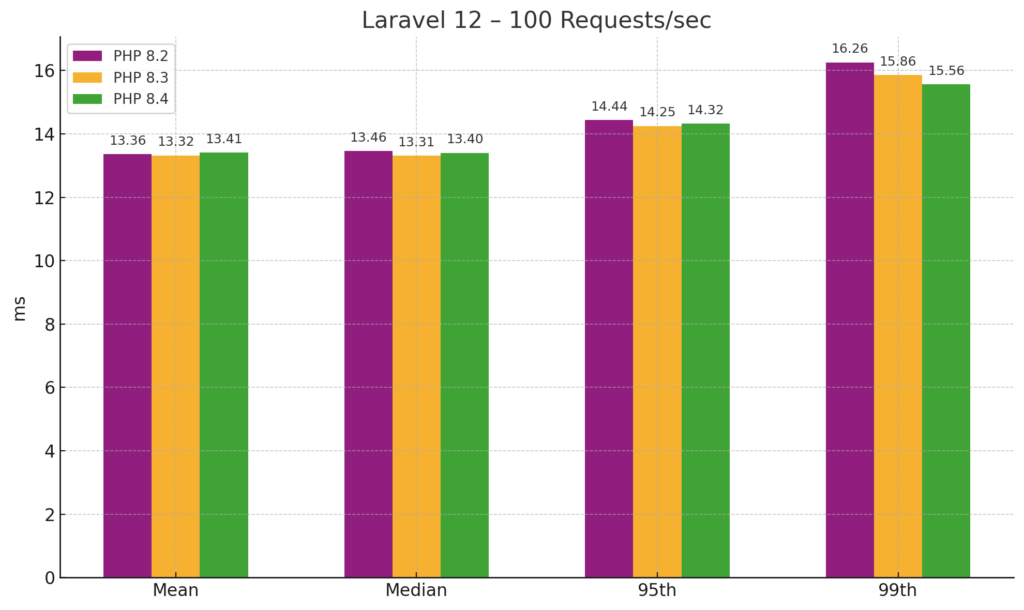
Upgrading just PHP 8.4 to 8.5 shows no visible difference to response times of the Laravel demo application.

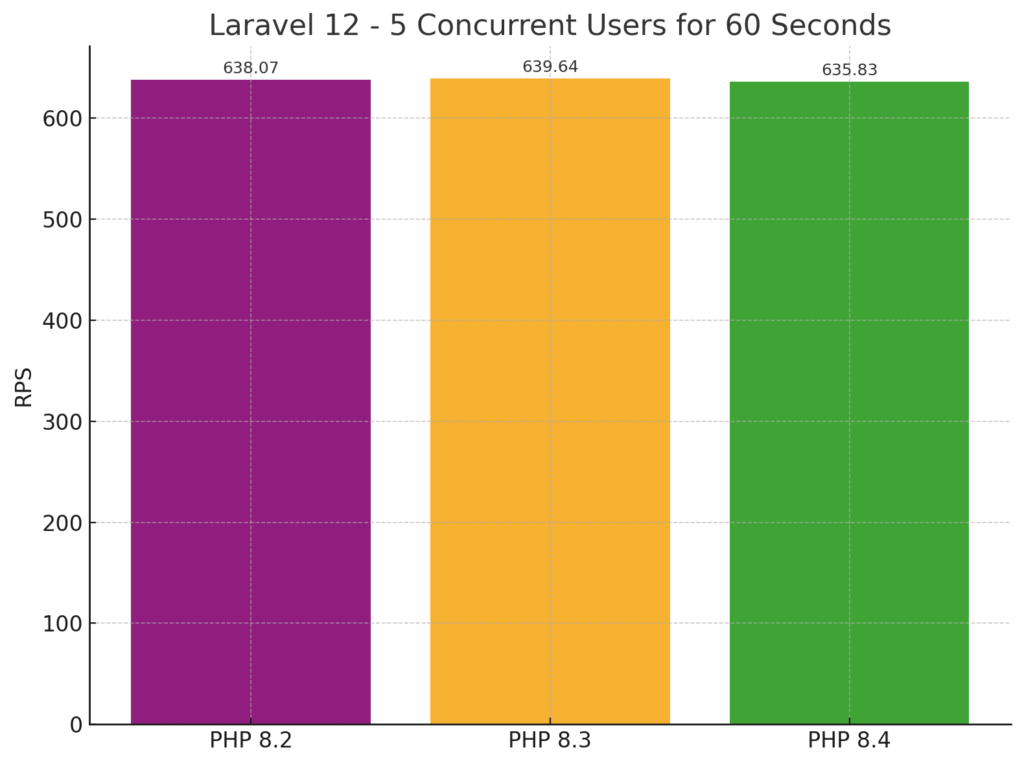
And the requests/seconds are close to each other as well.

WordPress

Similar with WordPress, upgrading from PHP 8.4 to 8.5 shows no significant change in response times.

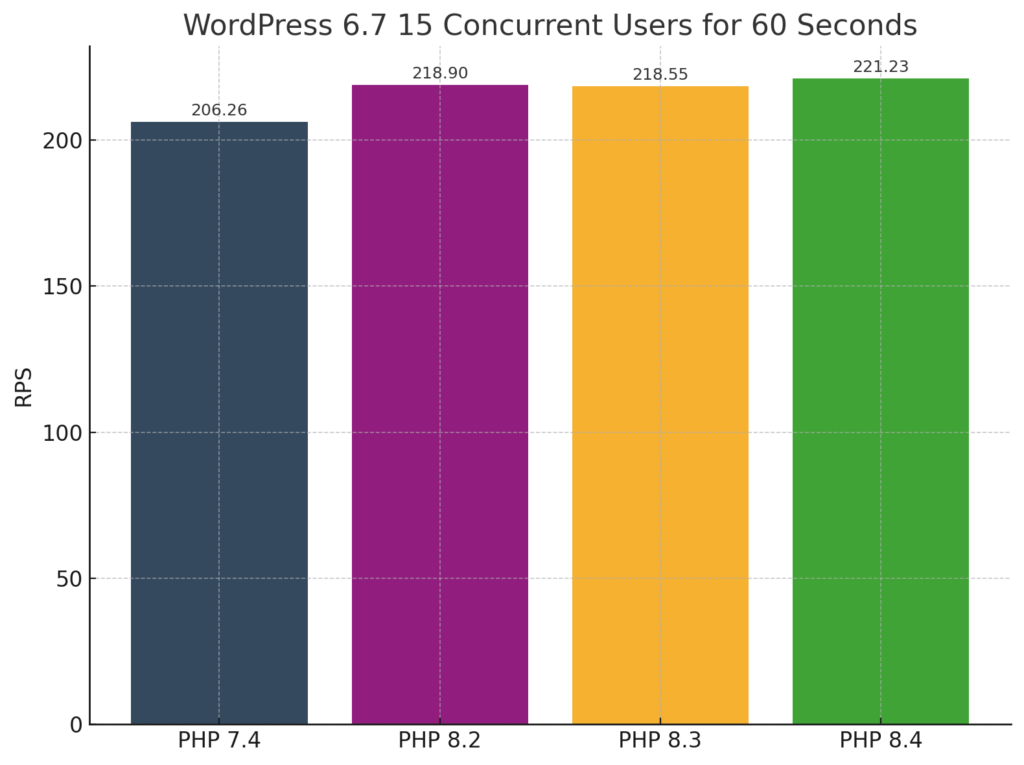
And the requests/seconds for 15 concurrent users are close to each other, with only PHP 7.4 showing a ~5% lower number.

❗With Tideways PHP Profiler, you can find bottlenecks in your application code by continuously profiling the production environment at low overhead. Get your free 14 -day trial to start optimizing.

More Notes on Methodology

With benchmarking, the results heavily rely on the assumptions and setup. There are a few changes we have made to other popular PHP benchmarks, and we want to discuss our methodology here.

We run the benchmarks in two modes:

  • With fixed requests per second, with a focus on response times
  • With a fixed level of concurrency, with a focus on requests per second.

Why do we not only report performance in requests per second? Other benchmarks often compare if a new PHP version can serve more requests per second. They do this by running as many requests as possible with a fixed number of concurrent threads that create new requests.

This provides synthetic or artificial comparisons because for real-world scenarios you would never run your PHP application at the limit of capacity and getting as many requests out as possible.

Instead, response time or time-to-first-byte (TTFB) under regular load is what you are interested in to understand how performance affects real users.

We don’t run the tests with very high concurrency because we want to make sure the numbers reflect PHP performance, not the operating system’s process scheduler, thus no CPU contention is happening.

What’s new in PHP 8.5 in terms of performance, debugging and operations

The close of 2025 is near, and that also means a new version of PHP is about to be released: 8.5!

There has already been some discussion regarding the latest features and modifications affecting developers, for example on Laravel News, PHP.Watch or the Zend Blog.

In this post we are highlighting just the performance, debugging, and operations-related changes in PHP 8.5 that you will not find in the posts listed above.

Several of these changes were even contributed by Tideways employees.

Are you mostly curious whether PHP 8.5 outperforms earlier versions? Take a look at our benchmark.

Performance

OPCode specialization for === []

The PHP compiler can optimize opcodes to run more efficiently, and for 8.5, my colleague Tim added an optimization for the $array === [] check. Before, this way of testing for an empty array was the slowest when compared with !$array, count($array) === 0 or empty($array).

In PHP 8.5 this becomes the fastest way of testing for an empty array. Should you change all code now? No. But it shows that when you micro-optimize code, you might lose that benefit in a next PHP version when the engine evolves and an entirely different code path is faster now, and maybe it’s best to just write what you find most readable and bet on future engine improvements.

I made a video about this change a few months ago: Stop Micro-Optimizing Your PHP Code (Unless You Rely On This).

Optimize match (true)

Another compile time optimization that Tim made for 8.5 is to reduce the number of opcodes that are emitted when you have a match (true) statement.

For an artificial code example such as the following, this provided a 17% (+/- 6%) improvement:

<?php

function foo($text) {
    $result = match (true) {
        !!preg_match('/Welcome/', $text), !!preg_match('/Hello/', $text) => 'en',
        !!preg_match('/Bienvenue/', $text), !!preg_match('/Bonjour/', $text) => 'fr',
        default => 'other',
    };

    return $result;
}

$i = 1_000_000;
$text = 'Bienvenue chez nous';
while($i--) {
	foo($text);
}

Persistent cURL Handles for DNS, Connection, and SSL Handshake Reuse

PHP’s shared nothing architecture is very helpful in avoiding memory leaks and accidental data leaks between users. But it has its downsides when you are performing the same work in each request over and over again.

For example, DNS, Connection, and SSL handshake times in cURL HTTP requests.

With PHP 8.5, you can now cut this time down significantly by sharing the DNS, connection, and SSL handshake information between HTTP calls made from different PHP requests using a new function, curl_share_init_persistent.

When you run this piece of code multiple times in a web server with PHP 8.5, you see how the second call gets much faster and by how much looking at the cURL timers:

<?php

$sh = curl_share_init_persistent([CURL_LOCK_DATA_CONNECT, CURL_LOCK_DATA_SSL_SESSION, CURL_LOCK_DATA_DNS]);
$ch = curl_init("https://tideways.com");

curl_setopt($ch, CURLOPT_SSL_VERIFYPEER, true);
curl_setopt($ch, CURLOPT_RETURNTRANSFER, true);
curl_setopt($ch, CURLOPT_SHARE, $sh);

curl_exec($ch);

foreach (curl_getinfo($ch) as $k => $v) {
    if (str_ends_with($k, '_time')) {
        echo sprintf("%20s", $k) . "\t" . $v . PHP_EOL;
    }
}

This change was contributed by Eric Norris through the “Add persistent curl share handles” and “Persistent curl share handle improvement” RFCs.

I recorded a video on cURL share handles with a detailed example and numbers.

Improve Performance of Instantiating Exceptions and Errors

Generally, exceptions shouldn’t happen often in PHP applications, but there are cases where they are either by accident or fully on purpose. This got slightly faster with this PR by Niels Dossche. It moves some checks to debug builds of PHP and skips them in production builds.

Improved Function Performance

The following core functions got performance optimizations in PHP 8.5: array_find(), array_filter(), array_reduce(), usort() / uasort(), str_pad(), implode(), pack(), and ReflectionProperty::getValue() + variants.

Operations

OPcache is now a required Extension

With PHP 8.5, OPcache is now a required extension, automatically built into every PHP binary, thanks to this RFC by Tim, Arnaud, and Ilija. There is not an option to run PHP without it anymore or accidentally forgetting to install it, which was a common problem with Docker containers using the php Docker Official Image.

The goal here is to simplify maintenance and allow making use of the Optimizer part of OPcache in a simpler way and share/move code to the engine.

It’s still possible to disable OPcache through php.ini settings.

OPcache File Cache Read-Only Support

Before PHP 8.5, you could not use the file cache of OPcache in combination with a read-only filesystem. This made it impossible to benefit from the file cache in container setups where the deploy and run steps are separated. In these scenarios the cold startup time is something heavily optimized, for example on AWS Lambda when running bref.

This PR by Samuel added a new INI option opcache.file_cache_read_only. With this option set, OPcache does not invalidate files anymore and does not run code that would modify the filesystem.

The PR mentions it should be combined with the settings opcache.validate_timestamps=0, opcache.enable_file_override=1and opcache.file_cache_consistency_checks=0 for best results.

The PR also includes a firsthand experience from bref author Matthieu Napoli, who mentioned he saw a 100ms drop in cold startup times on AWS Lambda for a test application.

New max_memory_limit INI directive

Before PHP 8.5, you could essentially change the memory limit to unhealthy high numbers by calling ini_set("memory_limit") without guards. This can now be prevented by configuring the system INI setting max_memory_limit which defines the upper limit of how high the memory limit can be set at runtime. The change was contributed by Frederik Pytlick in this PR.

Add new PHP_BUILD_PROVIDER constant

Tim contributed another small change that can be very helpful to general application. It was already possible to compile PHP with the PHP_BUILD_PROVIDER environment flag to provide information on who was responsible for the build. This was shown in phpinfo() and php -v outputs. With a new PHP constant PHP_BUILD_PROVIDER you can now also access this information at runtime.

Various people also already worked this into upstream PHP builds of Homebrew, Debian, Docker, and Fedora.

Debugging

php --ini=diff

With a new option on the command line, you can now see a list of all INI variables that were changed from the default value. This will be very helpful for debugging and bug reporting your PHP installation.

Add runtime-enabled heap debugging capabilities

With this PR from Arnaud, PHP 8.5 gains memory debugging capabilities without having to compile it with specialized tools like ASAN/MSAN/Valgrind, which might be hard to come by in production. Our colleague Tim worked on this as well, as we have had this capability wish when debugging Tideways PHP extension on customer systems a few times.

By setting the environment variable ZEND_MM_DEBUG you can enable different memory debugging functionality.

Error Backtraces

Fatal Errors that are outputted from PHP now show the backtrace by default thanks to this RFC from Eric Norris. Previously a fatal error would only show the message.

New functions: get_exception_handler(), get_error_handler()

With this RFC from Arnaud, two new functions were added to PHP 8.5 that give access to a callable of the current exception or error handler through two new functions: get_exception_handler and get_error_handler.

Debugging a running PHP process by attaching GDB

We are noticing that some of our requests are starting to get slow and server load increases. Checking the process list of our server, for example with htop reveals that our FPM workers are taking up all of our CPU time.

Checking the health with our basic toolset of lsof to show open network connections and strace to show syscalls does not reveal any activity. This means that the workers are spending time processing data without any externally visible activity. This could be an infinite loop or just an inefficient algorithm.

Unfortunately, we were never able to reproduce the issue ourselves, so our regular PHP debugging toolkit in our development setup doesn’t work. How can we get additional information from these processes when we catch them red-handed?

Using a system-level debugger, specifically gdb, comes to the rescue. On common Linux distributions, it is available within the aptly named package gdb. We’re using Debian Trixie for this post but have made available instructions for other distributions at the bottom.

Let’s start by installing gdb:

apt install gdb

Besides gdb, we also need debug symbols for PHP. These debug symbols allow gdb to map the processor instructions back to the statements and variables in the C source code of PHP. Since we are using Debian Trixie’s native PHP 8.4 packages, these debug symbols are available with debuginfod, which we enable by setting an environment variable:

export DEBUGINFOD_URLS="https://debuginfod.debian.net"

Setup is now finished, and we can launch gdb using the gdb command. We need the PID of one of our stuck workers, 7154 in this case, and then use attach $pid (thus attach 7154) to attach to the worker. Note that the worker will be completely frozen while we look at it in gdb; thus, the request that is currently processed might run into timeouts depending on how long the worker is stopped with gdb. Use detach after extracting all the relevant information to let it continue running from where it stopped.

The bt command allows you to retrieve a C-level backtrace, which can already provide some insight.

# gdb
(gdb) attach 7154
Attaching to process 7154
Reading symbols from /usr/sbin/php-fpm8.4...

This GDB supports auto-downloading debuginfo from the following URLs:
  
Enable debuginfod for this session? (y or [n]) y
[…]
0x000055ae695bc9aa in execute_ex (ex=0x7f20d3414330) at ./Zend/zend_vm_execute.h:61167
warning: 61167	./Zend/zend_vm_execute.h: No such file or directory
(gdb) bt
#0  0x000055ae695bf264 in ZEND_ADD_SPEC_TMPVARCV_TMPVARCV_HANDLER () at ./Zend/zend_vm_execute.h:14023
#1  execute_ex (ex=0x60) at ./Zend/zend_vm_execute.h:60460
#2  0x000055ae695ba345 in zend_execute (op_array=op_array@entry=0x7f20d3467000, return_value=return_value@entry=0x0)
    at ./Zend/zend_vm_execute.h:64308
#3  0x000055ae69625814 in zend_execute_script (type=type@entry=8, retval=retval@entry=0x0, 
    file_handle=file_handle@entry=0x7fff00207980) at ./Zend/zend.c:1934
#4  0x000055ae694b8c50 in php_execute_script_ex (primary_file=, retval=retval@entry=0x0)
    at ./main/main.c:2575
#5  0x000055ae694b8edb in php_execute_script (primary_file=) at ./main/main.c:2615
#6  0x000055ae69337251 in main (argc=, argv=) at ./sapi/fpm/fpm/fpm_main.c:1932

We are stuck in ZEND_ADD_SPEC_TMPVARCV_TMPVARCV_HANDLER from zend_vm_execute.h, meaning we are adding two values in userland code, but additions can happen everywhere, which is not particularly useful to find out what is going wrong. It would be nice if we could find out which line of PHP code is currently being executed. Ideally with a full PHP-level stacktrace.

Turns out this is possible! PHP provides an official gdb script that provides helpful commands to retrieve information from PHP. It’s available as .gdbinit in the root of the php/php-src repository. We’ll need to make sure to select the right branch, PHP-8.4 in our case: https://github.com/php/php-src/blob/PHP-8.4/.gdbinit

After placing it somewhere convenient on the server, we load it into gdb using the source command:

(gdb) source /tmp/.gdbinit

Now the zbacktrace function will be available, which will output a stacktrace containing the names of the PHP functions rather than the C code executed internally.

(gdb) zbacktrace
[0x7f20d34143c0] FibonacciService->__invoke(3) /var/www/html/fibonacci.php:10 
[0x7f20d3414330] FibonacciService->__invoke(4) /var/www/html/fibonacci.php:9 
[0x7f20d34142a0] FibonacciService->__invoke(5) /var/www/html/fibonacci.php:9 
[0x7f20d3414210] FibonacciService->__invoke(6) /var/www/html/fibonacci.php:9 
[0x7f20d3414180] FibonacciService->__invoke(7) /var/www/html/fibonacci.php:9 
[0x7f20d34140f0] FibonacciService->__invoke(8) /var/www/html/fibonacci.php:9 
[0x7f20d3414060] FibonacciService->__invoke(9) /var/www/html/fibonacci.php:9 
[0x7f20d3413fd0] FibonacciService->__invoke(11) /var/www/html/fibonacci.php:10 
[0x7f20d3413f40] FibonacciService->__invoke(12) /var/www/html/fibonacci.php:9 
[0x7f20d3413eb0] FibonacciService->__invoke(14) /var/www/html/fibonacci.php:10 
[0x7f20d3413e20] FibonacciService->__invoke(15) /var/www/html/fibonacci.php:9 
[0x7f20d3413d90] FibonacciService->__invoke(16) /var/www/html/fibonacci.php:9 
[0x7f20d3413d00] FibonacciService->__invoke(18) /var/www/html/fibonacci.php:10 
[0x7f20d3413c70] FibonacciService->__invoke(20) /var/www/html/fibonacci.php:10 
[0x7f20d3413be0] FibonacciService->__invoke(21) /var/www/html/fibonacci.php:9 
[0x7f20d3413b50] FibonacciService->__invoke(22) /var/www/html/fibonacci.php:9 
[0x7f20d3413ac0] FibonacciService->__invoke(23) /var/www/html/fibonacci.php:9 
[0x7f20d3413a30] FibonacciService->__invoke(24) /var/www/html/fibonacci.php:9 
[0x7f20d34139a0] FibonacciService->__invoke(25) /var/www/html/fibonacci.php:9 
[0x7f20d3413910] FibonacciService->__invoke(26) /var/www/html/fibonacci.php:9 
[0x7f20d3413880] FibonacciService->__invoke(28) /var/www/html/fibonacci.php:10 
[0x7f20d34137f0] FibonacciService->__invoke(30) /var/www/html/fibonacci.php:10 
[0x7f20d3413760] FibonacciService->__invoke(31) /var/www/html/fibonacci.php:9 
[0x7f20d34136d0] FibonacciService->__invoke(33) /var/www/html/fibonacci.php:10 
[0x7f20d3413640] FibonacciService->__invoke(35) /var/www/html/fibonacci.php:10 
[0x7f20d34135b0] FibonacciService->__invoke(36) /var/www/html/fibonacci.php:9 
[0x7f20d3413520] FibonacciService->__invoke(37) /var/www/html/fibonacci.php:9 
[0x7f20d3413490] FibonacciService->__invoke(39) /var/www/html/fibonacci.php:10 
[0x7f20d3413400] FibonacciService->__invoke(40) /var/www/html/fibonacci.php:9 
[0x7f20d3413370] FibonacciService->__invoke(41) /var/www/html/fibonacci.php:9 
[0x7f20d34132e0] FibonacciService->__invoke(42) /var/www/html/fibonacci.php:9 
[0x7f20d3413250] FibonacciService->__invoke(43) /var/www/html/fibonacci.php:9 
[0x7f20d34131c0] FibonacciService->__invoke(44) /var/www/html/fibonacci.php:9 
[0x7f20d3413130] FibonacciService->__invoke(45) /var/www/html/fibonacci.php:9 
[0x7f20d3413020] (main) /var/www/html/fibonacci.php:26 

Oh, that is nice. Apparently we are stuck evaluating a deep tree of Fibonacci numbers. Let’s check what data they are working on. We can print all local variables (internally called “CV”) using the print_cvs command, which also was provided by the .gdbinit script. We’ll need to pass the ID of the stack frame we’re interested in, FibonacciService->__invoke(33) in this case:

(gdb) print_cvs 0x7f20d34136d0
Compiled variables count: 3

[0] '$n'
[0x7f20d3413720] long: 33
[1] '$n1'
[0x7f20d3413730] long: 2178309
[2] '$n2'
[0x7f20d3413740] UNDEF

$n is 33 (which makes sense). It already calculated $n1 which is 2178309, the 32nd Fibonacci number, $n2 (the 31st) is not yet available, which also makes sense, since the function would be finished already otherwise – except for the addition, which should be so fast that it is challenging to catch reliably.

Now we know why the worker is using so much CPU, but we still don’t know what data was included in the request (e.g., $_GET parameters) to reach this situation. This information is available from the superglobals. To access them, we first need to obtain a list of all global variables using the print_global_vars command:


(gdb) print_global_vars
Hash(6)[0x55ae697e3e90]: {
  [0] "_GET" => [0x7f20d3461200] (refcount=2) array: 
  [1] "_POST" => [0x7f20d3461220] (refcount=2) array: 
  [2] "_COOKIE" => [0x7f20d3461240] (refcount=2) array: 
  [3] "_FILES" => [0x7f20d3461260] (refcount=2) array: 
  [4] "n" => [0x7f20d3461280] indirect: [0x7f20d3413070] long: 45

  [5] "service" => [0x7f20d34612a0] indirect: [0x7f20d3413080] (refcount=35) object(FibonacciService) #1

}

Afterwards, we can print out an individual variable using the printzv command with the variable pointer as the parameter ($_GET in this case):


(gdb) printzv 0x7f20d3461200
[0x7f20d3461200] (refcount=2) array:     Hash(1)[0x7f20d345b000]: {
      [0] "n" => [0x7f20d345c180] (refcount=1) string: 45
}

Okay, our script was accessed with ?n=45 as the query string. Testing this in our development setup confirms it hangs, which means we can now start debugging and optimizing it!

Appendix

Debian Native Packages

The Debian Wiki explains how to get a backtrace. The easiest solution is by enabling debuginfod, as we have done above:

export DEBUGINFOD_URLS="<https://debuginfod.debian.net>"

Alternatively the main/debug APT archive needs to be enabled and the corresponding -dbgsym package for each PHP package needs to be installed. Most importantly the phpX.Y-cli-dbgsym or phpX.Y-fpm-dbgsym package is required, since it provides the debug symbols for the Zend Engine.

Debian with Sury’s PPA

The -dbgsym packages need to be installed as explained in the section for Debian Native Packages. No changes to the sources list are required, since the -dbgsym packages are part of the main archive.

Ubuntu Native Packages

On recent Ubuntu versions debuginfod is enabled by default and everything should work out of the box. In other cases, the Ubuntu Server documentation about debuginfod explains the setup.

Ubuntu with Sury’s PPA

The main/debug APT archive needs to be enabled by adding the main/debug component to your sources list of the PPA and -dbgsym packages need to be installed, as explained in the section for Debian Native Packages.

The Ubuntu Wiki on Debugging Program Crashes provides more detail.

RockyLinux Native Packages

debuginfod is enabled by default, but it appears to be unavailable in our test. Instead debuginfo packages can manually be installed via:

dnf debuginfo-install php-cli […]

AlmaLinux Native Packages

debuginfod does not appear to be set up. Debuginfo packages can be installed as explained in the section for RockyLinux Native packages.

Docker

No prebuilt debug symbols are available. Instead the Dockerfiles available in the docker-library/php GitHub repository need to be modified to remove the logic that strips the debug symbols and the Docker image needs to be rebuilt from the modified Dockerfile.

More details are available in docker-library/php#1538.

What’s next?

  1. Sign Up for our Newsletter if you don’t want to miss the next post on our blog.
  2. Start your 14 days free trial of Tideways for effortless performance insights into your PHP application.

Improve MySQL Database Performance with the InnoDB Buffer Pool configuration

The database is often the source of performance problems in PHP applications, but there are many different reasons why this is the case.

The most straightforward is that individual queries that the application issues are slow, due to their inefficient structure, by not using indexes or other coding mistakes.

But for MySQL databases, a common problem is also the misconfiguration of the server itself. And MySQL has a single setting that is overwhelmingly responsible for the performance, called InnoDB Buffer Pool Size.

The setting declares how much of the database tables and indexes can be cached in memory (RAM). MySQL performance experts recommend keeping all data and indexes in memory.

Because databases are usually growing over time, this setting is not a “once and forever” setting, but it should be re-evaluated from time to time.

So if you are experiencing slow database queries, before blaming the individual query, you should always keep in mind to check if the database is too big for the InnoDB Buffer Pool.

Because if the database is too big, then depending on the application usage patterns, InnoDB keeps changing what it stores in memory constantly, always purging data again from the cache, and re-loading it from disk at high expense when its needed again.

Determine current setting of InnoDB Buffer Pool

To find out what the current size of the InnoDB buffer pool is, you can issue the following queries against your MySQL database:

SELECT variable_value/1024/1024 as innodb_buffer_pool_size_mb
FROM performance_schema.global_variables
WHERE variable_name = 'innodb_buffer_pool_size';

SELECT @@innodb_buffer_pool_size / 1024 / 1024  as innodb_buffer_pool_size_mb;

+----------------------------+
| innodb_buffer_pool_size_mb |
+----------------------------+
|                          8 |
+----------------------------+

In this case its 8 MB of memory. An extremely low value! The default value according to the MySQL docs is 128MB, however different distribution packages might already change that to something different.

Determine InnoDB Buffer Pool Cache Hit Rate

There are several ways to determine the current buffer pool cache hit rate. On the internet you often find instructions run the following command, looking at a huge blog of text of unstructured data.


mysql> SHOW ENGINE INNODB STATUS\G

The output is rather large so that sometimes it makes sense to set the pager tool to less before:

mysql> pager less
PAGER set to 'less'

Search for the section “BUFFER POOL AND MEMORY” it will look like this:


BUFFER POOL AND MEMORY
----------------------
Total large memory allocated 0
Dictionary memory allocated 1852330
Buffer pool size   1048448
Buffer pool size, bytes 17177772032
Free buffers       8216
Database pages     1028928
Old database pages 379656
Modified db pages  14757
Pending reads      0
Pending writes: LRU 0, flush list 0, single page 0
Pages made young 867782, not young 1408418
0.07 youngs/s, 0.00 non-youngs/s
Pages read 885237, created 235215, written 33162859
0.00 reads/s, 0.00 creates/s, 46.88 writes/s
Buffer pool hit rate 1000 / 1000, young-making rate 0 / 1000 not 0 / 1000
Pages read ahead 0.00/s, evicted without access 0.00/s, Random read ahead 0.00/s
LRU len: 1028928, unzip_LRU len: 0
I/O sum[19968]:cur[0], unzip sum[0]:cur[0]

You find the note “Buffer pool hit rate” at the bottom and it shows a 1000 / 1000, which is the best value you can get.

There is a better way to get this information from MySQLs internal data tables:


SELECT HIT_RATE FROM information_schema.INNODB_BUFFER_POOL_STATS;

This can also be calculated through two global status variables, and you can run the following SQL query to get the same value:


SELECT 1000 * (1 - ( 
   (SELECT variable_value FROM performance_schema.global_status WHERE variable_name = 'innodb_buffer_pool_reads')
    / (SELECT variable_value PageSize FROM performance_schema.global_status WHERE variable_name = 'innodb_buffer_pool_read_requests')
)) AS innodb_cache_hit_rate;

Outputs:


+-----------------------+
| innodb_cache_hit_rate |
+-----------------------+
|     971.9755334547322 |
+-----------------------+

This gives a hit rate of 99,999%, or a 1000 / 1000 as calculated in the InnoDB buffer pool status.

This is a very good value, but when its worse than 90%, then this usually means that too many reads are not hitting the buffer pool as mentioned before.

InnoDB status seems to multiply the percentage by 1000 instead of 100 to get “human readable” values, 971.975 essentially means 97,1975%.

But what time frame are those numbers relating to? Reading the MySQL docs very carefully it seems that the following is true, though I am not 100% sure about this. Please comment if you know more.

CommandTimeframe
SHOW ENGINE INNODB STATUSSince last time command was run
SELECT HIT_RATE FROM information_schema.INNODB_BUFFER_POOL_STATS;Since last time the command was run
Selecting from global status variables innodb_buffer_pool_reads and innodb_buffer_pool_read_requestsSince server startup

If you want to calculate how high the number is in a fixed time window, you need to store the variables innodb_buffer_pool_reads and innodb_buffer_pool_read_requests regularly and compute the hit rate on the difference of consecutive measurements.

30 Minutes agoNowDifference
innodb_buffer_pool_reads857970858845875
innodb_buffer_pool_read_requests4009269570614030386749482111717887

This blog post on INNODB SHOW ENGINE STATUS walk-through by renowned MySQL performance expert Peter Zaitsev of Percona has little additional information about a good or bad value, but mentions that it depends on the application when a bad cache hit ratio starts leading to increased I/O.

How big is my MySQL dataset including indexes?

To understand how big the InnoDB Buffer pool should be, you need to look at how big the dataset actually is and there is this handy query that you can run to find that out:


SELECT
  table_schema as `database`,
  table_name as `table`,
  SUM(round(((data_length+index_length)/1024/1024),2)) as size_mb
FROM information_schema.tables
WHERE engine = "InnoDB" AND table_type = "BASE TABLE"
  AND table_schema not in ("mysql", "sys", "information_schema", "perfomance_schema")
GROUP BY `database`, `table` WITH ROLLUP;

For my Shopware Demo shop application this results in the following, with most rows cut for readability:


+------------+-------------------------------------------------+---------+
| database   | table                                           | size_mb |
+------------+-------------------------------------------------+---------+
| shopware67 | acl_role                                        |    0.02 |
| shopware67 | category                                        |   21.47 |
| shopware67 | category_tag                                    |   11.61 |
| shopware67 | category_translation                            |   20.45 |
| shopware67 | product_search_keyword                          |   13.22 |
| shopware67 | seo_url                                         |   27.70 |
| shopware67 | seo_url_template                                |    0.03 |
| shopware67 | shipping_method                                 |    0.09 |
| shopware67 | NULL                                            |  132.35 |
| NULL       | NULL                                            |  132.35 |
+------------+-------------------------------------------------+---------+
229 rows in set (0.01 sec)

You can see the size in MB of individual tables, and the “rollup” meaning the sum over all the tables combined. Here we have 132MB of data in the database, which is not very hard to all keep in memory. Even with the just 8 MB Buffer Pool from above, the Hit Rate is at 97% when just browsing through the UI, because not all of the 132 MB are needed.

Contrast with the Tideways database, which currently has 300 GB of data. It still achieves a nearly 100% cache hit rate, because the “working set” of data is much smaller. About 290 GB are historical data that are rarely read.

The query for the data size thus only gives the upper limit of what you might need for the InnoDB Buffer pool size. Each application is different with respect to what its “working data set size” is.

Changing the InnoDB Buffer Pool Size

Now to the final important piece, changing the value. This should be done on server startup and requires root access to the Database server, or maybe is changeable through the control panel of your hosting or cloud provider. There is most likely a mysqld.conf somewhere in /etc/mysql or a subfolder, this differs between Linux distribution.

In this file you either already find the setting, or you add the setting with the value you want and restart the MySQL server afterwards:

innodb_buffer_pool_size=16g

If you want to change the value at runtime without restart, that is also possible. But be aware that it reverts back to the configured server value when restarted without changing the configuration:


mysql> SET GLOBAL innodb_buffer_pool_size=16g;

See the MySQL documentation for more information on changing this value.

How we use hyperfine to measure PHP Engine performance

One of our recurring jobs at Tideways is to ensure that all of our instrumentation works with new and upcoming PHP versions. For us, “working” doesn’t just mean that the results are correct, but that your PHP extension is fast, gathering insights for our customers with a minimal performance overhead.

While we have a comprehensive automated test suite, especially for new PHP features or library updates, sometimes we manually investigate – and one of our main tools for this job is hyperfine.

What is hyperfine

Hyperfine is a command-line benchmarking tool that takes care of handling the challenging parts of performance measurement correctly. By presenting execution times in a reliable, consistent and human-readable way, it ensures clear communication of the results. Beneath the surface, hyperfine also takes care of all the minute details that pose a challenge during benchmarking, thereby making it easier to get good and correct results.

All you need to do is pass it different command invocations, and it will compare them using multiple executions to get reliable data..

Let’s start with a simple example. We run the sleep command for one, two and three seconds.


hyperfine 'sleep 1' 'sleep 2' 'sleep 3'

The output shows us that “sleeping for 1 second” was 1.98 ± 0.01 times faster than “sleeping for 2 seconds”. One of the things to note is that hyperfine always shows you the measurement uncertainty.

With sleep this uncertainty is very low, showing 1.020 s ± 0.006 s, meaning the execution is confidently measured to take 1.014 to 1.0026 seconds. Other programs can have a lot more variance and therefore uncertainty.

For example, when comparing 603.9 ms ± 170.8 ms and 502.1 ms ± 400.8 ms we can’t make any statement regarding what is actually faster, as the errors overlap too much. Being mindful of this can be very useful to focus on meaningful improvements.

Measuring PHP performance

Now, how does that work for PHP?

We test two main things: The same PHP code with different PHP binaries, for example different versions or build flags, and different PHP code with the same binary.

In the following test, we run a million sprintf calls using PHP 8.3 and PHP 8.4:


namespace bench;

$i = 10_000_000;

while($i--) {
    key('test', 123);
}

function key(string $type, int $identifier): string
{
    return \sprintf('last_ts_%s_%s', $type, $identifier);
}
hyperfine '/opt/php-8.3/sapi/cli/php bench-sprintf.php' \
     '/opt/php-8.4/sapi/cli/php bench-sprintf.php'

In cases where the command gets quite long, for example, when adding ini settings with -d we can also use Hyperfine’s placeholder parameter.

hyperfine -L version 8.3,8.4 \
  '/opt/php-{version}/sapi/cli/php bench-sprintf.php -d opcache.enable_cli=1'

Testing on the CLI: Be mindful of OPcache

By default, OPcache isn’t enabled for CLI scripts. This is done to avoid the cost of the optimization for one-time scripts. For our case, we want to use OPcache as this will provide the relevant insights for web-requests or long-running scripts:

hyperfine '/opt/php-8.3/sapi/cli/php -d opcache.enable_cli=1 bench-sprintf.php'  \
   '/opt/php-8.4/sapi/cli/php -d opcache.enable_cli=1 bench-sprintf.php'

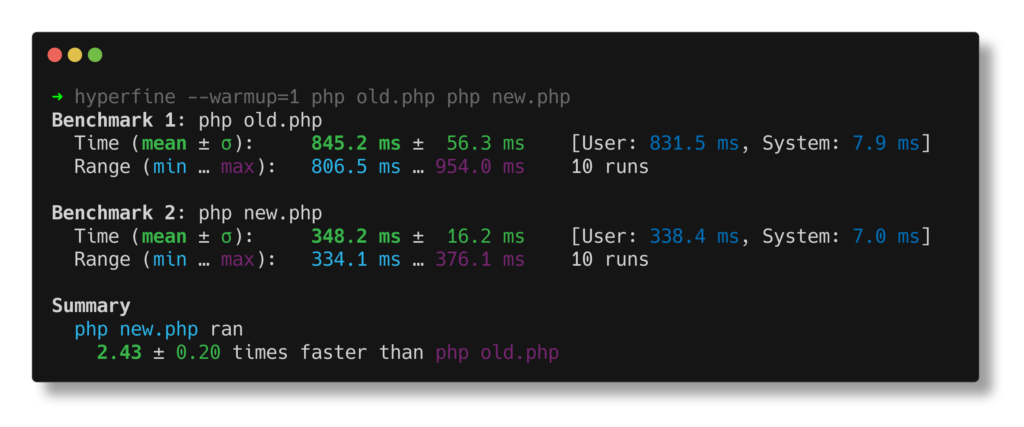
Here we see PHP 8.4 executing 1.47 times faster, already an impressive difference, but we’re also still paying the cost of the function calls, which also adds some overhead.

So let’s isolate the change to just the sprintf call.


$i = 10_000_000;

while($i--) {
    sprintf('last_ts_%s_%s', 'abc', 1);
}

And see how the numbers change:

hyperfine -L version 8.3,8.4  \
   '/opt/php-{version}/sapi/cli/php -d opcache.enable_cli=1 \
   bench-minimal.php'

Over six times faster! Measuring things and making definitive statements is always tricky, and it’s easy to get things wrong. If we, for instance, forget to enable OPcache, the example above only shows a 1.8x difference between PHP 8.3 and 8.4 instead of the over 5x we’re seeing here.

When testing with PHP versions before PHP 8.5, it’s also possible that the OPcache extension isn’t loaded and PHP will silently ignore the OPcache ini settings, invalidating the results. Double-checking with php -m | grep -i opcache or with some code in the test script can prevent that issue.

This happens because of our simple test case. Now that PHP 8.4 can turn \sprintf into an interpolated string containing only literals, OPcache will recognize that this string isn’t used and optimize that out. Using a couple of variables as parameters or assigning the result to something will change this behavior. Try it out yourself! A lot of the value in benchmarking comes from being surprised and then learning something while trying to explain the results.

Benchmarking code chances

Now let’s make some comparisons within one PHP script:


namespace bench;

extension_loaded('zend opcache') || throw new \Exception('Missing OPcache');

$i = 10_000_000;

if ($_SERVER['argv'][1] === 'with_backslash') {
    $function = with_backslash(...);
} else if ($_SERVER['argv'][1] === 'without_backslash') {
    $function = without_backslash(...);
} else {
   throw new \Exception('Invalid parameter');
}

while($i--) {
    $function('abc', 1);
}


function with_backslash(string $type, int $identifier): string
{
    return \sprintf('last_ts_%s_%s', $type, $identifier);
}

function without_backslash(string $type, int $identifier): string
{
    return sprintf('last_ts_%s_%s', $type, $identifier);
}
hyperfine -L mode with_backslash,without_backslash  \
   '/opt/php-8.4/sapi/cli/php -d opcache.enable_cli=1 bench.php {mode}'

Over 1.3 times faster by adding a single character, or using the equivalent use function sprintf import.

Here, we can nicely see that the optimization only takes effect when PHP can see that sprintf is the global sprintf. Without the \ PHP needs to look up if a locally defined \bench\sprintf namespaced function exists, and thus PHP can’t optimize the call for you.

Note that this specific optimization is not performed by OPcache, but rather happens in the compiler itself. Other types of optimization are specific to OPcache though. Hence, we suggest you always turn it on to make sure your tests match how you will later run your code.

Outro

We hope this serves as a nice overview of benchmarking with hyperfine and showcases some key considerations to keep in mind when testing PHP.

An AI would never be able to dive this deep into technical topics surrounding PHP performance! Follow us on LinkedIn or X and subscribe to our newsletter to get the latest posts.

Let’s dive in and find out what is causing performance bottlenecks! Without Tideways, you’re likely to fish in murky waters attempting to figure it out. Try our free trial today and be enlightened.

Testing if Franken PHP Classic Mode is faster and more scalable than PHP-FPM

FrankenPHP bills itself as “The Modern PHP App Server” and provides a single-process solution to running PHP. Its worker mode allows to greatly increase the performance of cleanly developed applications that are compatible with it by saving on framework bootstrapping time.

Unfortunately, not every application is compatible with worker mode. Depending on the amount of global state kept by the application, updating it for worker mode is not always easy.

For completeness, we investigate if FrankenPHP in “Classic Mode” is also able to speed up your application. Prior research by Ivan Vulovic in https://vulke.medium.com/frankenphp-vs-php-fpm-benchmarks-surprises-and-one-clear-winner-173231cb1ad5 suggests it is – but the numbers seem a little too good to be true.

In this blog post, we aim to verify these results with the explicit goal of testing PHP runtime performance itself, and not the performance of PHP script execution, Linux scheduler, web server, or other influences. Our results show that there is essentially no performance or throughput difference between PHP-FPM vs. FrankenPHP Classic-Mode.

Benchmark Setup

As in our previous article comparing the performance of different PHP versions across popular applications, we’re using a Hetzner VPS with 8 dedicated vCores on an AMD EPYC 7003 or EPYC 9004 (Hetzner CCX33). This time, the operating system is the newly released Debian 13 (“Trixie”).

We’ll be comparing FrankenPHP v1.9.1 (PHP 8.4.12 Caddy v2.10.2) against nginx/1.26.3 paired with PHP-FPM 8.4.11. The measurements are performed using Vegeta v12.12.0.

We’re installing FrankenPHP as a Standalone Binary using the recommended curl |sh command. Both nginx and PHP-FPM are installed using Debian Trixie’s official package repositories.

After installation, we only make a small change to nginx’ configuration, adjusting the port to avoid conflicts and to enable the PHP configuration block provided by Debian.

At this point both FrankenPHP and the nginx+FPM combination run with their default configuration, without any performance tuning.

Given that we want to measure the overhead added or removed by selecting a different runtime environment and not the performance of PHP itself, we’re going to test with simple scripts that do not contain any actual business logic.

In addition, we are not testing with a lot of concurrency; instead, we spawn 1 worker per CPU. For the full Vegeta output including more throughput and response percentiles click on the “test label” in the first column of each result table below.

Testing HTML Response Generation

A common server-side rendered HTML landing page contains about 50 KiB of data, so let’s use this one as the basic benchmark:


header('content-type: text/html; charset=utf-8');

$str = str_repeat('x', 1023) . "\n";

for ($i = 0; $i < 50; $i++) {
	echo $str;
}
ResponseFPM rpsFrankenPHP Classic rpsFPM 99% msFrankenPHP Classic 99%
HTML7023.116934.062.022 ms2.06 ms

Across this 60-second benchmark with 8 clients hammering the server as fast as possible, the nginx+FPM combination was able to serve 7023 requests per second (with overall better latency), whereas FrankenPHP in classic mode could serve 6934 requests (with a little better maximum latency). Nginx+FPM are thus roughly 1.3% faster than FrankenPHP in classic mode. Not enough to really matter.

Case closed? Not yet. A landing page is just one of the cases you’re going to experience in your application. What if, for some reason, the results change for other use cases?

Testing Binary Response Generation

Instead of an HTML response, let’s try a binary response format, for example, PDF:

ResponseFPM rpsFrankenPHP Classic rpsFPM 99% msFrankenPHP Classic 99%
HTML7023.116934.062.022 ms2.06 ms
PDF7610.315368.851.828 ms4.246 ms

It seems that FPM got faster (with even better latencies) and FrankenPHP got slower, only by changing the content-type from text/html to application/pdf, keeping the response exactly the same:


header('content-type: application/pdf');

$str = str_repeat('x', 1023) . "\n";

for ($i = 0; $i < 50; $i++) {
	echo $str;
}

Let’s try again with an “encrypted” base64-encoded payload being embedded into our HTML. Encryption is simulated by random data:


$random = new \Random\Randomizer(new \Random\Engine\Xoshiro256StarStar());
for ($i = 0; $i < 50; $i++) {
	echo $random->getBytesFromString("ABCDEFGHIJKLMNOPQRSTUVWXYZabcdefghijklmnopqrstuvwxyz0123456789+/", 1023), "\n";
}
ResponseFPM rpsFrankenPHP Classic rpsFPM 99% msFrankenPHP Classic 99%
HTML7023.116934.062.022 ms2.06 ms
PDF7610.315368.851.828 ms4.246 ms
Random1940.055606.227.704 ms3.143 ms

Both FPM and FrankenPHP became slower, but that is expected since the script now does much more work. This time FrankenPHP beats FPM 2.89×. An odd result, that can be explained later in the blog post.

What if we try to do even less work than our landing page example rather than more work? Let’s try with a Hello World example.


echo "Hello World!";
ResponseFPM rpsFrankenPHP Classic rpsFPM 99% msFrankenPHP Classic 99%
HTML7023.116934.062.022 ms2.06 ms
PDF7610.315368.851.828 ms4.246 ms
Random1940.055606.227.704 ms3.143 ms
Hello World18478.6918403.810.904 ms0.877 ms

Both FPM and FrankenPHP are serving an impressive 18400 requests per second at a 0.4% difference in RPS.

Testing With Higher Concurrency

The article by Ivan Vulovic compared the performance with higher concurrency. While we believe this not to be particularly useful, since we would be measuring the performance of the operating system’s scheduler more than anything else, perhaps FrankenPHP is doing something to be more friendly to the scheduler. Let’s see with the Hello World example that is comparable to the tests done by Ivan Vulovic:

ResponseFPM rpsFrankenPHP Classic rpsFPM 99% msFrankenPHP Classic 99%
HTML7023.116934.062.022 ms2.06 ms
PDF7610.315368.851.828 ms4.246 ms
Random1940.055606.227.704 ms3.143 ms
Hello World18478.6918403.810.904 ms0.877 ms
Hello World Concurrency 10021847.6122675.249.742 ms23.365 ms

FrankenPHP serves roughly 3.7% more requests per second, but at a much worse latency distribution.

Testing with Optimized Configuration

Up until this point, we were running the “default configuration” for both FrankenPHP and nginx+FPM. Let’s look into some performance tuning.

FrankenPHP provides an official Performance Optimization section in the documentation. No actionable FrankenPHP-specific advice is provided, except for “Don’t use Musl”, which we are not.

For nginx and FPM, there’s no official guide that we are aware of, but we’ve made the following changes:

  • Disabled access logs in nginx (matching FrankenPHP).
  • Enabled fastcgi_keep_conn in nginx.
  • Configured pm=static and pm.max_children=16 in FPM (matching FrankenPHP’s num_threads).

Making these changes did not result in any differences worth mentioning.

Accounting for Output Compression Performance

So, how can all the above results be explained, especially the sudden deviations in the PDF and Random test scenarios?

It appears we were not actually measuring the performance or overhead of PHP-FPM vs. FrankenPHP, but rather the quality of the output compression implementation of nginx and Caddy, respectively.

Vegeta is setting a accept-encoding: gzip request header, and both nginx and FrankenPHP will automatically compress responses coming from PHP when the circumstances are right:

Is Webserver compressing?FrankenPHPnginx
HTMLyesyes
PDFnono
Randomyesyes
Hello Worldnoyes

In the case of the PDF example, the response will not get compressed with either FrankenPHP or nginx. In the case of nginx, skipping this compression seems to improve performance; FrankenPHP seems to handle this case of a larger response body not particularly well. On the other hand, nginx is not able to handle incompressible random responses well when attempting to compress them.

We could also confirm this by setting an accept-encoding: identity request header with Vegeta to disable the compression.

Using the landing page example with 8 concurrent requests shows numbers comparable to the PDF invoice when compression is disabled:

ResponseFPM rpsFrankenPHP Classic rpsFPM 99% msFrankenPHP Classic 99%
HTML7023.116934.062.022 ms2.06 ms
PDF7610.315368.851.828 ms4.246 ms
Random1940.055606.227.704 ms3.143 ms
Hello World18478.6918403.810.904 ms0.877 ms
Hello World Concurrency 10021847.6122675.249.742 ms23.365 ms
HTML No GZIP7456.475504.161.786 ms3.993 ms

We also did some final tests with HAProxy 3.0.11 instead of nginx as the FastCGI gateway in front of PHP-FPM and were able to squeeze out some additional RPS with even better latency compared to nginx, but not really enough to matter in practice.

Conclusion

As a conclusion, we can confidently say the differences in overhead between PHP-FPM and FrankenPHP in classic mode are not relevant enough to suggest moving to FrankenPHP Classic Mode is always better.

As with our previous benchmarks, we can conclude that your application’s architecture has the biggest impact on performance, that there is no shortcut that will magically make things faster.

Shaving off the last microsecond from PHP’s startup performance will not make an impact when spending several hundred milliseconds waiting for the database.

An APM such as Tideways can help find this kind of offender within your application code.

As for choosing a PHP runtime, use whatever your team is comfortable with already.

  1. When using Caddy with PHP-FPM, moving to FrankenPHP can reduce operations complexity.
  2. When you want to benefit from one of the FrankenPHP exclusive features, like 103 early hints, Go extensions, or Mercure realtime support, a move from PHP-FPM to Classic mode might make sense.
  3. In other cases PHP-FPM still has an edge in performance when your application code is already optimized but not yet ready for worker mode.

What’s new in PHP 8.4 in terms of performance, debugging and operations

The close of 2024 is near, and that also means a new version of PHP is about to be released: 8.4!

There has already been some discussion regarding the latest features and modifications affecting developers, for example on either stitcher.io or php.watch

We wrote this post with a totally different angle, highlighting the performance, debugging, and operations-related changes in PHP 8.4 that are usually less publicized.

If you are here to find out: Is PHP 8.4 faster than previous versions? See our benchmark.

Several of these changes were even contributed by Tideways.

SHA-NI for SHA-256

Cryptographic algorithms can be much faster when they are implemented directly on the CPU as instructions. This is what the SHA Extensions (SHA-NI) are for SHA-256.  

With this PR, Tim added SHA-NI support for the SHA-256 hash algorithm to PHP core, basing it on the excellent work in the tarsnap/libcperciva library.

This improves performance by a factor of 2x to 5x, which is a fantastic gain, making SHA-256 even faster than some of the less secure alternatives, allowing to improve performance and security at the same time.

#[Deprecated] Attribute

As of PHP 8.4, you can add #[\Deprecated] to any function, method or class constant and when they are used a deprecation message is triggered through the standard PHP error mechanism. 

Use of this attribute looks like this:


#[\Deprecated("use test() instead", since: "2.4")]
function test() {
}
 
class Clazz {
    #[\Deprecated]
    public const OLD_WAY = 'foo';
 
    #[\Deprecated]
    function test() {
    }
}

It nicely integrates into the Tideways deprecation tracking:

Screenshot PHP 8.4 performance

sprintf()-Compile Optimization

If you use just the %s and/or %d symbols in a sprintf format string, then starting with PHP 8.4 this is compiled down into the equivalent string interpolation.

Property Hooks: Alternative to getter/setter methods?

The headline feature of PHP 8.4 is certainly property hooks and this zend.com blog post includes all the details.

Lazy Objects

Sometimes an object represents a network resource and its creation already takes a significant amount of time, even when it’s not used in the end. This is often the case with record or entity objects representing database rows. 

PHP 8.4 ships a new feature “lazy objects” that allows “shallow” creating an instance of an object that is only initiated when it’s actually accessing and using any properties.

A database library such as Doctrine ORM will greatly benefit from this as this can be implemented in PHP code, but it’s quite slow and complicated. Now, this kind of code is as simple as:


class Article {
        public ?int $id = null;
        public string $title;
        public string $body;

        public static function find(int $id) {
                $reflection = new ReflectionClass(self::class);
                $instance = $reflection->newLazyGhost(function ($article) use ($id) {
                        echo "loading\n";
                        // here be database code loading the instance from the DB.
                        $article->title = "foo";
                        $article->body = "bar";
                });

                $idProperty = $reflection->getProperty('id');
                $idProperty->setRawValueWithoutLazyInitialization($instance, $id);

                return $instance;
        }
}

$article = Article::find(1);
echo "ID: " . $article->id . "\n";
echo "Title: " . $article->title . "\n";
echo "Body: " . $article->body . "\n";

This is a pretty advanced feature and will probably be used mostly by libraries, but it can really provide some pretty powerful optimizations.

get_browser() Improvements

Niels Dossche provided a patch that improves the performance of get_browser() significantly. Depending on the use-case it will be 50%-250% faster than in PHP 8.3.

We wrote about how slow get_browser() is in this recent blog post comparing it to two userland libraries.

Frameless Internal Functions

Ilija Tovilo implemented a performance improvement that will benefit all PHP applications. With frameless internal functions, a few commonly used functions do not need a frame in the stack, which are expensive to set up.

Closure Naming in Stacktraces

With PHP 8.4, ambiguous naming of closures in stack traces has been improved. This is helpful for both debugging, but debuggers and profilers such as Xdebug and Tideways benefit as well by being able to re-use these names, reducing overhead slightly.

An AI would never be able to dive this deep into technical topics surrounding PHP performance! Follow us on LinkedIn or X and subscribe to our newsletter to get the latest posts.

Let’s dive in and find out what is causing performance bottlenecks! Without Tideways, you’re likely to fish in murky waters attempting to figure it out. Try our free trial today and be enlightened.

What are compiler optimized internal PHP functions and should you import them via use statement?

Every once in a while when browsing through open-source code, you will probably have come across internal functions that are either imported implicitly with use function array_map; like here in Doctrine or prefixed with the global namespace separator, for example \is_string($foo) like in Symfony.

Curious beings as we are, you might wonder as did I: Why are they doing this? Do function calls not automatically fall back into the global namespace?

Yes they do, you don’t technically need to use function or prefix with the global namespace separator.

But there is another technical reason why open-source libraries do this: A small number of PHP internal functions has compiler optimized versions that avoid a lot of the internal overhead of an internal function call in the PHP engine. You can find these functions in the zend_compile.c file of PHP.

You might raise the point that this sounds like a micro-optimization and you are correct.

For open-source code you can argue that it should be a matter of good style to provide the lowest overhead possible.

For your own application code, this optimization is less important but there are cases where this optimization does matter as well: When you call these compiler optimized functions hundreds of thousands of times and your application has low response times in the 20-200ms range.

Granted, these cases are rare – but its good to having heard about this optimization nonetheless.

Should we stop here? No! Two topics are interesting to look into with compiler optimized functions:

  • Benefiting from the optimization by relying on code formatting automation
  • Can we measure compiler optimized functions in a Profiler and how would that look like?

Automatically import compiler optimized functions using available tools

When you are using a modern auto-formatting tool such as php-cs-fixer or phpcs with phpcbf already, then importing these optimized functions doesn’t even require a lot of work and can be fully automated. If that is the case, you can benefit from this optimization at nearly zero costs, you don’t even have to know or think about it.

For php-cs-fixer there is the native_function_invocation rule with the default configuration setting @compiler_optimized:

php php-cs-fixer-v3.phar fix src/ --allow-risky=yes --rules=native_function_invocation

For phpcs you can use the SlevomatCodingStandard.Namespaces.ReferenceUsedNamesOnly sniff from slevomat/coding-standard, but be aware that it does quite a bit more than just importing compiler optimized internal functions.

<!-- phpcs.xml -->
<ruleset>
    <rule ref="SlevomatCodingStandard.Namespaces.ReferenceUsedNamesOnly">
</ruleset>

And then run:

php vendor/bin/phpcbf

How Profilers see compiler optimized functions

There is something to learn about PHP engine and how profilers work with compiler optimized functions. By implementing the short cut for these few functions in the engine, they also circumvent the hooks that profilers use to detect track the execution.

Take this simple bit of code that re-implements a small variation of str_repeat in userland code and uses strlen doing so:

<?php

namespace MyStandardLib;

function my_own_str_repeat($chars, $length)
{
    $new = '';
    for ($i = 0; strlen($new) < $length; $i++) {
	    $new .= $chars;
    }
    return $new;
}

$str = my_own_str_repeat("x", 100000);
echo strlen($str) . "\n";

If we run this through Tideways Callgraph Profiler, Xdebug or any other Profiler you can spot the strlen functions being executed 100.000 times. Because of the missing import from the global namespace, the engine cannot use the compiler optimized version, since a user defined strlen might exist in the MyStandardLib namespace.

See how Tideways already gives you a hint about a potential optimization here, only because it would make an impact on the bottom line of this script, measured at 24% of total execution time.

As a side note: If you are wondering about the shart drop from 7,24ms to 1,81ms, this must be attributed to the profiling overhead that I have written about elsewhere, caused by an otherwise quick internal function called an excessive number of times.

As soon as you add a leading namespace slash to import the function the Profiler does not observe the execution anymore. It looks like my_own_str_repeat is a function that has no child calls. In its 1,24ms execution somewhere the optimized 100.000 strlen functions are hidden:

The Profiler will not be able to detect that strlen is even called anymore, on the account of the PHP engine’s shortcut.

So should you import functions that the compiler can optimize for performance reasons? The answer is: It depends. When the overhead is significant then yes, otherwise you could ignore this as a being too micro an optimization.

What’s next?

  1. Sign Up for our Newsletter if you don’t want to miss the next post on our blog.
  2. Start your 14 days free trial of Tideways for effortless performance insights into your PHP application.

Autoloading Performance – Avoid These 5 Mistakes!

Autoloading performance affects every PHP application. And no, it’s not a solved problem just because Composer handles autoloading for you nowadays.

In fact, for large applications like Magento, Shopware, or those based on Symfony or Laravel, autoloading can turn into a major performance bottleneck. More than 100 ms per request is not uncommon, caused by one of these common mistakes:

Let’s break it down.

What Is Autoloading Performance?Autoloading performance is distinct from PHP’s compile performance and interacts closely with OPcache.

When PHP encounters a class that hasn’t yet been loaded, it triggers the autoloader system. This involves calling callbacks registered via spl_autoload_register(). These callbacks are executed in sequence until the class is found or PHP throws a fatal error.

Each time this happens, PHP spends time:

  1. Running the autoloader callback(s)
  2. Calling the constructor of classes
  3. Compiling the class (unless already cached in OPcache)

In this blog post we are going to look at point 1: time spent in autoloader callback(s). And while Composer is responsible for this in modern PHP applications, there is still a lot that can go wrong.

As for point 3: Time spent compiling can be reduced to effectively zero by correctly using OPcache as detailed in this post on our blog.

1. Not Dumping a Class Map

Using classmap-based autoloading can significantly reduce overhead.

With Composer, you can optimize autoloading using:

composer dump-autoload --optimize

This generates a autoload_classmap.php file with a precomputed map of class names to paths. The autoloading code then has a shortcut that greatly reduces the runtime of autoloading.

Without a classmap, Composer must run much more complicated code to compute the path for every class and, most importantly, use an expensive file_exists check.

While it seems like an obvious optimization that is well-known, we still see 10-20% of customers are not optimizing autoloaders for production apps, and it would usually cost you 10-50ms in every request, and sometimes even more.

Tip: Always dump your classmap after potentially generating classes in a compile step. This is especially important in frameworks like Magento that auto-generate hundreds of classes.

2. Loading Unused Classes

Autoloading everything on every request is wasteful.

This happens often due to:

  • Eager Dependency Injection
  • Event systems loading all listeners
  • Route matchers loading every controller

Solution: Introduce lazy-loading or cutoffs to prevent loading unnecessary parts of the object graph.

Symfony framework is a good example where this work has happened under the hood over the last major versions. It’s EventDispatcher includes several optimizations where you don’t have to instantiate all listener objects for all events in every request. It does this by passing a factory closure as a listener instead:

// This code is what the Symfony Dependency Injection container performs
// under the hood when registering a listener.
$eventDispatcher->addListener(
    KernelEvents::REQUEST,
    function ($event) {
        // only when here, MyListener and ExpensiveDependency trigger autoloading
        // and the time of calling their constructor is spent.
        (new MyListener(new ExpensiveDependency))->onKernelRequest($event);
    },
);

// dispatch "unwraps" the listener by calling the closure, only then MyListener
// and the ExpensiveDependency are created. 
$eventDispatcher->dispatch(
    new RequestEvent(/** ... */), KernelEvents::REQUEST)
);

With potentially hundreds of listeners and each of them having many dependencies, this can prevent a lot of autoloading happening for classes that ultimately will not be used in the concrete request.

Bonus: PHP 8.4 introduces native lazy-loading support for DI containers, which will greatly improve this situation in the future. See my YouTube video series on Native Lazy Objects in Doctrine (part 1), Symfony (part 2), and Magento 2 (part 3).

3. Expensive Prepended Custom Autoloaders

A chain of multiple autoloaders can be tricky for performance. Composer’s autoloader should ideally be first in the chain—it resolves ~95% of classes quickly with the generated classmap. Then more custom and specialized, potentially expensive autoloaders can run afterward.

Custom autoloaders that prepend themselves to Composer can slow everything down.

Case in point: the older, now abandoned Laminas package laminas-zendframework-bridge prepended an autoloader before Composer’s autoloader to simplify the ZendFramework to Laminas Rename Migration. That package significantly increased autoload times and automatically activated itself as a second-level dependency when using any kind of Laminas package.

Use spl_autoload_functions() to inspect, deactivate, replace, or reorder autoloaders if needed.


require_once 'vendor/autoload.php';

$functions = spl_autoload_functions();
foreach ($functions as $function) {
    if ($function instanceof \Closure) {
        $reflection = new ReflectionFunction($function);
        // check if autoloader closure is from laminas zendframework bridge
        if (str_contains($reflection->getFileName(), 'laminas-zendframework-bridge')) {
            spl_autoload_unregister($function);
        }
    }
}

4. Building Your Own Preloading Scripts

Preloading libraries manually was popular before Composer matured. Think: Doctrine 1’s “All-in-One” file or Symfony 2’s early class loaders.

But today, these preloading scripts are largely unnecessary and often counterproductive:

  • They load too many classes upfront, requiring memory, which costs performance.
  • They clutter stack traces and make debugging with XDebug harder
  • They reduce flexibility

Modern DI containers like Symfony’s use smarter preloading based on actual runtime needs.

5. Not Using OPcache Preloading

OPcache preloading is a powerful built-in feature since PHP 7.4.

It allows loading frequently-used classes once at PHP startup, keeping them in memory across all requests.

Benefits:

  • Skip autoload callbacks entirely
  • Reduce file I/O
  • Improve response times by 5–10% for fast endpoints

For high-performance apps, OPcache preloading gives an additional edge that you don’t want to leave on the table. See my previous blog post on OPcache preloading for details.

Conclusion

Composer is a fantastic tool, but it doesn’t prevent autoloading from becoming a performance drag.

Avoiding the five mistakes above can save tens of milliseconds per request, which adds up fast.

Want more PHP performance tips? Subscribe to our newsletter or check out the full video for a deep dive with real-world examples.

Stay fast!

What’s next?

  1. Sign Up for our Newsletter if you don’t want to miss the next post on our blog.
  2. Start your 14 days free trial of Tideways for effortless performance insights into your PHP application.

Should You Use OPcache Preloading in Your PHP App?

Thinking about enabling OPcache Preloading to squeeze more performance out of your PHP application?

It’s an advanced feature with very specific benefits — and in most cases, you likely won’t notice a difference.

In this post, we’ll explain what OPcache Preloading is, how to set it up, and when (or if) it makes a measurable impact.

What is Preloading?

Preloading was introduced in PHP 7.4, contributed by Dmitry. It allows PHP scripts to be loaded and compiled once at process startup (before any requests), so functions and classes are ready immediately — as if they were built-in.

This is different from regular OPcache, which caches PHP scripts after first execution. Preloading complements OPcache by eliminating autoloading overhead and repeated include/require calls.

The main downside? PHP-FPM or Apache startup time increases, because all preload scripts are executed at once.

When Preloading Makes Sense

Preloading has a few technical pre-requisites:

  • Your app is the only one on the server or container
  • You’re using PHP-FPM or mod_php
  • You can provide a custom preload script

It does not help in setups like Laravel Octane, Roadrunner, FrankenPHP, or AWS Lambda. In fact, it may shift cold start time into boot time with no real net gain.

How to Set Up Preloading

  1. Write a preload script This should require all files you want loaded. Symfony does this out of the box. Laravel has third-party support. Or you can write your own. The PHP documentation on Preloading explains the requirements for such a script.
  2. Configure php.ini to enable preloading:

When your script from step 1 is called “preload.php” you need the php.ini to point to it. In addition you need to configure the username this script is run with. This should be the same user as the web-server or FPM is running under.

opcache.preload=/app/preload.php
opcache.preload_user=www-data

3. Restart PHP-FPM or Apache Check PHP logs and error tracking (e.g., Tideways) to ensure everything loads cleanly.

What Performance Gains Can You Expect?

In a typical Symfony or Shopware app, autoloading takes around 10–16ms. If the response time of your application is 1 second, preloading might save less than 1%. That’s not worth the complexity.

However, in fast apps that response below 100ms, the story changes.

Example: Tideways Ingest API

We tested preloading on our own application using the pre-generated Symfony preloading script.

The Ingest API receives 30k requests every minute with performance data from our customers. It just authenticates the sender data and then passes it on to a message queue for processing. We expect this API to be very fast to handle the high request volume.

In that case optimizing autoloading performance further will make sense. Before the preloading change we had a 95% percentile response time of 20ms. On average 1ms was spent in autoloading on every request.

After we enabled preloading the 95% response time dropped to 18ms and autoloading time dropped to 0.

That’s a 10% gain.

OPcache Preloading

It will allow us to handle the more of this traffic with fewer resources and save money on server resources.

Conclusion

Preloading isn’t a universal remedy — but in performance-critical, high-throughput environments, it can be worth it.

Use preloading if:

  • Your app is well-optimized
  • Response times are already low (<100–200ms)
  • You want to reduce CPU load at scale to save server resources and increase throughput

For apps with high response times, the relative benefit is negligible. Focus on bigger bottlenecks first.

Need help deciding whether preloading is worth it for your app? Tools like Tideways can measure autoloading and compilation time directly.

A Multi-Step Strategy for better Full Page Caching

A full page cache is a powerful performance optimization for web-applications with numerous visitors.

Instead of performing all the PHP and database work to render the same page over and over again, you cache the resulting HTML once and serve that time and again for a period.

But there is room for even more improvement, especially in e-commerce applications that use full page caching.

Edge Side Includes (ESI) is a standard for full page caching that has a clever approach to the problem of multi step caching. It allows storing different parts of a page as different cache entries in such a way that they can even have different cache lifetimes and dynamic invalidation without affecting each other.

The upcoming Shopware 6.7 moves from a single-step full page cache to using ESI for header and footer navigation, serving as an interesting real-world experiment to observe the benefits.

Single-Step Full Page Caching

Traditionally, with a full page cache, the complete HTML Output is either cached or not cached at the time of a new request coming in:

In the case of a cache miss, database and external systems such as Elasticsearch are queried to generate the response dynamically.

The output is then cached and on the next request to that same product page, most database, and external system calls as well as all processing of the data to HTML is skipped.

This usually leads to a huge performance improvement as well as a conscious use of processing resources.

In e-commerce applications, frequent changes in stock, prices, or dynamic features like segmentation often require invalidating the cache for product and category pages – leading to a low cache hit rate and frequent full page regeneration.

Generally, there are three solutions to improve this situation:

  1. Put in effort to reduce the number of cache invalidations, and the number of different cache entries due to customer segmentation. This is usually the most technically challenging approach because it requires in-depth understanding of the concrete requirements of the shop application you are optimizing.
  2. Warmup the cache using a background process. Whenever an entry gets invalidated, notify a background process that regenerates this page into the cache. This effectively offloads the burden of the “slow page” to affect only a robot, not a real user. But it requires plenty of computational resources to pull off, and will come at the wasteful cost of generating a lot of cached pages that are never looked at by a real user.
  3. Accept the low page cache ratio, and substantially reduce the response time for uncached pages. There is an even more radical approach here, where you build the shop application specifically with performance of product and category pages in mind, so that no caching is required at all.

Before you do all that, there are some simple first steps when trying to reduce the response time for cached pages that even a generic shop framework like Shopware (or Magento, WooCommerce for that matter) could implement first.

With multi-step caching, you can reduce the time to generate the uncached page by re-using HTML for common parts across all pages.

Conceptually, every web page can be grouped into different sections that show different high-level or detailed content of the site. The four main sections are usually header, sidebar, main content and footer.

In the context of full page caching, it’s only logical to think about caching these four sections separately.

In the case of a Shopware application and their default layout, the header section is the most interesting section because it contains the navigation menu that is known to take a significant amount of time to render – 50ms, 100ms, but also high three-digit sums are not unusual.

Then every time an uncached product or category gets rendered, at least we don’t incur the performance loss of rendering these common sections over and over again.

The tricky part to solve is cache expiry and invalidation of these sections. If the header cache entry expires because a category entry in the navigation gets deleted, for example, do all full page cache entries need to get invalidated as well?

This problem is solved by Edge-Side Includes. Instead of storing the sub-section into the output of the fully cached page, it caches only a reference to it using a special <esi:include> tag.

When rendering the full page, the software that implements the ESI rendering checks for these references and dynamically builds together the final output from the different cache entries. This could be Symfony HTTP Cache or Varnish for example.

This comes with two benefits: Invalidation of a sub-section such as the header does not require invalidation of all cache entries that make use of it.

Cache lifetime of the sections can be different, and the user still always sees the most recently cached output of every section of the page.

How it’s implemented in Shopware 6.7

Shopware is using the Symfony framework under the hood. This enables using either a PHP-based implementation or Varnish for the full page caching with ESI support.

The entry point for this functionality can be found in the base.html.twig template:

{{ render_esi(url('frontend.header', { headerParameters: headerParameters })) }}

The frontend.header route maps to a new controller action NavigationController::header:


#[Route(path: '/header', name: 'frontend.header', defaults: ['XmlHttpRequest' => true, '_httpCache' => true, '_esi' => true], methods: ['GET'])]
public function header(Request $request, SalesChannelContext $context): Response
{
    $header = $this->headerLoader->load($request, $context);

    $this->hook(new HeaderPageletLoadedHook($header, $context));

    return $this->renderStorefront('@Storefront/storefront/layout/header.html.twig', [
        'header' => $header,
        'headerParameters' => $request->get('headerParameters') ?? [],
    ]);
}

And the actual performance gain is then visible from a code-perspective in the diff for GenericPageLoader::load where all the code for loading and rendering the navigation was removed. When header and footer are cached, then all this processing is skipped because HeaderLoader::load and FooterLoader::load are not called anymore.

Measuring the Performance Impact

Looking at the upcoming Shopware change to its full page cache, we can compare the performance impact for a demo application to get a rough gauge for real-world impact.

Comparing two aggregated traces with callgraph data for 100 profiling traces on uncached product pages with Shopware 6.6 and 6.7 we can see a 110ms improvement for our demo shop: 65,3ms saved not rendering the navigation Twig template and 45.7ms loading and processing the category and navigation data from the database.

This is a significant improvement that will directly benefit all Shopware shops. Using ESI for header and footer is a simple and safe way to make full page caching more effective and I am keen to see the impact this change has on our Shopware benchmark report over the next quarters when people upgrade to version 6.7 of Shopware.

For you readers not using Shopware, this should hopefully serve as a good starting point on how to implement a full-page cache with muilti-step rendering to get a better overall cache hit ratio and faster responses for partially uncached pages.

What’s next?

  1. Sign Up for our Newsletter if you don’t want to miss the next post on our blog.
  2. Start your 14 days free trial of Tideways for effortless performance insights into your PHP application.

PHP Benchmarks: 8.4 performance is steady compared to 8.3 and 8.2

Every year, like clockwork, a new version of PHP is released at the end of November.

Naturally, you want to know, how much performance gain is in this new release across common frameworks and applications?

Our tests show that, in general, the performance between 8.2, 8.3 and 8.4 does not move much for a Laravel, Symfony and WordPress demo application.

Upgrading to the latest PHP version is not a magic pill to improve performance.

Not all is gloomy though, in our PHP 8.4 Performance, Operations and Debugging post you find a few specific ideas how you can use new features to improve your performance, for example sprintf compile time optimizations, SHA-NI or Lazy Objects. However, these will only be useful when using the respective functionality and might require some work on your part to integrate.

The biggest lever for performance is the application architecture and the code you write. If you want to find out where to start optimizing your application code, Tideways, our production-ready profiling and monitoring, can help you detect areas for improvement.

To benchmark PHP, we have set up these popular PHP projects:

  • Symfony with PHP 8.4, 8.3, and 8.2
  • WordPress with PHP 8.4, 8.3, 8.2, and 7.4
  • Laravel with PHP 8.4, 8.3, 8.2

Our intention is to give you a rough idea of how much performance is improved as a percentage by just updating the PHP version.

WordPress supports many PHP versions in parallel, so we use it as a good yardstick for performance changes from PHP 7 to 8.4.

Setup

The benchmarking is done under these conditions:

  • Code and Infrastructure Provisioning: github.com/tideways/php-benchmarks
  • Machine: Hetzner CCX 31 (8 dedicated vCores on EPYC 7003 or EPYC 9004)
  • OS: Debian 12 („Bookworm“)
  • Database:
    • MySQL 8.4.4 for WordPress and Laravel
    • SQLite 3 for Symfony
  • PHP (all built by deb.sury.org): 7.4.33, 8.2.28, 8.3.20, 8.4.6
    • JIT not enabled
    • FPM with static pool and 17 workers.
  • Projects: Laravel 12.3.0, Symfony 7.1.1, WordPress 6.7.2
  • Vegeta v12.12.0
  • HAProxy 3.0.9

You can find more on methodology after the results.

Results

Symfony

Upgrading just PHP 8.3 to 8.4 makes the Symfony demo application run with the same performance when simulating a fixed number of 100 requests/minute. Fluctuations are within the margin of error.

When run with 15 concurrent requests, the requests/seconds also do not vary significantly between PHP versions:

Laravel

Upgrading just PHP 8.3 to 8.4 shows no visible difference to response times of the Laravel demo application, except for a small improvement in the 99th percentile.

And the requests/seconds are close to each other as well.

In contrast to both Symfony and WordPress, we used our results for 5 concurrent users here and not 15, because for Laravel in particular the application was constrained by CPU scheduling with 15 concurrent users on just 8 cores and we didn’t want this effect to muddy the results.

WordPress

Similar with WordPress, upgrading from PHP 8.3 to 8.4 shows no significant change in response times. The comparison to PHP 7.4 does show that PHP 8 overall became slightly faster, though.

And again the requests/seconds are close to each other, with only PHP 7.4 showing a ~5% lower number.

❗With Tideways PHP Profiler, you can find bottlenecks in your application code by continuously profiling the production environment at low overhead. Get your free 14 -day trial to start optimizing.

More Notes on Methodology

With benchmarking, the results heavily rely on the assumptions and setup. There are a few changes we have made to other popular PHP benchmarks, and we want to discuss our methodology here.

We run the benchmarks in two modes:

  • With fixed requests per second, with a focus on response times
  • With a fixed level of concurrency, with a focus on requests per second.

Why do we not only report performance in requests per second? Other benchmarks often compare if a new PHP version can serve more requests per second. They do this by running as many requests as possible with a fixed number of concurrent threads that create new requests.

This provides synthetic or artificial comparisons because for real-world scenarios you would never run your PHP application at the limit of capacity and getting as many requests out as possible.

Instead, response time or time-to-first-byte (TTFB) under regular load is what you are interested in to understand how performance affects real users.

We don’t run the tests with very high concurrency because we want to make sure the numbers reflect PHP performance, not the operating system’s process scheduler, thus no CPU contention is happening.

Combining regular expressions with named capture groups to improve performance

Regular expressions are usually not top of mind when you think of performance bottlenecks in your application, but inefficient patterns or sub-optimal use of the APIs can make them slow.

A wonderful learning opportunity for this is a recent roughly factor of 2x performance improvement patch to Doctrine DBAL’s SQL Parser. This patch was submitted by Soner from Shopware fame, thank you to him.

Doctrine DBAL uses the SQL Parser to expand a single prepared statement parameter to a list of values, for example for a WHERE id IN (?) query.

SQL Parser Before the Patch

Before version 3.10 of Doctrine DBAL, the SQL parser used to iterate over 4 different regular expressions, and when one of them matched, the corresponding code was called. This was coded as an array of regular expression mapping to a closure:


/** @var array $patterns */
$patterns = [
    ':[a-zA-Z0-9_]+' => static function (string $sql) use ($visitor): void {
        $visitor->acceptNamedParameter($sql);
    },
    '(? static function (string $sql) use ($visitor): void {
        $visitor->acceptPositionalParameter($sql);
    },
    $this->sqlPattern => static function (string $sql) use ($visitor): void {
        $visitor->acceptOther($sql);
    },
    '[:\?\'"`\\[\\-\\/]' => static function (string $sql) use ($visitor): void {
        $visitor->acceptOther($sql);
    },
];

These patterns where checked in a loop and whenever one of them matched, they were iterated over again from the beginning:


while (($handler = current($patterns)) !== false) {
    if (preg_match('~\G' . key($patterns) . '~s', $sql, $matches, 0, $offset) === 1) {
        $handler($matches[0]);
        reset($patterns);

        $offset += strlen($matches[0]);
    } else {
        next($patterns);
    }
}

In a callgraph we can see that for 12 calls to Parser::parse, we have hundreds of calls to preg_match, key, current, next and reset and closures. Tideways has custom instrumentation for preg_match calls and shows a few starting characters of each regular expression, so that you can identify their performance individually.

A lot of potential for improvement there that this pull request captured.

The Patch

The patch rewrites the four regular expressions into a single one, using named capture groups to differentiate which one was matched:


$this->tokenPattern = '~\\G'
    . '(?P' . self::NAMED_PARAMETER . ')'
    . '|(?P' . self::POSITIONAL_PARAMETER . ')'
    . '|(?P' . $this->sqlPattern . '|' . self::SPECIAL . ')'
    . '~s';

while ($offset < $length) {
    if (preg_match($this->tokenPattern, $sql, $matches, 0, $offset) === 1) {
        $match = $matches[0];
        if ($matches['named'] !== '') {
            $visitor->acceptNamedParameter($match);
        } elseif ($matches['positional'] !== '') {
            $visitor->acceptPositionalParameter($match);
        } else {
            $visitor->acceptOther($match);
        }

        $offset += strlen($match);
    }
}

The syntax ?P<name> creates a named capture group that is then available in the $matches result array as a key. Its an empty string if it did not match, and a non-empty string if it matched.

This change removes the layer of indirection with the closures that call methods on the Visitor and cuts down on function calls for array traversal next, key, current and reset.

Measuring the Impact: 1,7x to 2,43x faster

When benchmarking the test-script from the PR with hyperfine the results speak for themselves, an improvement by a factor of 2,43x:

And comparing two callgraph profiles from before and after the change, we also see a 10ms drop from 24ms for an improvement by a factor of 1,7x.

You can also see how the closure calls and individual preg_match‘s are replaced by the single call to preg_match in the comparison of child functions.

The individual improvement depends on how often Parser::parse is called and how long the individual queries are that are parsed. The more characters a query has, the more significant the improvement becomes.

Combining regular expressions into one big expression is a common performance improvement, and libraries such as nikic/fastroute, symfony/routing or JayBizzle/crawler-detect make good use of it as well.

Got a tingly feeling for more insights on PHP performance, operations and debugging topics? Sign up for our newsletter.

Suffering from a slow web application and scratching your head as to why? Our PHP Profiler can help you out. Start a 14 day trial to get effortless performance insights from us, tailored to your application problems.

Lazy Loading Data Objects in PHP 8.4 with Doctrine ORM Example

PHP 8.4 includes a rather technical RFC called “Lazy Objects” which adds lazy loading functionality directly into PHP’s object model.

 In this blog post, I am going to explain what lazy loading is and how Doctrine implements it. I will show the approach the ORM took before PHP 8.4 and how the new Lazy Objects RFC improved the implementation.

By the end of the post, you will have some ideas on how to leverage this new feature for performance gains in your own application.

What is Lazy Loading?

Lazy loading is a pattern in programming that leaves the code to believe it interacts with an object of a certain type, however that object has not been fully initialized yet.

Think of lazy loading as deferring the constructor/factory of an object to a point where it’s actually used.

This allows passing around an object as a placeholder through the code, when you don’t know up front if it’s going to be used at all.

The most common example for this are database or cache connection objects, for example the connection in Doctrine DBAL:

namespace Doctrine\DBAL;

class Connection implements ServerVersionProvider
{
    protected ?DriverConnection $_conn = null;

    public function executeStatement(/** .. */): int|string
    {
        $connection = $this->connect();
        // ....
    }
    
    protected function connect(): DriverConnection
    {
        if ($this->_conn !== null) {
            return $this->_conn;
        }
        // ...
        $this->_conn = $this->driver->connect($this->params);
        // ...
        return $this->_conn;
    }
}

It connects to the database using a driver once, only when used for the first time, for example in executeStatement. Many other methods also call connect to obtain the connection, which will either open it – if called the first time – or return the already open connection.

Lazy Loading in Doctrine ORM

Doctrine ORM maps database rows to PHP classes. Database tables have relationships, that Doctrine represents as references between objects.

And this is where lazy loading comes into play. With a simple example, like Post on a message board, referencing the User that posted, it is modeled as a reference:


class Post
{
    public ?int $id = null;
    public string $message = '';
    public User $author;
}
class User
{
    public ?int $id = null;
    public string $name;
}

When you want to create a list of Post objects from the database, Doctrine doesn’t want to immediately load all associated authors for performance reasons.

Because Doctrine keeps data objects free from direct dependencies on the ORM library, it’s not possible to use an abstract base class that Post and User have to extend from to implement lazy loading.

Lazy Loading with PHP Engine Hacks and Code Generation

Up until PHP 8.4, Doctrine used code generation to implement lazy loading, by using a clever combination of engine level hacks and code generation.

  1. Generate a class UserProxy that extends User. Instantiate Post::$author with a UserProxy instead of a User object.
  2. unset() the declared properties of an object in the constructor of the proxy
  3. Implement a magic method __get interceptor that gets called when unset property is accessed, in our example User::$name
  4. Load all properties of the entity from the database and set the previously unset properties with their actual values.

The generated code for the proxy would roughly look like this (this is simplified for readability):


class UserProxy extends Proxy
{
    public function __construct(BasicEntityPersister $persister, int $id)
    {
        $this->_persister = $persister;
        $this->id = $id;
        unset($this->name);
    }
    
    public function __get($proprtyName)
    {
        $this->_persister->loadById(['id' => $this->id], $this);
        $this->_persister = null;
        return $this->$proprtyName;
    }
}

There is a lot more nuance to it that I want to spare you from, but if you wish to dive even deeper, feel free to look at LazyGhostTrait in Symfony VarExporter and Doctrine ProxyFactory using it.

There are a few downsides to this approach:

  • It requires a lot of complex code to get to work, relying on a few engine level hacks.
  • It prevents users from doing certain things with their classes (can’t be final, for example)
  • It can lead to weird behavior in meta programming, get_class($proxy) would not return User for example
  • It requires a “compile step” and decisions when and where to place the generated proxy code in your production setup.

Lazy Loading with PHP 8.4

Lazy Loading becomes a core level feature in PHP 8.4, and you can create a lazy instance of an object through ReflectionClass::newLazyGhost now.

A lazy ghost is initialized when one of these things happens: lazy property read/write, ReflectionProperty::set(Raw)Value/get(Raw)Value and a few more.

Creating a proxy in Doctrine ORM 3.4 is just a few lines and requires no code-generation anymore:


public function getProxy(string $className, array $identifier)
{
    $classMetadata   = $this->em->getClassMetadata($className);
    $entityPersister = $this->uow->getEntityPersister($className);

    $proxy = $classMetadata->reflClass->newLazyGhost(
        function (object $object) use ($identifier, $entityPersister): void {
            $entityPersister->loadById($identifier, $object);
        }
    );

    foreach ($identifier as $idField => $value) {
        // code "unabstracted" for easier understanding
        $classMetadata->getReflectionProperty($idField)
            ->setRawValueWithoutLazyInitialization($proxy, $value);
    }

    return $proxy;
}

It creates a lazy ghost with an initializer that calls EntityPersister::loadById to fetch from the database and load all values into the proxy object.

The identifier properties of the object are already set to their known values. This way, accessing them does not trigger the initialization of the object.

In the following example, the User of the Post is only loaded when User::$name is accessed:


$post = $entityManager->find(Post::class, 1);

echo "Post Id: " . $post->id . PHP_EOL;
echo "Message: " . $post->message . PHP_EOL;
echo "Author ID: " . $post->author->id . PHP_EOL;

// lazy loading of Post::$author is triggered only when Author::$name called
echo "Author Name: " . $post->author->name . PHP_EOL;

How cool is that?

The best part is going to be, that as a next step Doctrine can implement partial objects in a way that they can load the rest of the properties when they are accessed. This will unlock marking properties as lazy, for example very large binary or content objects (blobs, clobs) that should not be loaded with an entity automatically.

Hungry for more insights on PHP performance, operations and debugging topics? Sign up for our newsletter.

Suffering from a slow web application and scratching your head as to why? Our PHP Profiler can help you out. Start a 14 day trial to get effortless performance insights from us, tailored to your application problems.

What is the best value for max_execution_time in PHP?

By default PHPs maximum execution time is set to 30 seconds of CPU time. Since your webserver has a maximum limit of requests it can handle in parallel, this leads to an interesting question or performance and webserver throughput.

Is the maximum execution time of 30 seconds too large or too small?

In general: Yes, we recommend to decrease max_execution_time to the range of 5 or 10 seconds. But like so often, there is no one size fits all solution.

Why does everyone lean to increase max_execution_time though? If you search for this configuration on Google and YouTube you find posts that discuss exclusively how to increase it without talking about the implications.

The use-case is often that a single page starts to run into the execution time limit and the easiest option is to increase the global limit across all PHP processes and pages: Its just a quick configuration change after all.

If your webserver is near its limit of concurrent requests, a script taking 30 seconds can block 300 fast requests that only take 100ms and lead to HTTP 503 errors sent from the webserver or queueing delays. The available throughput per minute decreases massively for your given amount of PHP processes if you allow long requests.

Impact of Slow Requests on Throughput

The following example shows the throughput difference for a hypothetical PHP setup with 3 parallel processes:

In the worst case a stampede of users accessing slow parts of your site clogs up the available PHP processes and other users get served with HTTP 503 Service unavailable errors.

These conflicting scenarios show that a differentiated view is propably the best approach by configuring the max_execution_time differently for different endpoints and request types.

Strategies to safely allow high max execution time scripts

There are a few strategies to address the competing constraints of decreasing the max_execution_time in general, and allowing some scripts to have longer run times.

  1. Set max_execution_time just for a single or few pages.
  2. Use multiple PHP-FPM pools with different configurations
  3. Implement a waiting list or a locking mechanism that restricts slow scripts to run at most once in parallel.
  4. Offload slow work to a message queue

Programmatic Configuration based on Request

The max_execution_time INI setting can be changed at PHP runtime, so it makes sense to have a central place in your code-base that determines its value based on the request data (URL, method, for example):

<?php
// Symfony Http Foundation based example, also possible through $_SERVER
use Symfony\Component\HttpFoundation\Request;

$request = Request::createFromGlobals();

ini_set('max_execution_time', 5);

if ($request->getMethod() === 'POST') {
    ini_set('max_execution_time', 10);
}
if (str_starts_with($request->getPathInfo(), '/admin')) {
    ini_set('max_execution_time', 15);
}

Example: max_execution_time on Tideways app

We recently came across this problem in Tideways, where a small number of relatively unimportant reporting requests jammed the many important short API endpoints that accept data.

So there is no single perfect value, instead we solved this problem by applying the following heuristics when configuring our execution timeouts:

  1. Read requests (GET, HEAD) now have a lower default timeout, because they usually don’t cause inconsistencies when they are aborted by a timeout fatal error and usually make up a large amount of the apps traffic.
  2. Write requests (POST, ..) default to a higher timeout, to avoid inconsistencies when the request is aborted during the execeution.
  3. We measured the latency of all endpoints, especially 95%, 99% percentiles, the maximum duration and the number of requests to get a feeling for what the best default values could be. Tideways itself collects these values over larger timespans and per endpoint.
  4. We increased the timeout for endpoints that can take longer than the default timeout as long as they are low traffic endpoints. Otherwise we need to optimize their performance.
  5. We decreased the timeout for endpoints that are fast, but have a very high share of requests. These requests could quickly jam the webserver resources when their performance decreases.

These are pretty basic heuristics. There are more sophisticated solutions when you need to handle more complex timeouting cases that:

  1. If you have requests that are often slow and are still executed in high numbers, then consider executing them in their own PHP FPM pool with their own max number of parallel requests. This way they don’t affect other requests when requested in high numbers.
  2. If you have endpoints that could write inconsistent data, but you want to limit their execution time to a low timeout anyways, consider writing your own timeout logic to have full control about potential cleanup.
  3. Often slowness is caused by external services (HTTP) or databases (MySQL), in which case we would solve the problem by specifying client side timeouts that can be gracefully handled.

I will write about each of them individually in the next weeks. If you are interested make sure to sign up for the newsletter to get updated when the posts are published.

Using Composer Patches to fix Performance in Third-Party PHP Libraries such as Symfony ErrorHandler

Every so often, a careful profiling analysis of your application detects the bottleneck in third-party code and there is little remedy for you to override or change that code. In this blog post I want to present a solution to fixing performance problems in third-party libraries by using the composer patches plugin.

I use the the Symfony ErrorHandler as an example. Another example could be patching a performance bottleneck in Doctrine DBAL array parameter processing for an older version with the code from a newer version.

For certain applications that frequently trigger Symfony deprecations, this may result in a significant loss of response time, because it treats deprecations as a “strong error” that should not be silenced. For instance, in this Tideways trace from a Shopware store, a total of 18794 deprecations result in an additional response time of 699 ms:

ErrorHandler

An obvious first step would be to fix the code that triggers the deprecations, but here the Shopware core is triggering this deprecation itself. Shopware core is third party code that we cannot just change, especially when installed via Composer. The original code is installed over our changes on every Composer installation or update.

An issue to request a change in this policy to treat deprecations as errors that can never be silenced has been open for a while now. As usual, it’s not as easy for the developers of a framework to find a generic solution that works for them and everyone. 

We can intervene here by using the excellent cweagans/composer-patches library, which allows patching vendor code as a subsequent step after installing or updating dependencies. Install the library into your project: composer require cweagans/composer-patches:2.0.0-beta2

Composer Patches 1

Then we create a new file “patches/symfony_error_handler.patch” and add the following patch for symfony/error-handler:

diff --git a/ErrorHandler.php b/ErrorHandler.php
index c0af370..6b12da8 100644
--- a/ErrorHandler.php
+++ b/ErrorHandler.php
@@ -395,7 +395,10 @@ class ErrorHandler
         $level = error_reporting();
         $silenced = 0 === ($level & $type);
         // Strong errors are not authorized to be silenced.
-        $level |= \E_RECOVERABLE_ERROR | \E_USER_ERROR | \E_DEPRECATED | \E_USER_DEPRECATED;
+        $level |= \E_RECOVERABLE_ERROR | \E_USER_ERROR;
+        if ($this->debug) {
+            $level |= \E_DEPRECATED | \E_USER_DEPRECATED;
+        }
         $log = $this->loggedErrors & $type;
         $throw = $this->thrownErrors & $type & $level;
         $type &= $level | $this->screamedErrors;

I would always store the patch locally and avoid using the remote patch feature of this plugin for security reasons.

And modify the composer.json to include a reference to this patch like this:


{ 
    "_": "...",
    "extra": {
        "symfony": { "_": "..." },
        "patches": {
            "symfony/error-handler": {
                "Remove deprecated from strong errors": "patches/symfony_error_handler.patch"
            }
        }
    }
}

After this change, you can apply the patch by calling “composer patches-repatch”:

Composer Patches 2

From this point forward, the patch will be applied during every composer installation or update if the error-handler package changes.

Please be aware that this change effectively disables Symfony deprecation functionality unless the Symfony application is in debug mode.

An AI would never be able to dive this deep into technical topics surrounding PHP performance! Follow us on LinkedIn or X and subscribe to our newsletter to get the latest posts.

Let’s dive in and find out what is causing performance bottlenecks! Without Tideways, you’re likely to fish in murky waters attempting to figure it out. Try our free trial today and be enlightened.