Tideways 2025.1 Release
Product
For our first Release in 2025, we have cooked up more precise performance insights for you and can now, with Automatic Bottleneck Detection, serve you bottlenecks on a silver platter including recipes on how to fix them. Work on several improvements, like Native Worker Support in the PHP Extension, has kept us busy over the winter. A series of instrumentation improvements has chased away the winter blues and is now making way for a spring full of user-friendliness. We also present you with improvements to the Layer Monitoring and a new Notification Log. As part of the spring-cleaning, we renamed the traces that are compared with each other from Base/Target to Before/After. And that’s by no means all there is to report — dive head first in our Release and enjoy!
Summary:
Automatic Bottleneck Detection
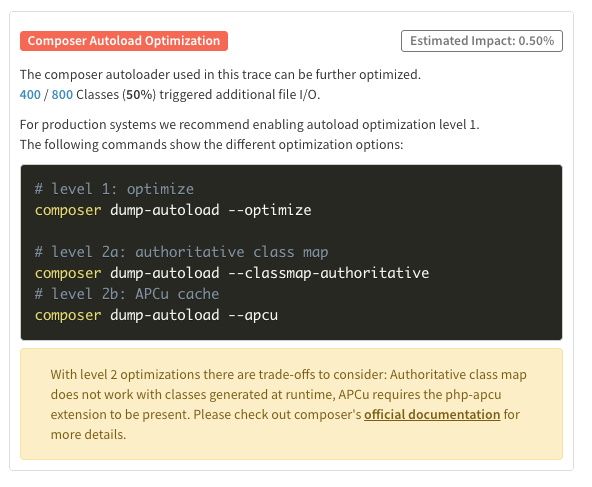
A profiling trace in Tideways has a lot of information across Timeline and Callgraph data, and finding bottlenecks usually means diving deep into this data. In the current Release, we introduce a more comprehensive automatic bottleneck detection that is based on the data from traces that we already collect. Instead of having to dig out the bottleneck from the profiling data yourself, if it’s a known problem, we can now show you both the bottleneck AND a solution recipe. Our goal is helping you accelerate bottleneck detection and troubleshooting.
With this foundation, we plan to add automated detection for even more bottlenecks specific to certain frameworks, such as Shopware, Symfony, or Magento. This customization will bring clarity more quickly, as it expedites the process of performance optimization by saving you the time-intensive search for solutions yourself.
So far, detected bottlenecks were displayed only in ‘Traces’ listed in the ‘Bottlenecks’ tab. Now, the bottlenecks will not only be way more detailed; they will also be aggregated to the service level and shown in ‘Observations’. You will get a complete overview in the observations tab and don’t need to sift through individual traces anymore.
Our new bottlenecks can also leverage Callgraph traces. So if you collect Callgraphs regularly, we will be able to gain even more insights into where your system is slowed down. Whilst we are expanding this feature, we incorporate everything we know about PHP performance into bottlenecks.
For now, we have added automatic detection for these new bottlenecks:
- Not using Composer Autoload Optimizations
- Using Symfony’s trigger_deprecation excessively
- Using Shopware’s CartPersister API incorrectly for a huge performance hit
- Blocking page views by using the Facebook Graph API to track Events
Native Worker Support in PHP Extension
Tideways now automatically detects transaction names for individual tasks executing within worker queues of Symfony, Laravel, Shopware 6, Magento, and WoltLab Suite.
In this Shopware 6 demo application, you can see the worker tasks individually monitored.
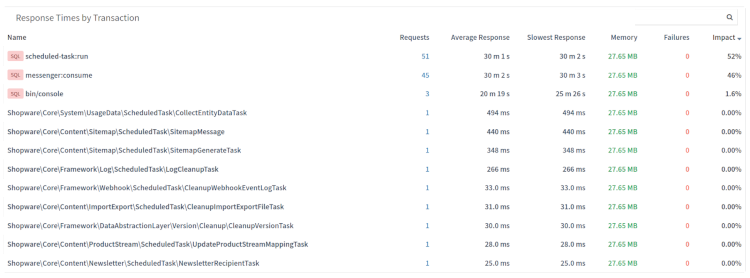
Native support for workers improves observability for requests that dynamically perform multiple independent (background) tasks with differing performance profiles.
Previously, Tideways would only detect the execution of a single long-running request, with the collected data and timeline showing the actions of all executed tasks. By automatically detecting the individual tasks and creating separate transactions, Tideways now can clearly attribute individual actions (e.g., SQL queries or HTTP calls) to the specific task, measure the failure rate of individual tasks and point out bottlenecks on a per-task basis. This also enables setting tracepoints on these individual tasks.
Besides the supported worker queues listed above, we also plan to add more generic support and other frameworks in the future.
Layer Improvements
Additional Layers
While Tideways can already account for much of the time in a request when looking at our performance chart, there is still more to cover. With the following new layers, we can now provide an even more fine-grained summary of where the time is spent processing a request.
As a result, there is less ‘Unaccounted Wait’ because more time spent waiting can be accounted for; that means more time is assigned to actionable layers.
The layers are displayed in the averages chart in the performance section and in each trace (see layer report):
- Waiting For CPU
- Sleep
- DNS
- Shell
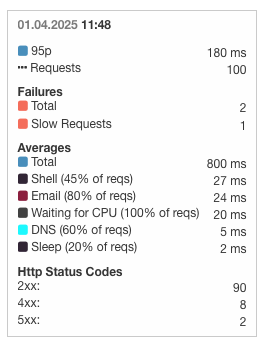
New Layer: Waiting for CPU
One of the Additional Layers is ‘Waiting for CPU’. It indicates the time spent waiting for the operating system’s scheduler to free up a CPU core to continue processing the request. It provides an indication that particular requests are experiencing delays in processing that are not necessarily caused by the request itself, but insufficient hardware resources or other processes, such as a database running on the same server, performing computationally expensive processing.
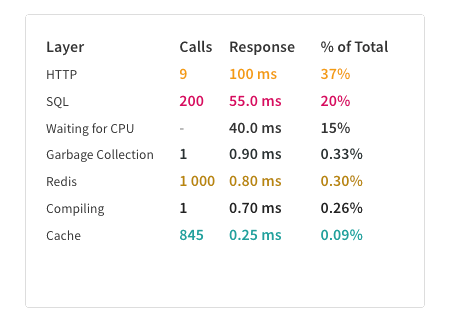
Layer Report: a high-level breakdown of your traces
The first thing you see when you open a trace now is a complete, detailed layer report, a breakdown of all the layers that contributed to the total time of that trace.
Improved Layer Collection
As part of the improvement of the layer functionality, we did not just add additional layers and improved the UI, we also cleaned up the technical basis that collects the layer information within the Tideways extension.
As a result, the collected data is more precise. For example, async HTTP requests using CurlMultiHandle now measure the time that is spent processing the retrieved data.
Previously, the entire time from sending the request until the full response is received was measured, which would consider the sum of the runtime of parallel requests, exceeding the actual time spent blocking.
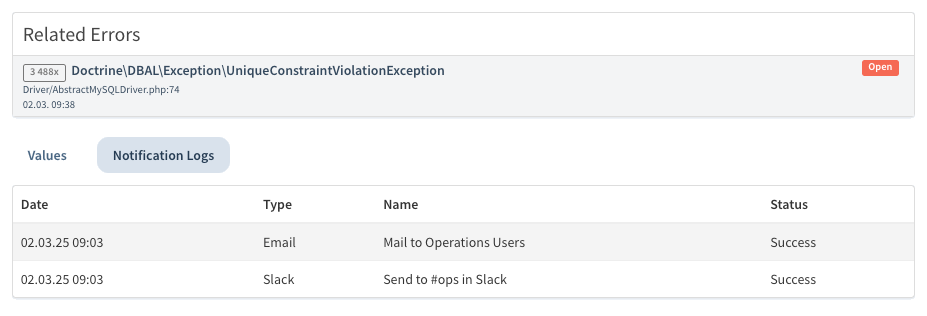
Notification Log
We added a new ‘Notification Log’ for Errors/Exceptions, Incidents, and Releases. For each of these events, users can now view the date and time of the notifications and through which channel, e.g. Slack or email, they were notified.
session_write_close() in Timeline
Tideways will now indicate with a timeline marker when session_write_close() is used, indicating the time the session is unlocked. This can help other requests to go on without further ado.
When using PHP’s integrated session functionality, sessions are automatically locked for concurrent access while they are in use by a request to prevent race conditions. As a result, requests using the same session are blocked until previous requests finish. When no additional modifications to the session data need to be made, for example in read-only requests, the session_write_close() function can be used to write the updated session data and unlock the session, allowing other requests to proceed without waiting for the request to finish. Similarly to the existing marker for fastcgi_finish_request().
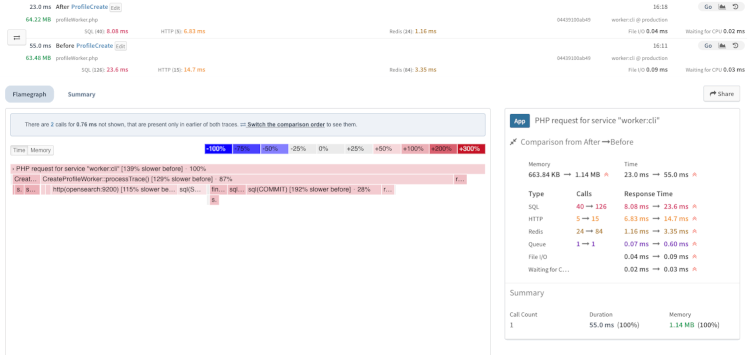
Trace Comparison: Base/Target is now Before/After
Previously, we used ‘Base’ and ‘Target’ as names for two traces that were to be compared with each other. This technical reference has now been altered in favor of a temporal perspective. Using ‘Before’ and ‘After’, the naming is now solely based on the chronological order of both traces. ‘Before’ for the older trace and ‘After’ for the newer one. Regardless of the comparison direction, the traces retain their names. It can be Before ⇒ After or After ⇒ Before.
Why do two traces differ in speed? By comparing them, you can detect why. A comparison of two traces can also make optimizations visible. Does the change I initiated make a difference, regarding speed? This question can be answered by making use of the trace comparison.
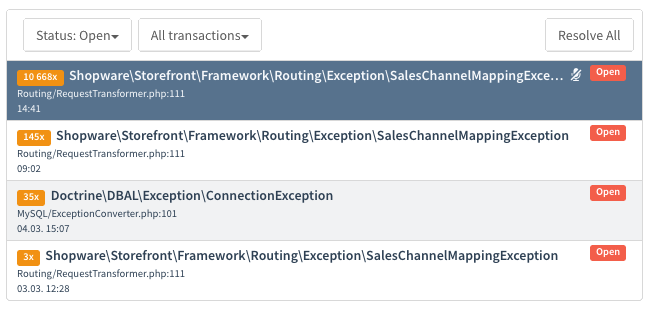
Show muted errors in the UI
The action ‘Don’t Notify’ for Errors/Exceptions was renamed to ‘Mute’ or ‘Unmute’, and in addition you can now see this in the UI with the crossed-out microphone icon.
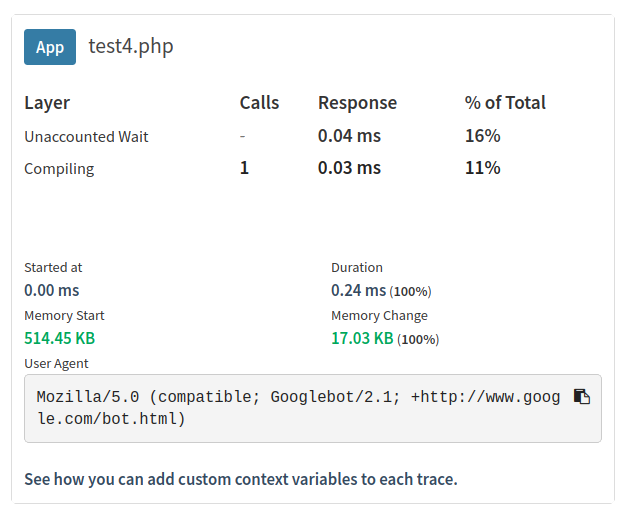
Keep User-Agent for crawlers in trace metadata
Since Tideways Release 2024.3, Tideways recognizes requests performed by crawlers and adds a ‘Crawler’ tag. For requests tagged ‘crawler’, the full User-Agent will be available on the root span of a trace, allowing you to take action if an undesired crawler makes excessive requests to expensive routes.
Instrumentation improvements
As always, this Tideways Release includes a number of assorted improvements and bug fixes to the existing instrumentation functionality.
- The experimental MongoDB instrumentation added in Tideways 5.7.0 replaces the old MongoDB instrumentation as of 5.15.0. The new instrumentation is more reliable and provides better insights into the commands used.
- Each MongoDB command span now has
peer.hostandpeer.portannotations, indicating the exact server the command was sent to. Themongo.serviceannotation on the “connect” span was removed, since the MongoDB client dynamically detects the cluster topology, making this information misleading. - MongoDB: Logical conjunctions, such as
['field' => ['$gt' => 0, '$lt' => 10]]are now correctly reported in themongo.filterannotation. - HTTP requests performed using cURL multi now unconditionally collect a stack trace when calling
curl_multi_add_handle(), pointing towards the location where the request is actually initiated, instead of thecurl_multi_exec()event loop. - Collect Shopware DAL spans in the EntityRepository instead of the EntitySearcher to catch more cases.
- A new
swdal.criteria.titleannotation is available on Shopware DAL spans, containing the result ofCriteria::getTitle(). - The instrumentation for
colinmollenhour/credis, which amongst others, is used by Magento now supports thetideways.features.redis_keysfeature. - Add the
cachedtag to pages returned from Magento’s page cache. - Add automated service detection for WoltLab Suite’s ACP.
- Symfony Messenger transactions now include a span for each message handler.
- Improve Callgraph for Doctrine, by disambiguating calls to
UnitOfWork::createEntity(), allowing to measure hydration performance per entity type. - Instrument Symfony’s ErrorHandler component, allowing to see Exceptions handled by it in Tideways.
You can see these changes listed by PHP extension version on the changelog page.
Time to get started with Profiling! With our free trial.
About the author

I’m a Content and Marketing Manager at Tideways, where I focus on content marketing, community building, and developer-focused communication. I enjoy turning complex technical topics into engaging content and creating meaningful connections within the PHP ecosystem.
As a passionate content creator and published author, I believe that great content starts with curiosity, authentic stories, and a genuine interest in the people behind them. Whether I’m working on marketing campaigns, building communities, or writing, I enjoy thinking outside the box and finding creative ways to engage and inspire others.