Posts

Use timeouts to prevent long-running SELECT queries from taking down your MySQL

You may be wondering if your users can slow down or even DOS your MySQL database with an unlucky request. If it contains just the wrong number of conditions in your advanced search form triggering a full table scan on a dataset that is much larger than you have anticipated they probably can.

If you provide advanced search, aggregated statistics, reporting or data export functionality in your application, then the occasional long running query is part of the design. You may not have suffered database overload and slowdowns yet, only because your users aren’t constantly using these features.

Up until MySQL 5.7 you had no easy way to protect yourself from large amounts of users DDoSing your database with long running queries. In addition the PHP max_execution_time does not apply to waiting for network calls as shown in this previous blog post on max_execution_time. This means your PHP scripts and MySQL connections can be blocked as long as a query runs, worst case for several minutes or hours.

When you Google this problem, the recommended solution is running a daemon or cronjob that monitors the process list and just kills the long-running queries. This certainly works, but you don’t know who is running the query and why, which prevents you from applying more fine granular timeouts based on the context (web vs. background process for example).

With MySQL 5.7 you can now use a new optimizer query hint to configure the max execution time of SELECT queries in milliseconds.

SELECT /*+ MAX_EXECUTION_TIME(1000) */ status, count(*) FROM articles GROUP BY status ORDER BY status; 

Or you can set a session-wide or global timeout:

SET SESSION MAX_EXECUTION_TIME=2000; SET GLOBAL MAX_EXECUTION_TIME=2000; 

The timeouts only apply to read-only SELECT queries.

If your query takes too long, it fails with the following error:

ERROR 3024 (HY000): Query execution was interrupted, maximum statement execution time exceeded 

You can handle this error centrally in your application and display a message to users that the response took too long and was aborted.

Using an Exception Tracking software (such as Tideways) you can log which users, transactions or pages are causing these queries to get aborted, how often they happen and if the query performance can be improved.

View the code context for the stack trace of exceptions/errors

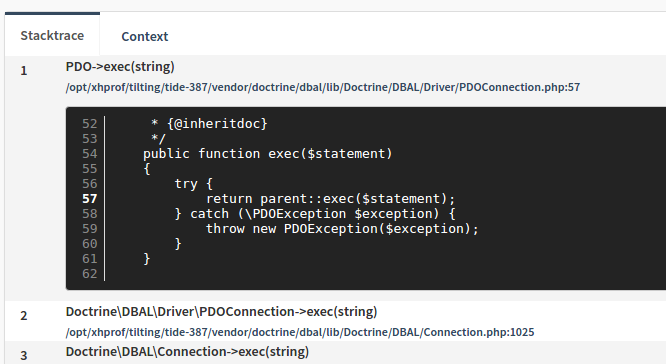
We have released a new opt-in feature that allows the collection of code around every part of an error/exception stack trace. This feature is disabled by default. When enabled the Tideways daemon stores 10 lines of code around each step in the stack trace of an exception or fatal error.

You can enable this setting in the “Application Settings” screen for every application that supports Error/Exception tracking. It requires a tideways-daemon in version 1.5.4 or higher to take effect.

Sending code along to Tideways is tricky and for security reasons we strip the contents from single- and multiline string literals, herdocs and nowdocs directly on the daemon before sending them to us. Inconclusive blocks are completly ignored and never sent to our servers.

Improved History View, Traces including Server Metrics

After a slow December of vacation and holidays we are slowly picking up steam again and are releasing the first new features of 2017 with an improved history and server metrics for traces.

History

The historical performance data that we collect for your application has been well hidden until now and was reached by clicking on links in the weekly report e-mail. Starting today, the history is more prominent and includes more features and data.

We have now enabled the “slim history” that is directly visible from the application overview and shows you the performance from Yesterday, Last Week and Last Month for comparison.

When you follow the links to the history view, then you can now see a more dynamic chart of the performance data and a new histogram that shows the full response distribution.

In addition to the weekly report you can now also view the historic data by day or month. Just use the select dropdown to toggle between the different views.

Server Metrics for Traces

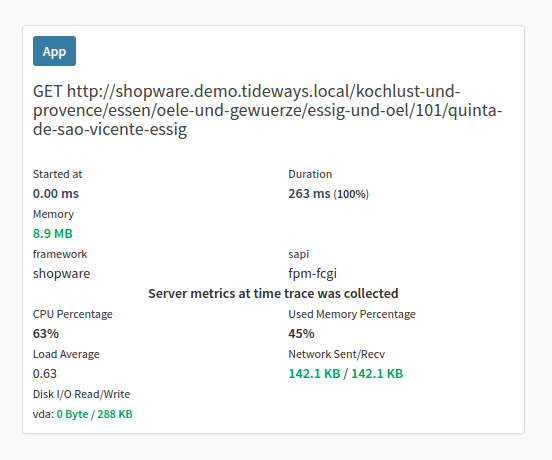
The latest version of the Tideways daemon now collects server metrics on CPU load, memory, I/O and disk usage during the execution of the trace. This information can be viewed directly from the trace details by looking at the main timespan details box on the right.

Using HTTP client timeouts in PHP

Timeouts are a rarely discussed topic and neglected in many applications, even though they can have a huge effect on your site during times of high load and when dependent services are slow. For microservice architectures timeouts are important to avoid cascading failures when a service is down.

The default socket timeout in PHP is 60 seconds. HTTP requests performed with for example file_get_contents, fopen, SOAPClient or DOMDocument::load are using this timeout INI setting to decide how long to wait for a response.

Since the socket/stream wait time is not included in PHPs max execution time you are in line for a surprise when requests take up to 30+60=90 seconds of your webservers precious processing queue before getting aborted.

Timeouts are scary, because you don’t know in what state you have left an operation when aborting. But in case of HTTP requests it is usually easy as a client to decide what to do:

  1. Abort my own request and show the user an error
  2. Ignore the timeout and just don’t display the data
  3. Retry (a maximum of 3-5 times for example)

And configuring timeouts has other upsides:

  • If the target server currently has load problems, then aborting with a timeout early could reduce the servers load enough to automatically recover at some point.
  • You can show users an error quickly and they don’t have to wait several seconds only to be taunted by an error page.

Setting the default timeout

Before doing anything else, you should decrease the default timeout early in your code to a value between 5 and 10 seconds:

<?php

ini_set("default_socket_timeout", 10); 

You should check your monitoring system (for example Tideways) for clues what a regular HTTP call duration is for calls to internal or third party systems.

If you have many different internal or third-party services in place, then it makes sense to configure individual timeouts based on their usual latency.

A thorough setup defines maximum limits for each internal and third party service and then encodes them in HTTP calls.

Configuring the timeout for individual file_get_contents/fopen calls

In stream based calls you can configure individual timeouts using stream contexts. This applies to for example file_get_contents and fopen:

<?php

// timeout of one second 
$context = stream_context_create(array('http' => array(
     'timeout' => 1.0,
     'ignore_errors' => true,
)));

$data = @file_get_contents("http://127.0.0.1/api", false, $context);

if ($data === false && count($http_response_header) === 0) {
     // request timed out, because $data is false even though we ignore
     // errors and we dont have response headers 
} 

Be aware that the timeout handling of streams seems not very accurate and requests can still take longer than you configured, especially when you go below 1 second.

Configuring the timeout for DOMDocument::load

In general you should not use the DOMDocument::load function to load remove XML or HTML. To allow for better error handling code it’s easier to use a HTTP client directly and then load with loadXML. But if you must use it or some library does, you can configure timeouts with stream contexts again in this way:

<?php

// timeout of one second
$context = stream_context_create(array('http' => array('timeout' => 1.0)));

libxml_set_streams_context($context);

$document = new DOMDocument();
$document->load('http://127.0.0.1/xml'); 

This affects all HTTP calls that PHP does through libxml.

Configuring the timeout for SOAPClient

The SOAPClient class does not use the PHP stream API for historical reasons. This means that timeout configuration works slightly different. Setting the timeout parameter in SOAPClients stream context does not work.

Instead you can either set the connection_timeout setting that handles timeouts before the connection was established or directly set default_socket_timeout in the code using ini_set. The only other way is to overwrite SoapClient::__doRequest method to use cURL.

<?php

ini_set('default_socket_timeout', 1);
$client = new SOAPClient($wsdl, array('connection_timeout' => 1));

try {
     $client->add(10, 10);
 } catch (SOAPFault $e) {
     if (strpos($e->getMessage(), 'Error Fetching http headers') !== false) {
         // this can be a timeout!
     } 
} 

Configuring the timeout for cURL extension

If you want to have more control about HTTP requests than with PHPs built in stream support there is no way around the cURL extension.

We have much better timeout control with cURL, with two settings: one for the connection timeout and one for the maximum execution time:

<?php

$ch = curl_init('http://127.0.0.1/api');
curl_setopt($ch, CURLOPT_TIMEOUT, 2); 
curl_setopt($ch, CURLOPT_CONNECTTIMEOUT, 1);

$response = curl_exec($ch);

if ($response === false) {
     $info = curl_getinfo($ch);

    if ($info['http_code'] === 0) {
         // timeout
     } 
} 

If you want to be more strict and abort on a millisecond level, then you can alternatively use CURLOPT_TIMEOUT_MS and CURLOPT_CONNECTTIMEOUT_MS constants, but the manual warns that this might still only be checked every full second depending on how cURL was compiled and setting a value below one second usually requires to ignore signals with curl_setopt($ch, CURLOPT_NOSIGNAL, 1); to avoid an immediate timeout error.

One important thing to remember is cURL has an indefinite timeout by default and does not obey the default_socket_timeout INI setting. This means that you have to configure the timeout in every cURL call in your code. With third party code this might even be complicated or impossible.

Seperate your slow backend from the important frontend traffic with PHP-FPM

If you are using Magento, Shopware, Oxid, a CMS or any other off the shelf software, then usually they ship both the frontend and the backend in a single application. For self-developed applications with Symfony or other frameworks this is often the case as well.

The backend/admin may then include several slow reporting, administrative operations and data exports that can take a long time. This could congest the webservers processing queue by lowering the throughput for your customers that might just click on the checkout button and see a 502 Gateway error. We described this behaviour in the last blog post on What is the best value of PHPs max_execution_time?.

Putting frontend and backend on different servers is one solution, but this can be to costly for most use-cases.

A simple solution for this problem is using different PHP-FPM pools for the frontend and backend, each with their own configuration for the maximum number of allowed requests. This is also a solution for some of the problems discussed in the post on “What is the best value for max execution time?”.

Magento Admin and Frontend Example

How does this look like? Lets use Magento as an example, you can configure two pools in php-fpm.conf:

; php-fpm.conf [frontend] listen = /var/run/php-fpm-frontend.sock pm = static pm.max_children = 50

[backend] listen = /var/run/php-fpm-backend.sock pm = ondemand pm.max_children = 5 pm.process_idle_timeout = 5 

The frontend is configured for maximum of 50 simultaneous requests and the backend for a maximum of 5 simultaneous requests. The backend workers are created on demand and the frontend workers are static to avoid forking overhead. I will discuss the differences between PHP-FPM pool configurations in a future blog post.

You can then modify the Nginx vhost configuration for the Magento installation with the following switch:

server {     // ....

    set $fpm_socket "unix:/var/run/php-fpm-frontend.sock";

    if ($uri ~* "^/admin/") {
         set $fpm_socket "unix:/var/run/php-fpm-backend.sock";
     }

    location ~ .php$ {
         // ...

        fastcgi_pass $fpm_socket;
     } 
} 

Based on the ^/admin path in the request uri it will select the different PHP FPM pool now and frontend and backend will not compete and steal each other resources anymore.

Slow Ajax requests in your Symfony application? Apply this simple fix

If you are using Sessions in PHP (the odds are very high) then you should know that write and read access to them is using pessimistic locking which means no two requests can run in parallel with the same session open.

Our blog post on Essential PHP Performance Optimizations mentioned blocking Sessions as one very common problem for performance in PHP applications. Multiple concurrent Ajax requests will wait for each other and make your application much slower than it must be.

The fix for this in pure PHP is to call session_write_close(), but in your Symfony 2 or 3 application this function is hidden below abstraction layers or might even be implemented differently.

First, because this problem is mainly present for Ajax requests we start with a generic solution that hooks into the Symfony Kernel Events to perform its job.

  1. Wait until all kernel.request events are processed, specifically those loading the session and the user object from it.
  2. Execute a listener as one of the last in kernel.request that checks if the Request is an Ajax request and if yes, calling to close the session.

EventListener that auto-closes Session on Ajax Requests

Here is a generic event listener that performs these steps:

<?php

namespace AcmeAppBundleEventListener;

class AjaxSessionCloseListener
{
public function onKernelRequest(GetResponseEvent $event)
{
$request = $event->getRequest();
if (!$request->isXmlHttpRequest()) {
return;
}
if (!$request->attributes->has('_route')) {
return;
}
$session = $request->getSession();
$session->save();
}
}

This listener must run after Symfony’s internal SessionListener and RouterListener so that the session object and current route name are available. The following XML service tag definition therefore includes a priority for the kernel.event_listener:

<service id="app.ajax_session_close_listener" class="AcmeAppBundleEventListenerAjaxSessionCloseListener"> <tag name="kernel.event_listener" event="kernel.request" priority="-255" />
</service>

Or if you prefer YAML:

services: app.ajax_session_close_listener: class: 'AcmeAppBundleEventListenerAjaxSessionCloseListener' tags: - { name: "kernel.event_listener", event: "kernel.request", priority: -255 }

And you are good to go!

Before you roll this out: Are you sure all your ajax requests never write to the session? CSRF protection in Symfony Forms for example writes to the Session. If you have one or two controllers that are called with Ajax and do write to the sesison, then you should implement a blacklisting mechanism based on route names or you could introduce special _ajax_write attribute in route defaults and check for it in the Listener.

How to implementing cache tagging with APC or Memcache without hurting performance

Cache tagging first appeared on my radar when I started working on Doctrine ORM in 2009 and the idea sounds extremely useful in theory. With cache tagging, cache entries can be grouped together under tag names, which then allows to simply invalidate all items with the same tag.

But When the Doctrine 1 team released cache tagging as a list of all members with a tag, suddenly users saw extreme slowdowns in their apps. For various reasons it is a mistake to introduce a cache key that is read and written to from essentially every request of the application, because it can cause massive performance problems when too many items are part of the same tag.

To guarantee consistency, caches use locks when they are being written to. If the same key is being written to at a very high rate, this can lead to considerable slow downs beause of locks. Another problem is the serialization overhead when cache tags contain a large amount of items.

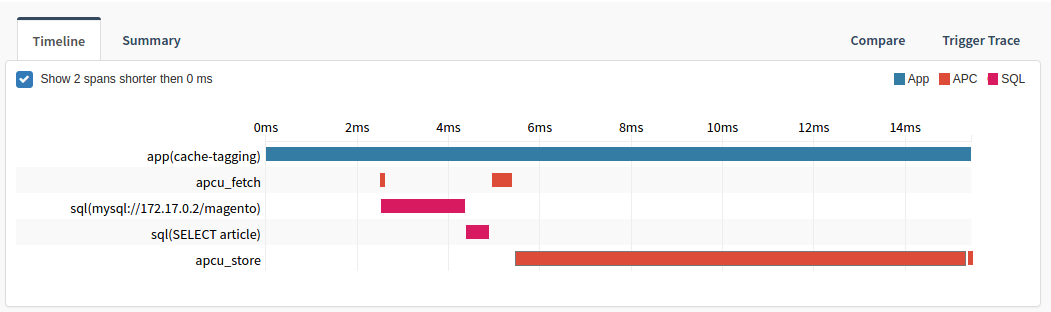
See this Tideways timeline with cache tagging using APC over 40.000 items with a shared key. The long apcu_store timespan of 10ms is the cache key being written.

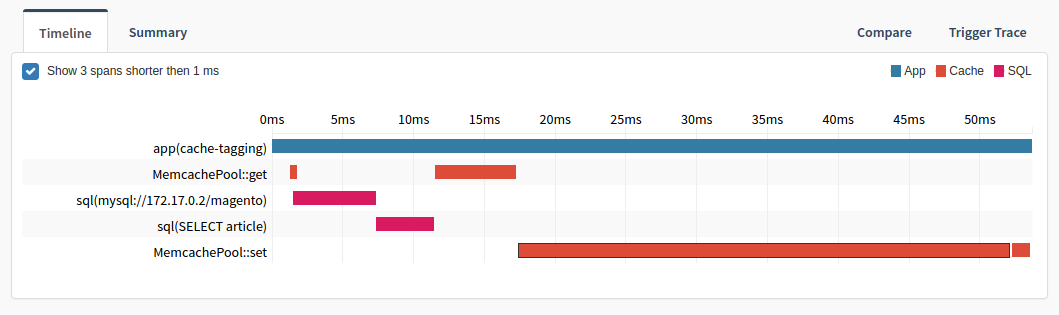
This effect is much worse when using Memcache, because it has to serialize the list of keys where APCu just copies the memory. in the same case of 40.000 items with a shared key it takes 5ms for MemcachePool::get and 34ms for MemcachePool::set to access and update the shared tagging cache key:

Naturally in Doctrine 1 the feature was immediately removed and we never reintroduced it back into Doctrine 2.

But even today many cache tagging implementations built on top of APCu or Memcache suffer from this problem and you should carefully evaluate them before use. Be wary about libraries that don’t explain how their cache tagging works internally. Only backends with second level indexes (Databases, Riak, Mongo) or sophisticated datastructures (Redis) are suitable for implementing efficient cache tagging.

So please remember, before using cache tagging as a quick fix for your cache invalidation problems: Without the right cache backend and a special purpose implementation for tagging you will quickly suffer from bad performance that you wanted to fix with caching in the first place..

There is one way to get it right, without heavy writes and serialization overhead. The Laravel cache implements this approach by storing a unique id for every cache tag and then prefixing the key of items in this tag with this unique id. To invalidate all items in a cache tag you must just regenerate the unique id and all the old cache keys are not accessed anymore. A simple reimplementation in APCu looks like this:

<?php

function apcu_tagged_store(array $tags, $key, $value, $ttl = 0) {
     return apcu_store(apcu_tags($tags, $key), $value, $ttl); 
}

function apcu_tagged_fetch(array $tags, $key, &$success) {
     return apcu_fetch(apcu_tags($tags, $key), $success); 
}

function apcu_tags(array $tags, $key) {
     $ids = [];

    foreach ($tags as $tag) {
         $ids[] = apcu_entry("tag_" . $tag, function ($key) {
             return uniqid('', true);
         });
     }

    $ids[] = $key;

    return implode('|', $ids); }

$article = ['id' => 100, 'category' => 20, 'text' => '...'];

apcu_tagged_store(['articles', 'category_20'], 100, $article); 
$article = apcu_tagged_fetch(['articles', 'category_20'], 100); 

Explaining the apcu_tags function: It generates a unique key for every tag and concatenates them all as a prefix for the actual cache key. Then if you invalidate one of the tags, all the cache entries with this tag get regenerated on the next access.

PHP Session Garbage Collection: The unknown performance bottleneck

Here is one performance setting in your PHP configuration you probably haven’t thought about much before: How often does PHP perform random garbage collection of outdated session data in your application? Did you know that because of the shared nothing architecture PHP randomly cleans old session data whenever session_start() is called? An operation that is not necessarily cheap.

By default this happens every 100th request, because of the following php.ini variables settings session.gc_probability=1 and session.gc_divisor=100. But you can not just look at the defaults of these settings in your application to see what is going on. Some distributions change the cleanup mechanism, for example Debian/Ubuntu flavored PHP versions set session.gc_probability=0 and use a cronjob to cleanup old session data. However, frameworks then usually overwrite everything anyways and force a reset of the INI settings themselves (Symfony) or implement their own session entirely (Laravel).

My general advice is to avoid PHPs random garbage collection altogether and offload the cleanup to either background jobs or the system used for storage. Be careful about this “general advice”, the implementation highly depends on the individual storage system and type of session save handler.

Example: Laravel Framework

Let’s look at the Laravel framework as an example, where I find a lot of performance advice is about changing the session driver. By default file based sessions are used in Laravel with a configured garbage collection ratio of every 50th request.

When Laravel triggers Session garbage collection the following code is called for the file-based session:

public function gc($lifetime) {
     $files = Finder::create()
                 ->in($this->path)
                 ->files()
                 ->ignoreDotFiles(true)
                 ->date('<= now - '.$lifetime.' seconds');
     foreach ($files as $file) {
         $this->files->delete($file->getRealPath());
     } 
} 

If you know a little about Symfony Finder component, then you know that it is comparatively slow operation instead of directly using Linux commands such as the special purpose bash script sessionclean that Debian/Ubuntu ship with.

The problem: With more active users and therefore more active sessions in your application session cleanup gets slower because it has to iterate over more files. And when you have this much traffic on your application, then cleaning every 50th request can happen multiple times every second. If you are measuring performance using percentiles (which you should), then the 99% percentile will always negatively affected by one or two requests that cleaned up the session.

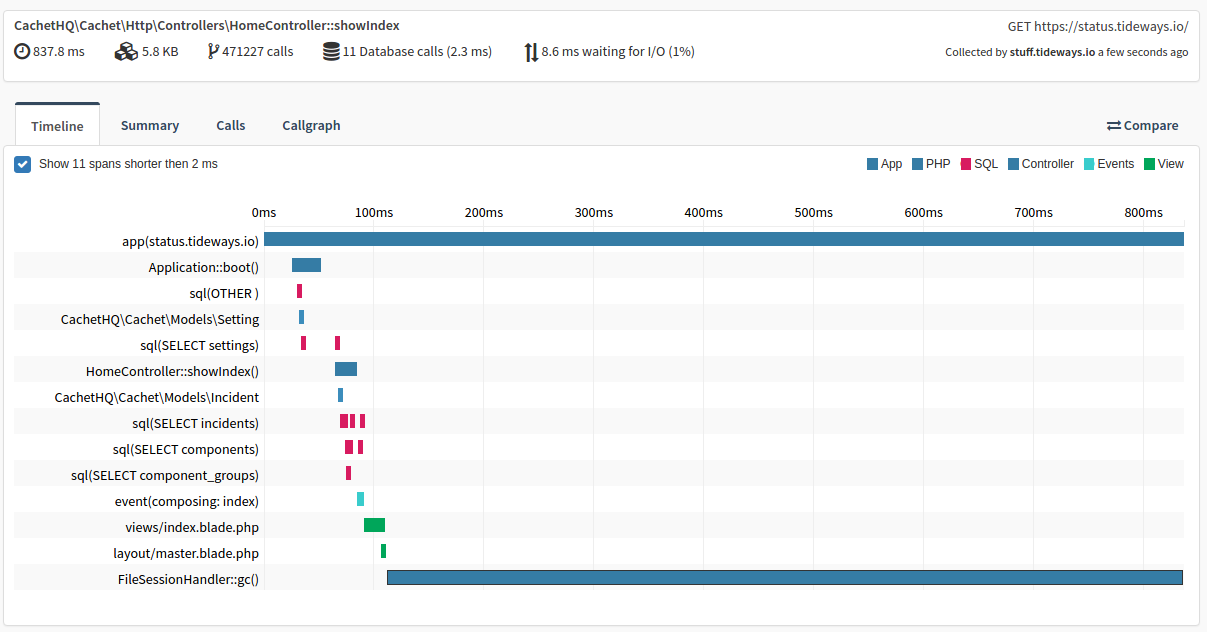
Take a look at this Tideways trace of our own status page (provided by Cachet) where the Laravel Garbage Collection is triggered to cleanup a folder of 10.000 file-based sessions:

As you can see this takes the majority of the whole request (a whooping 723ms of 837ms, 87%!). Even if you have less active session, this is still very high performance penalty given it happens every 50th request.

Offload Session Garbage Collection

Instead of slowing down a random sample of your users requests with session garbage collection, you should offload this to a cronjob that is called a single time in regular intervals.

For Laravel this means changing the lottery configuration in config/session.php to:

<?php

return [     // ...     'lottery' => [0, 100], ]; 

You then need a cronjob that calls ./artisan session:gc with the following command code:

<?php // app/Console/Commands/SessionGcCommand.php

namespace AppConsoleCommands;

use IlluminateConsoleCommand; use IlluminateSupportArr;

class SessionGcCommand extends Command 
{
    protected $signature = 'session:gc';

    public function handle()
     {
         $session = $this->getLaravel()->make('session');
         $lifetime = Arr::get($session->getSessionConfig(), 'lifetime') * 60;
         $session->getHandler()->gc($lifetime);
     } 
} 

Don’t forget to register this in app/Console/Kernel.php.

If you absolutely have to use PHP based cleanup, then adjust the probability based on your applications traffic to be triggered every 5-10 minutes by increasing the second number of the lottery. For example if you serve 1000 requests per minute, then the right setting could be 1 out of 1000 requests.

<?php

return [     // ...     'lottery' => [1, 1000], ]; 

The same logic applies to Symfony, where the native session is configured to cleanup every 100th request by default. You can disable random cleanup during PHP requests with the Native session handler by setting the following configuration:

framework:     session:         gc_probability: 0         gc_divisor: 100 

The Symfony garbage collection command to be called with ./app/console session:gc from a cronjob would look like this:

<?php

namespace AppBundleCommand;

use SymfonyComponentConsoleInputInputInterface; 
use SymfonyComponentConsoleOutputOutputInterface; 
use SymfonyBundleFrameworkBundleCommandContainerAwareCommand;

class SessionGcCommand extends ContainerAwareCommand {
     protected function configure()
     {
         $this->setName('session:gc');
     }

    protected function execute(InputInterface $input, OutputInterface $output)
     {
         $session = $this->getContainer()->get('session');
         $session->start();

        $storage = $this->getContainer()->get('session.storage');
         // if you configure "framework.sessions.gc_maxlifetime" it will set the ini var
         $storage->getSaveHandler()->gc(ini_get('session.gc_maxlifetime'));
     } 
} 

What about non file-based session storages?

If you store sessions in the database, then you still need the cleanup via cronjob as described in the previous section. The session tables in Laravel and Symfony, and probably in every other framework contain some form of lifetime timestamp that can be used to delete old sessions.

For cache based session handlers based on Memcache or Redis you can rely on the cache time-to-live (TTL) instead, which makes explicit garbage collection obsolte. Symfony and Laravels implementations of these caches have a no-op garbage collection method, calling it will do nothing.

This is the reason why even with a session.gc_probability set to a high value, the cache based drivers never cause any performance overhead in PHP requests and users might be mislead by this when performing benchmarks of different session configurations.

Conclusion

Take some time to learn about your frameworks approach to session garbage collection and if you don’t use a framework, see the PHP documentation on how native session GC works.

PHP 7 Release of Tideways

We are happy to finally release the first PHP 7 compatible version of Tideways after several months of beta testing with customers and open-source users. A new version of the extension has been released with the major version 4.0.3 that works on Linux for now. We are still working on publishing releases for Mac and Windows platforms in the next days. You can find binary downloads as Tarball, Debian, RedHat and Homebrew packages or the source code in the master branch of our repository on Github.

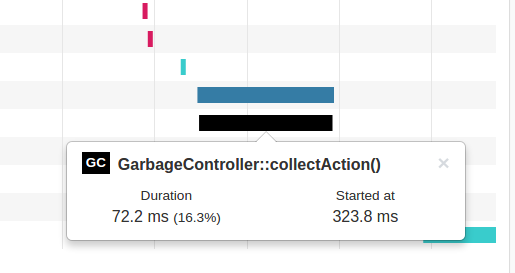
On top of the work we did porting the extension for PHP 7, there is also a new feature that we could implement, based on the Turn gc_collect_cycles into function pointer RFC that I have successfully proposed into PHP 7 together with Adam Harvey. Our Timeline Profiler now shows timespans for Garbage Collection and the function context they occur in, like the black span in this timeline trace:

The Tideways extension also serves as a replacement for XHProf callgraph profiling and has a compatible API and output format, you can use this extension outside our product to profile your PHP 7 applications with one of the many open-source UIs.

With this release, we are happy to finally support you monitoring, tracing and profiling your PHP 7 applications and are looking forward to users putting this into production. Happy tracing!

5 Ways to optimize Symfony Baseline Performance

We will continue our performance series with Symfony (previously on Doctrine ORM and PHP). This blog post describes some of the fundamental aspects that affect Symfony performance at the core of HttpKernel request lifecycle. These complement the Symfony Performance docs, which mentions general tips such as Bytecode Caching and Autoloader Optimizations.

Even though Symfony is consistently listed as one of the slower PHP frameworks in many simple hello world benchmarks (most notably Techempower) you can build scalable and performant applications with it. The trick is to keep the baseline performance of your application as small as necessary.

The five influences in this blog posts are by no means the only thing you can look for in Symfony applications, but they are important.

Disclaimer: There is no black and white in these suggestions, they will always affect the performance of your application no matter what. This blog post wants to make you aware of the influence. As a result you get a checklist of potential optimization spots that are usually hard to find in a Profiler when you don’t know what you are looking for.

1. Expensive Service Construction

There are a number of mistakes with services in the dependency injection container that can negatively impact performance. Your performance baseline with Symfony is affected by how expensive instantiating event listeners and services is for the different events of the HttpKernel lifecycle: kernel.request, kernel.controller, kernel.view and kernel.response.

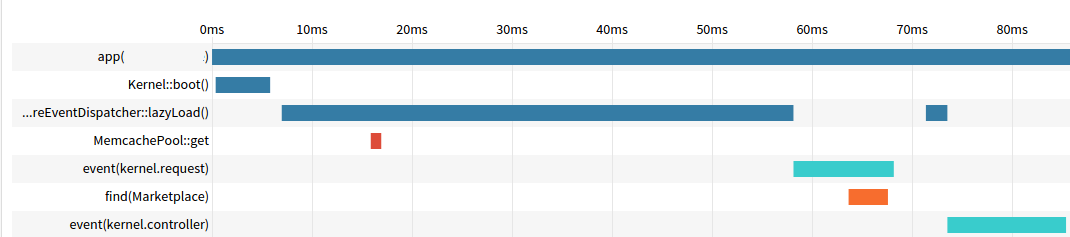
Symfony lazy loads all listeners and depending services inside the EventDispatcher. We can look at this method in a Timeline Trace and see how much time can be wasted in service construction. Here is an example from an application we monitor in Tideways:

Symfony Service Lazy Loading slows down applicationSymfony Service Lazy Loading slows down application

In this case about 51ms in ContainerAwareEventDispatcher::lazyLoad() is spent right before the kernel.request event is executed, which only takes 10ms itself. Something is clearly wrong in this application bootstrap code.

You should avoid the following traps when creating services in Symfony:

  1. The rule “Don’t perform work in the Constructor” is critical for Symfony, everything you do in a service constructor can potentially slow down every request of your application.If you use Doctrine Repositories as service and inject this into listeners, you already have this problem: Creating a repository service will unserialize ClassMetadata from the cache or even parse it.
  2. Services with deep layers of dependencies take a longer time to create. In the Symfony core, Security component is an offender of this trap, often when combined with the FOSUserBundle and more complex Firewall setups.
  3. Avoid injecting services into listeners that are not needed. For example, if you inject templating service somewhere into an EventListener it will get loaded in every request, which in turn loads Twig and every Twig extension that you registered. If your request is returning a JSON Response for an Ajax request this overhead is completely unnecessary.

Two ways exist here to remedy the problem:

  1. The old-school way is to only inject the Container into EventListeners and retrieve services from it when you need them. The downside of this approach is EventListeners are more difficult to test and maintain. The upside is that you don’t need code generation.
  2. Lazy Services were introduced in Symfony 2.3 to avoid injecting the container. This feature uses code-generation to create a proxy service and inject that instead of the real one. Once accessed the real service is loaded from the container.

Both ways work, but are only fighting the symptom: dependency mess. Fixing this is much harder to achieve though and out of your hand if you don’t want to replace third-party bundles.

In very fast Symfony Requests (~20-50ms) the Container::get($id) call is often the number one bottleneck. If you really need a very fast response and high throughput, you must work on optimizing service construction.

2. Slow Kernel Event Listeners

Now that we got through listener and service instantiation, the baseline Symfony performance can suffer from slow listeners that get executed in every request.

Avoid calling a database or external services in listeners, unless you absolutely need to and then restrict this calls to only those requests.

For example in Tideways we use the context pattern to pass state around through the application. The context object contains the organization and site you are currently looking at, the time resolution and more details. Knowing this listener is part of the critical path, we optimized the queries it executes.

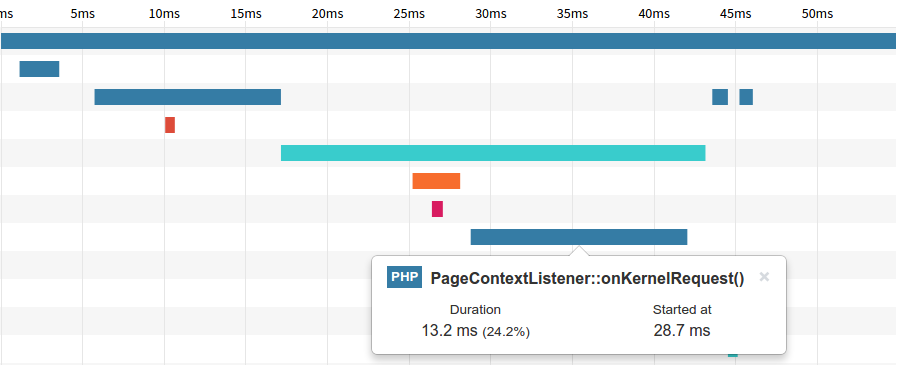
See this timeline of a request (58ms) with the PageContextListener highlighted:

Slow EventListeners decrease Symfony performanceSlow EventListeners decrease Symfony performance

The context listener takes 24.2% of the total request time and over 50% of the kernel.request events time. This is significant and it is important to monitor that this listener isn’t wasting time with unnecessary work.

It is a good idea to have a feeling for how long kernel.request takes in your application, maybe even the time each individual listener needs, because this event is the slowest one in most Symfony applications.

A special case for slow event listeners is the Security component in combination with a Doctrine or Propel based User object. A large user object with lots of properties and associations can slow down your application, because Symfony reloads the user from the database in every request. You can fix this problem by separating the User object Symfony Security needs from the one you are using in your application.

Another thing to look out for in listeners when you are using internal sub-requests: If your listener should only run for the master request, it is important to check for the type and skip for sub-requests. Otherwise the listener will get executed over and over again. Every Kernel Event class allows to checking for the type:

public function onKernelRequest(GetResponseEvent $event) {
     if (!$event->isMasterRequest()) {
         return;
     } 
} 

See the documentation for more information.

3. Excessive Usage of Internal Subrequests

Internal Subrequests are simulated requests inside your Symfony application, allowing to call and render multiple controllers in the same PHP request. This is great for decoupling applications with many different views/widgets on a single page.

But unless you are using some kind of caching, excessive use of internal sub-requests can increase your response times significantly. Especially when you misuse them to render all kinds of “partials”.

Every sub-request will go through the HttpKernel event lifecycle and depending on your Listeners this can add several milliseconds for every subrequest.

Definitely avoid rendering sub-requests in loops, for example to display items in a list:

{% for product in products %}
     {{ render(controller('AppBundle:Product:showList', {'product': product})) }}
{% endfor %} 

Individually each call to a subcontroller is not too slow, but once the number of calls exceeds 10 or 50 per page, their overhead becomes very real. Often controllers used in this way exhibit N+1 query problems, because they cannot share the result of queries efficiently.

Instead of using subcontrollers you can often use a Twig {% include %} statement. It has much less overhead. If the subcontroller does some work that cannot be done in the view, you could think about moving it into a Twig extension.

If your sub-controller is indeed an independent widget, another solution is to use ESI caching. Depending on the cache-lifetime this allows you to have a lot more sub-requests, if the reverse proxy is caching everything for you.

For highly dynamic pages with many widgets on a page, you should investigate different architectures like the one described in Bastian Hoffmann’s slidedeck.

If you are not using ESI or HttpCache from Symfony, but want to cache sub-requests take a look at Alexander’s Twig Cache Extension.

4. Not Delaying Work to the Background

Try to delegate expensive work to the background, such as sending emails or processing uploaded files and images.

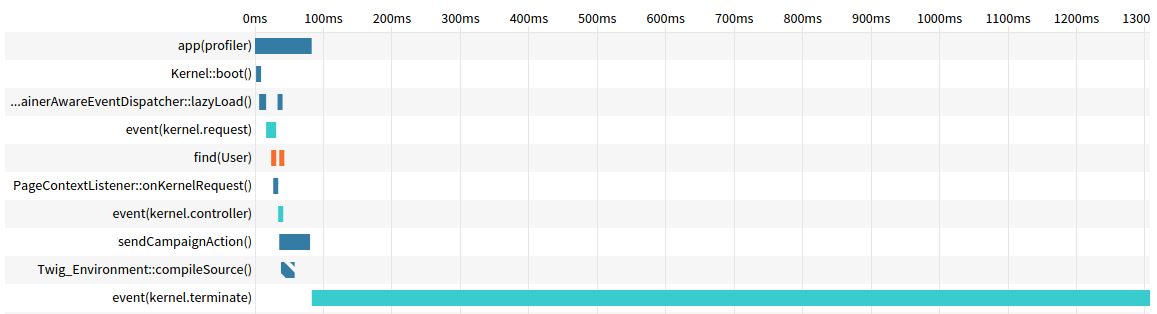
When you use PHP FastCGI Process Manager (FPM) the kernel.terminate event is executed after the response is sent to the user. You can see how powerful this is by looking at a timeline of a Symfony Controller sending a mail with Swiftmailer during kernel.terminate:

Symfony kernel.terminate allows to delay work into backgroundSymfony kernel.terminate allows to delay work into background

The request ends for the user after less than 100ms, but takes another second to actually send the e-mail in the background.

Using kernel.terminate for too much work can be unreliable, a better alternative is using one of the many existing messages queues. I can recommend Beanstalkd as a simple queue for first time users. In the Symfony ecosystem Redis and RabbitMQ are two other choices that are very popular.

If you are not using PHP-FPM, you cannot rely on kernel.terminate, because users still wait for the response to finish.

5. Increasing “Framework Overhead” with Tons of Libraries and Bundles

A Symfony application is never just the framework alone: The standard edition ships with Doctrine DBAL + ORM, Twig, Monolog and Swiftmailer. Many other libraries have excellent support for Symfony such as Guzzle, Buzz, Propel and Imagine. And there are obviously lots of third party bundles, like FOSUserBundle, FOSRestBundle and JMSSerializer. Each of them adds a tiny bit to the baseline performance or framework overhead.

Building a Symfony application makes you responsible for choices about the desired performance level and the libraries you select can move the needle of the baseline quite significantly.

For example: When you want a REST API to respond below 75-100ms for even complex requests, then you will have a hard time to achieve this when using all the heavyweights in your code like Symfony Forms, Doctrine ORM and JMS Serializer. But if you only need a handful of endpoints to be this fast, then using these libraries in all the other endpoints may be fine.

Similarly, if you need a very fast frontend (eCommerce for example) then you can run into trouble when you combine this into one Symfony app with an oversized backend, containing many bundles that add various listeners to all the kernel events.

To provider an anchor, I work on different projects at the moment that clock between 20ms and 100ms for the Symfony framework+bundle overhead.

Conclusion

Symfony by itself is pretty fast, if you can avoid slowing it down with inefficient services, listeners and libraries or misuse of subrequests for partials. This is because of the sound architecture of Symfony as a framework.

First, being able to hook into the compiled dependency injection container avoids lots of runtime overhead that other frameworks quickly gain when going beyond Hello World. As a developer you are in full control of how expensive bootstrapping Symfony is.

Second, its first-class support for ESI and Http Caching allows you to easily plug any reverse proxies in front of the application and benefit from their performance properties.

Essential Macro Optimizations to Improve PHP Performance

This blog post describes four macro-optimizations for PHP applications that are essential to consider before investigating other possible optimizations.

I often find myself discussing small micro-optimizations for 1-2% of speed gain with other developers, even though these macro optimizations haven’t been dealt with first. While it’s fun chasing after small micro optimizations, often it is debatable if the developer time is well spent. After all, I/O is the more important bottleneck in almost every application.

Micro-optimizations are not useless, as SQLite recently showed – investing months of work and applying hundreds of different changes can improve the performance significantly.

But it’s much more efficient to fix the big issues first. The changes I present in this post can be done quickly and their gains can be massive.

1. Upgrade PHP to a recent version

Are you still using older versions of PHP? You are missing out on a lot of improvements that have been made to the Zend Engine. Every minor version in the PHP 5 lifecycle had some improvements compared to the previous versions.

Rasmus is touring conferences in the last months with his talk Speeding Up the Web with PHP 7 showing numbers for the improvements in different applications and frameworks. Lorna has a post on her blog showing improvements in every new PHP version using the Zend Bench script.

Granted, updating to new PHP versions is not always easy if you are working with legacy code. But if your application is suffering from performance problems then updating is something you should look into.

With PHP7 getting released in November 2015, we will see another performance increase of roughly 100% across all kinds of applications. That means, not having a strategy to upgrade to PHP7 in the next year (maybe two years) is careless from a performance perspective.

Another reason to upgrade to recent PHP versions is the reduced memory consumption. PHP 5.6 uses around 50% less memory than 5.3 and you can handle many more requests at the same time without exhausting server memory.

2. Use accelerator such as APC or OPCache

PHP runs your code in two steps:

  1. The script will be transformed from PHP code into opcodes by the PHP compiler.
  2. This intermediate opcache format is then executed by the PHP virtual machine.

Accelerators can cache the first step of this process until the php file changes. Depending on the kind of application you run and your PHP version, using an accelerator can double the performance and then some.

PHP 5.5 already includes Opcache, so there is another reason why you should upgrade to newer versions. On earlier versions you should use APC (5.3) or install Opcache from PECL (5.4).

If you are running on shared hosting then it is possible that your hoster disabled an opcode cache for security reasons. If you are technically savvy then you should move your code to more modern hosters that give you more control and are still very affordable. We are big fans of both Digitalocean and Syseleven for hosting.

3. Close Session for Writes

Careful with sessions in PHP: By default only one request can execute synchronously per session at the same time. Other requests for the same session will wait inside the session_start() call until the previous requests are finished. This problem becomes visible to the user when executing a lot of ajax requests on the same page, loading perfectly one after another and not in parallel.

Session locks exist, because otherwise lost-updates or corruption could happen when two requests write to the same session at the same time.

Contrary to popular believe the Memcache Session handler does not fix the locking problem anymore. Up to version 2.0 it had no locking, but this was implemented in version 3 which is now part of all major Linux distributions. The memcached extension uses locking as well.

What you need to do to fix this problem is explicitly close the session for writes. The PHP function session_write_close(); releases the lock and requests with the same session can be executed concurrently.

Only keep the session open in requests where you are writing to the session, such as the login page. In general you should avoid writing too much data to the session, so that you can close it very early in the majority of requests.

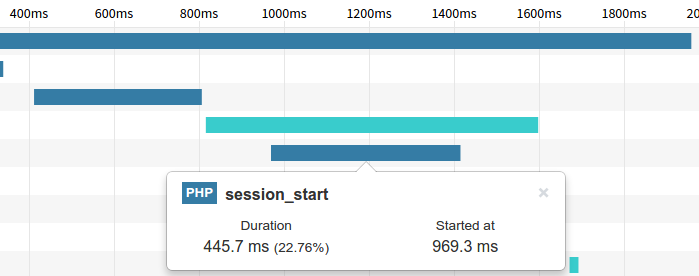
In a Tideways Timeline Trace you can identify this problem when there is a large duration for the session_start() function, in this case over 400ms:

Session Blocking in Tideways TimelineSession Blocking in Tideways Timeline

4. Don’t run XDebug in Production

The XDebug extension should not be used in production, it is a development extension. Just by installing it, your PHP code will run slower – sometimes several magnitudes.

That doesn’t make XDebug an extension non-grata, it just isn’t built for production as the author Derick Rethans mentions himself. If you absolutely need to use a debugger in production, then activate the extension only for a short amount of time on a single server.

If you need a Profiler for production look into our Tideways PHP extension. You can use it with our UI for Timeline- and Callgraph-Profiler or one of the many open-source UIs like XHGui.

5 Doctrine ORM Performance Traps You Should Avoid

Doctrine is a powerful Object-Relational Mapper (ORM) for PHP. It increases developer productivity and allows more secure access to your database.

But using any ORM requires careful consideration with regard to performance, especially the critical paths in your application that you want to be very fast.

This blog post discusses performance traps that you should avoid falling into when using Doctrine ORM.

1. Not Caching Metadata and Query Parsing

This is the most important problem to avoid and it is mentioned in the ORM documentation about performance: Use caching for Metadata and Query Parsing. It is also easy to fix and requires no changes to your application code, except configuration.

For every access to an entity metadata or a DQL query, a relatively expensive parsing process is triggered. Both are built to be fully cacheable and you should make use of this in production applications.

See the documentation on caching for details on setup for different caching backends.

2. Complex Fetch-Joins in Doctrine Query Language

One of the Doctrine’s most powerful features is the Doctrine Query Language (DQL), but you should know about the cases where it can cause performance problems.

I have seen a tendency in many developers towards reducing the number of SQL queries at all costs. This often increases the cost of converting database rows to objects (called Hydration) considerably. There is a trade-off involved between reducing the number of queries by using “Fetch Joins” and hydration performance.

Consider this query for both companies and its employees:

SELECT c, e FROM AcmeEntityCompany c JOIN company.emplyoees e 

The fetch-join part is defined through the alias e in the SELECT-clause, causing Doctrine to load both Company and every Employee entity together.

Using a fetch-join for a too-many association here, results in the company parts of the query being repeated over and over again while retrieving all the employees. This is the nature of the relational model and it doesn’t fit very well with objects here.

Skipping parts of a row is expensive for Doctrine, because it has to detect the row and skip it, performing unnecessary transformations all the time.

You can avoid fetch joins by efficiently fetching the data yourself after the first query:

<?php
 
$dql = "SELECT c FROM AcmeCompany c";
$query = $entityManager->createQuery($dql); 
$companies = $query->getResult();
$employees = $entityManager->getRepository('AcmeEmployee')->findBy(array('company' => $companies));

$employeesByCompany = []; 
foreach ($employees as $employee) {   
  $companyId = $employee->getCompany()->getId();
  $employeesByCompany[$companyId][] = $employee; 
} 

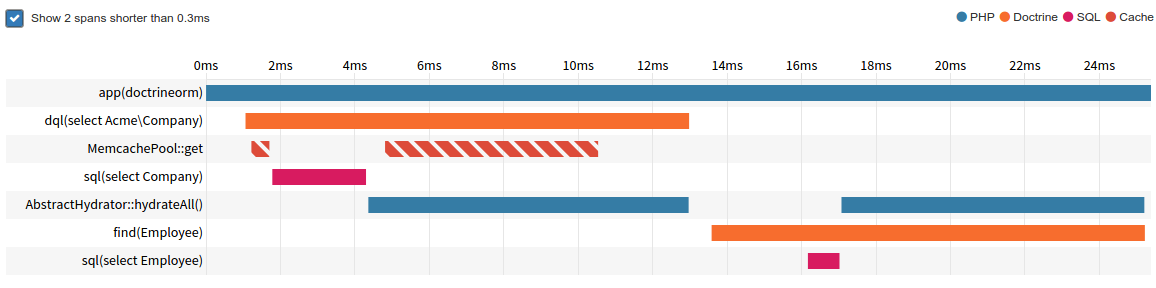
Some convenience of the ORM is lost here, but you get a more performant and scalable solution. The exact gains depend on every individual situation, it is easy to compare the difference looking at a timeline.

For the Company example it looks like a small decrease in total SQL and hydration can be achieved when fetching the data in code:

Doctrine2 DQL with Fetch Join PerformanceDoctrine2 DQL with Fetch Join Performance

Doctrine2 DQL with Eager Loading PerformanceDoctrine2 DQL with Eager Loading Performance

3. Inheritance and Associations

When using an entity with inheritance hierarchy in an associations, lazy loading proxies will not work. This can be very inconvenient when it triggers additional queries and entity creation that is not needed in a request.

This mistake slips in easily when using inheritance, because you don’t see it in the mappings, for example in this association where you need to know Animal is an entity using single table inheritance:

class AnimalRegistration 
{
    /** @ORMManyToOne(targetEntity="Animal") */     
    public $animal; 
}

$registrations = $registrationRepository->findAll(); 

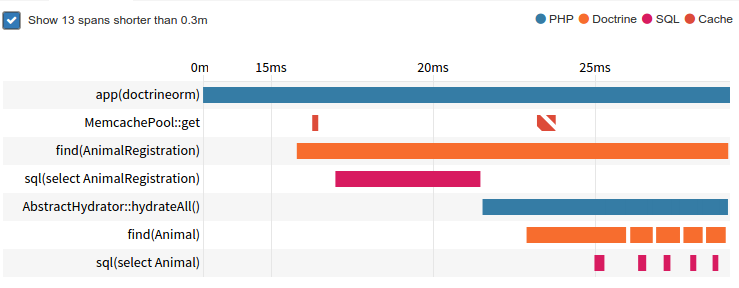
But you can see this when looking at the timeline of a request, how inside the Doctrine findAll() operation we see one additional query for each registration entity.

Bad Performance with Inheritance and Associations in Doctrine2

This is extremly inefficient and one reason why I generally avoid inheritance in Doctrine and discourage others to use it.

4. Bidirectional One-To-One Associations

Similar to the Inheritance and Associations problem, you should avoid bidirectional one-to-one associations in Doctrine. The inverse side of a one-to-one association cannot be lazy loaded.

In contrast to the case of Inheritance Doctrine can perform joins here automatically to fetch the entity. You should not rely on this behavior, because it is dependent on how you query the entity. In larger applications with many developers this performance trap is often a problem, because it is so hard to spot in code.

I avoid bi-directional one-to-one altogether to avoid this performance trap.

5. Lazy-Loading and N+1 Queries

Doctrine’s lazy loading feature is an amazing time-saver for prototyping, but when growing an application it can be a huge performance killer.

The most common problem is passing entities to the view/template and then using lazy loading to access related information.

The following twig template causes the problem. It loops over a list of entities (employees) and prints the field of the association (company):

{% for employee in employees %} 
  <tr>
    <td>{{ employee.name }}</td>
    <td>{{ employee.company.name }}</td>
  </tr>
{% endfor %} 

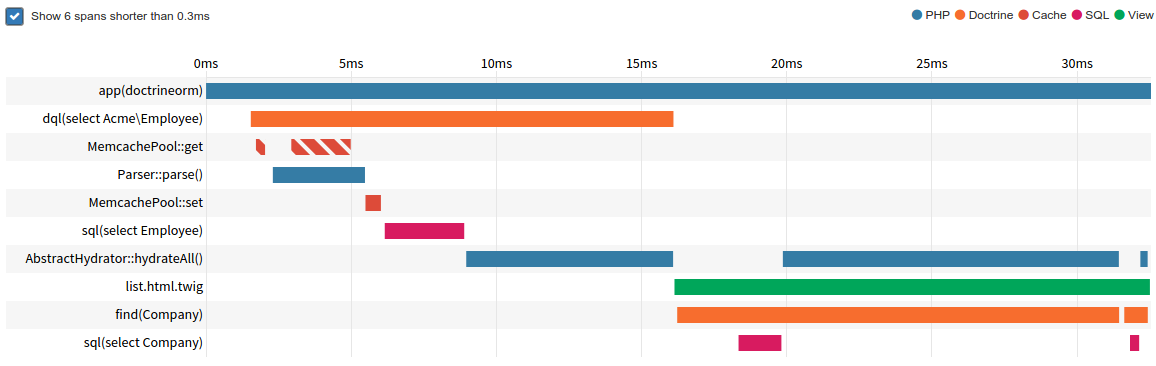
In a Timeline profile this can be easily spotted, the purple/orange spans for SQL/Doctrine are located inside the green Twig span:

Doctrine Lazy Loading Performance BottleneckDoctrine Lazy Loading Performance Bottleneck

There are several ways to fix this:

Use a DQL query to fetch both employees and their company. But be aware of trap #2

Trigger eager loading of the proxies explicitly in the controller:

$companies = array_map(function($employee) {
     return $employee->getCompany();
}, $employees);

$repository = $entityManager->getRepository(AcmeCompany::class);
$repository->findBy(['id' => $companies]);

Set the assocations fetch-mode to “EAGER”: @ORMManyToOne(fetch="EAGER"). This will achieve the same as bullet 2, but will always use eager loading. Use this strategy when you almost always need both entities in combination.

Use a view model object and fetch only the fields that you really need in your view:

SELECT new EmployeeListView(e.name, c.name) FROM AcmeEmployee e JOIN e.company c 

    It depends on the use-case which one to pick, something you should experiment with to get a feeling for the trade-offs at play.