Posts

Tideways 2026.2 Release

Understanding complex request traces is one of the hardest parts of performance analysis.

In this Release, we focused on making this significantly easier in Tideways. The Timeline has been redesigned to provide a clearer view of how requests are executed, with new layout modes, improved navigation, and a more consistent span model.

These changes help you follow execution order, understand dependencies, and identify performance bottlenecks faster, even in complex applications.

In addition, we improved instrumentation across frameworks and libraries, making traces more consistent and providing more detailed insights into previously less visible operations.

And finally, a teaser for our next release: AI-assisted performance analysis and optimization through the Tideways CLI, integrated with Claude, Codex, Cursor, Pi Coding Agent, and other coding agents.

Summary

Improvements to the Timeline Rendering

Waterfall & Condensed Timeline

Our Timeline has been a key part of gaining performance insights with Tideways. It is collected automatically and provides detailed request data, including SQL queries, HTTP requests, and more. We have now improved the visualization to make it more obvious to understand complex request patterns.

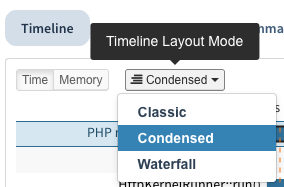
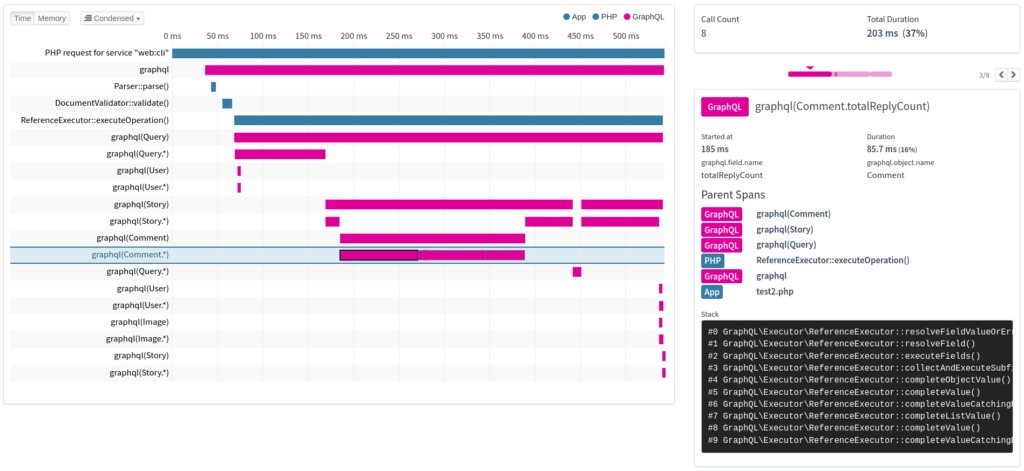
We introduced two new layout modes: Condensed and Waterfall. Condensed is now the default, based on our tests and feedback from beta users. You can still switch to the previous layout, now called Classic, and the preference is saved in the browser.

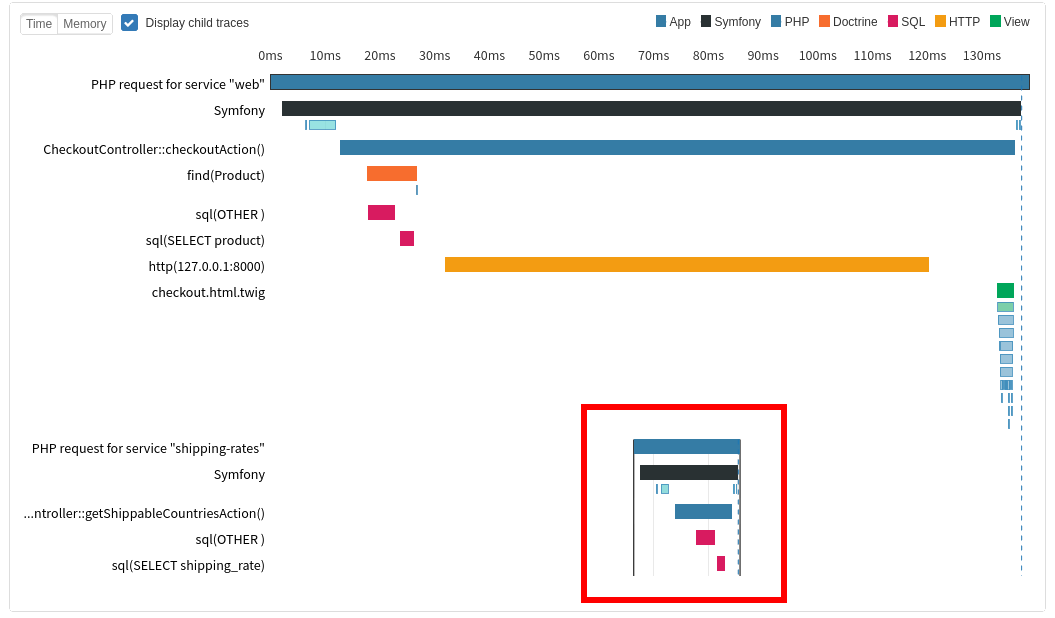
In Classic mode, spans are grouped by their summary. For example, all spans with sql(SELECT service) appear in the same row, regardless of when they occur. This creates a very compact view but makes it harder to follow the sequence of events over time.

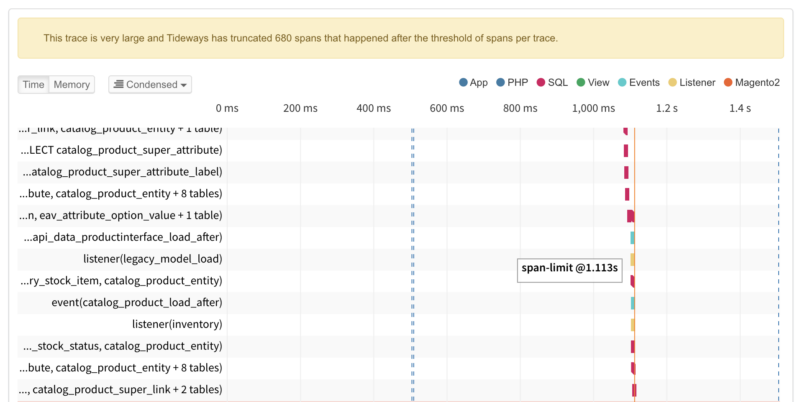
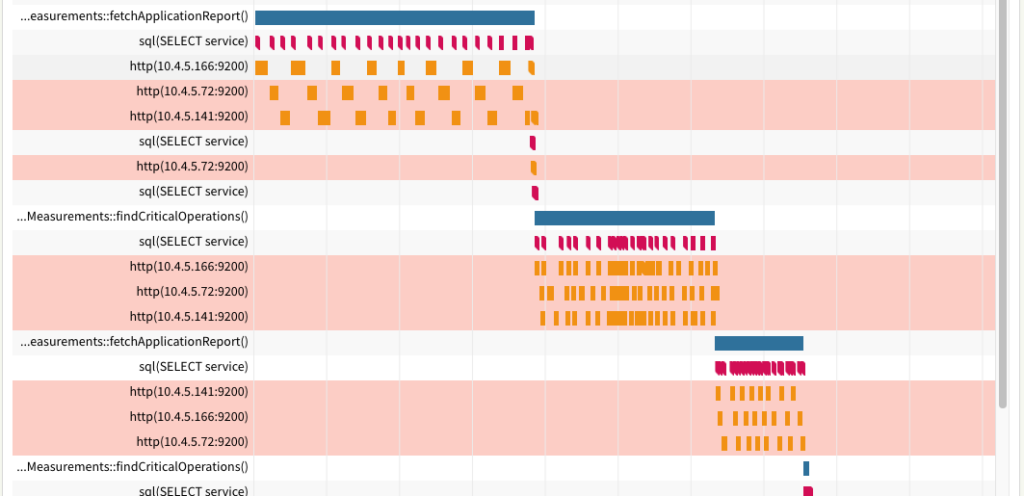
The Condensed mode reuses lines only within a defined threshold and ensures that parent spans are always displayed above their children (e.g.,findCriticalOperations). This improves the visibility of dependencies and the chronological order.

The Waterfall mode is at the other extreme end, where none of the lines are reused. For this, chronological order is as obvious as possible while also often being used in other tools like dev tools in web browsers.

Each mode offers a different balance between compactness and clarity. You can switch between them depending on whether you want a high-level overview or a more detailed, step-by-step view of how a request unfolds.

Documentation: Timeline Layout Modes.

Span Pagination & Mini-Timeline

With the new display modes, it can be less obvious how often and where a span appears across a longer request.

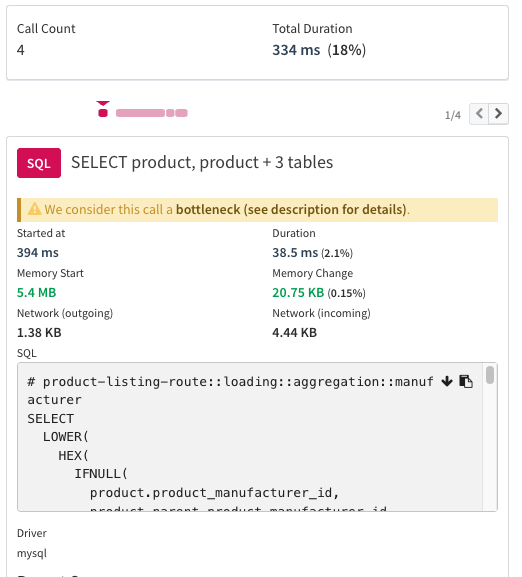
To address this, we added additional navigation and context to the span details view when a span occurs multiple times:

  • Summary box: Shows the total count and duration
  • Pagination: Jump between occurrences of the same span in the timeline by clicking left/right
  • Mini-Timeline: Visualizes the position and duration of each occurrence, with clickable navigation

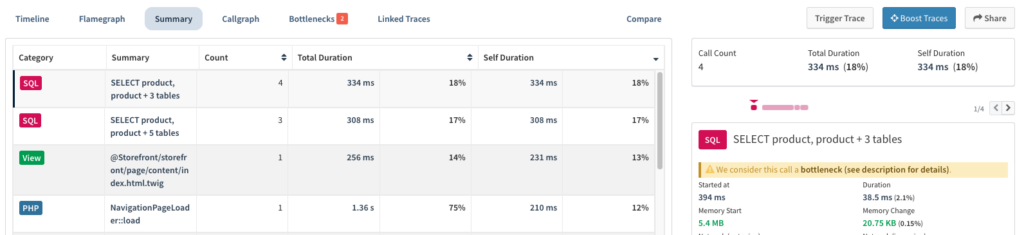
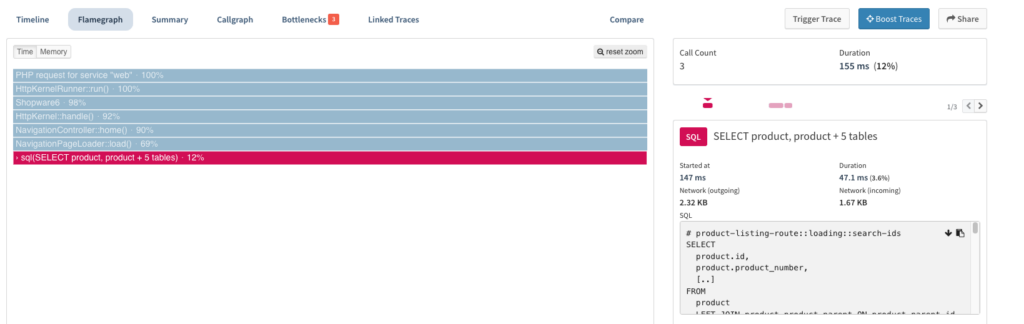
We also added this functionality to the Summary and Flamegraph tabs. Previously, only a single span was shown for the selected Flamegraph frame or table entry. Now, you can view and paginate through all corresponding spans.

More details:

Quality of life improvement: highlight and select lines

Another small improvement to the Timeline that was well received in our tests: the full row of the currently selected span is now always highlighted. In addition, clicking on a row’s summary text selects the first corresponding span automatically.

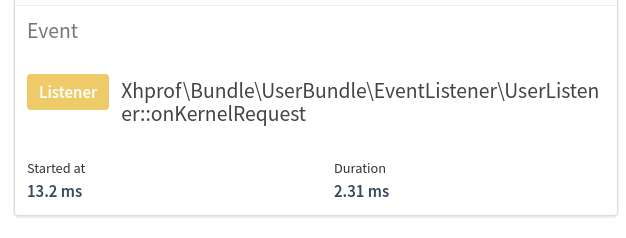
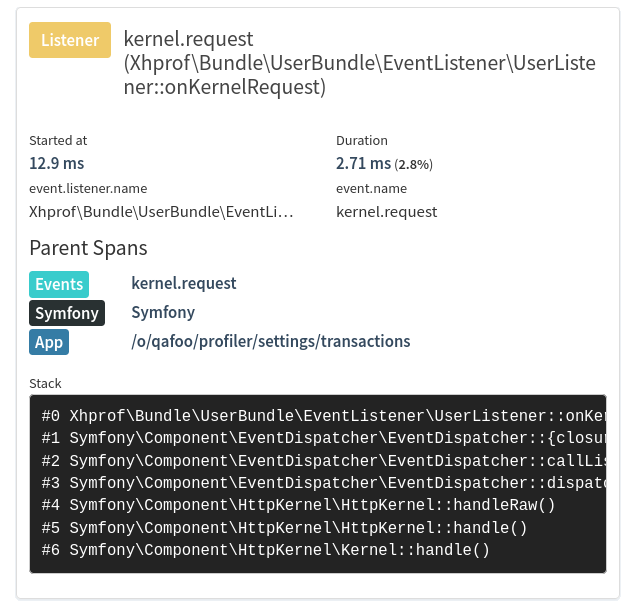
Events, Listeners, Views now with full span details

The Timeline Profiler now does not differentiate between spans and “span-events” anymore; all instrumented function calls are tracked as spans with time, memory, custom annotation context, and stack trace information.

This simplifies the UI of the Timeline Profiler and makes it easier to understand, while at the same time providing more insights individually on operations that were previously stored as just “span-events”.

Before:

After:

This migration started with PHP Extension version 5.36.0 in March 2026 and will continue over the next weeks.

More details:

Response Time Distribution Chart Improvements

Looking at the response time distribution for a transaction has also become clearer.

Apart from visual improvements, we also added the possibility for users to choose the data resolution. You can now get a compact “5% to 99%” percentile of the full resolution of our underlying histogram data structure.

Documentation: Response Time Distribution.

GraphQL Instrumentation Improvements

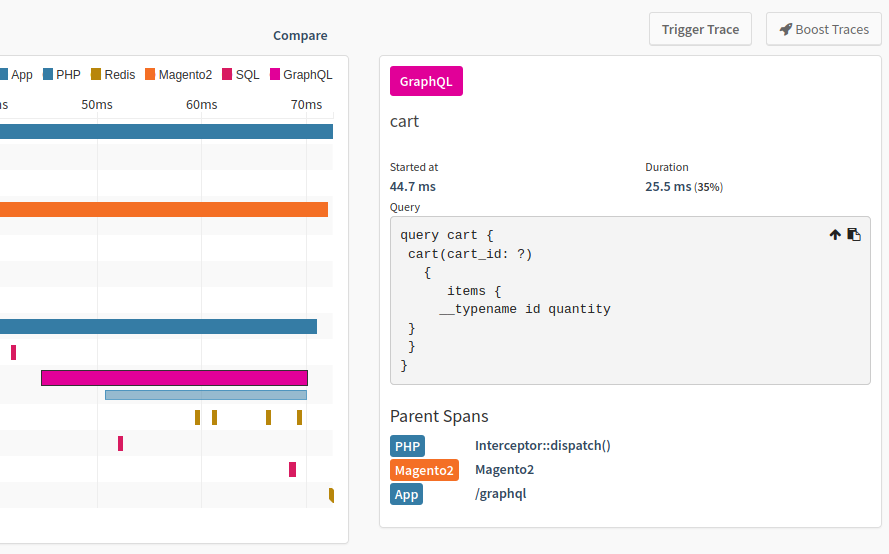
In GraphQL APIs, all business logic runs within a single query. Previously, field retrieval was shown as sub-operations of the GraphQL span, which made it harder to reflect the nested structure of the query.

With this Release, Tideways creates spans for objects and field resolution, making the object graph visible and helping you identify expensive parts of a query more easily.

More details:

Instrumentation improvements

  • Spans for all Symfony lifecycle methods (boot / terminate)
  • Symfony EventDispatcher is now instrumented before Symfony’s boot, supporting instrumentation outside Symfony projects.
  • Spans for Laravel’s lifecycle.
  • Migrated Doctrine spans now include annotations about the size of the workload.
  • Event names for Yii 1/Yii 2 are now properly namespaced by the component name.
  • Events for Symfony, Laravel, Magento 2, Yii 1, Yii 2, and WordPress were migrated to full-featured spans, and annotations were added where useful.
  • PHPUnit test cases now create full-featured spans.
  • Ad-hoc tables created by an SQL subselect will now be included in the list of tables shown in the timeline title, allowing to more easily distinguish different queries using dynamic tables.

Outlook: AI Insights Beta

AI-assisted development is one of the most discussed topics in software engineering right now. We are particularly interested in how Tideways performance data can help AI tools identify and resolve performance bottlenecks more effectively.

Over the last two months, we have been laying the foundation for this by making Tideways data accessible through our CLI. As part of our Beta program, we have now released a first version with support for AI-powered performance analysis and optimization.

If you would like to try it out, you can enable the AI Insights Beta in your Tideways organization settings under Beta Features. This unlocks an early preview in the CLI through tideways run.

Tideways 2026.1 Release

We’re rolling out a new wave of improvements across Tideways in our first Release of 2026, focusing on deeper visibility, smarter automation, and broader ecosystem support.

From automatic tracepoints for selected transactions and improved exception workflows to enhanced FrankenPHP worker-mode instrumentation, these features continue to reduce manual effort while increasing observability.

We’ve also expanded tracing capabilities: distributed tracing now activates automatically alongside tracepoints, and session performance is measured in a dedicated layer to help uncover locking bottlenecks. Shopware users benefit from new invalidate-cache tagging for better HTTP cache debugging, while Redis users gain key-level visibility with improved phpredis instrumentation.

Framework support continues to grow with automatic instrumentation for Tempest and Yii3, alongside improved deployment support for (Open)LiteSpeed environments. On the performance side, Tideways can now flag costly Symfony polyfill usage and recommend native extensions where beneficial.

Finally, observation data is now accessible via the REST API, making it easier to integrate detected bottlenecks into your own workflows.

As always, these updates aim to help you spot performance issues faster and spend less time on manual setup.

Automatic Tracepoints for Selected Transactions

You can now create automatic tracepoint triggers for specific selected transactions, provided that you have a Business or Enterprise plan with advanced tracepoint triggers.

Select the “Tracepoint Trigger” option from the settings dropdown on either the transaction details page or the transaction settings list.

Then configure the schedule to be daily, weekly, or monthly and the duration of the tracepoint to get started.

Acknowledge Errors and Exceptions

It’s now possible to acknowledge errors/exceptions from the error details screen, and if you don’t acknowledge an error, it will send another notification every 24 hours until it is either acknowledged, ignored, or resolved.

This helps with the situation where a notification for a new exception is overlooked accidentally and never seen again.

For all projects created before February 2026, the notification on unacknowledged errors is disabled by default. You can enable it in the settings for the “New Exception” notification.

Worker-Mode for FrankenPHP

Running FrankenPHP in worker mode now automatically recognizes every request run in the main loop, calling frankenphp_handle_request. There are no code changes required in your application to get the same support as with PHP-FPM or Apache mod_php.

This is based on the automated worker mode instrumentation, previously introduced for job queues.

Previously, implementing the necessary code changes was particularly difficult when the framework itself provided the worker script, in the case of Symfony and its Runtime component.

Tracepoints and Distributed Tracing

If distributed tracing is enabled in the PHP extension, it is now automatically activated for requests with an active tracepoint

Previously, distributed tracing was only activated for developer-triggered requests via the Chrome Extension or CLI.

Documentation: Distributed Tracing

Session Layer

Tideways now measures the time spent on session-related operations in a dedicated session layer. This primarily supports detecting blocking session performance issues due to locking, as previously described in our blog.

This includes both loading the session and updating session data when the request completes.

Supported frameworks include PHP’s session extension (including Symfony), Laravel, and WoltLab Suite.

Invalidate-Cache-Tag for Shopware

To improve our HTTP Cache debugging support from the 2025.3 release, we now add an “invalidate-cache” tag to all traces that trigger invalidation of any item in the Shopware HTTP cache. This works for both use cases of direct or deferred invalidation.

This feature should help you detect requests that are invalidating the cache unexpectedly and which may contribute to a bad page cache hit rate.

The detailed trace view then shows which cache item keys were invalidated with the timeline “markers”.

phpredis Key Instrumentation

In addition to Predis and Credis support, instrumentation for the ext/redis (phpredis) extension now includes support for collecting the key accessed by a command.

Documentation: Advanced Instrumentation

Tempest support

With Extension 5.34.0, Tideways adds automatic instrumentation for the Tempest framework, one of the newer additions to the PHP ecosystem.

This includes automatically detecting controllers as transaction names, instrumenting the framework’s exception handlers to capture errors, and creating template engine and event spans to provide additional context.

Yii3 support

We also support the new Yii3 version released at the turn of the year. This includes transaction name detection and exception handling.

(Open)LiteSpeed support

The tideways-php Debian Package now also supports installing Tideways for LSWS, installing the Tideways Extension and the INI configuration template into the correct directories.

Polyfill Bottleneck

Tideways now detects if you use a Symfony Polyfill API (Mbstring, Intl, ..) and it takes up enough time of a request that installing the actual PHP extension would give you a significant performance improvement.

Make observations available via REST API

You can now query the REST API for observation data that show detected monitoring, configuration, and code bottlenecks with detailed problem and solution information.

Due to the highly flexible nature of each problem, the list only contains metadata for now and a link to the application where the detailed information is available.

Documentation: Observations API

Tideways 2025.4 Release

In our fourth Release of 2025, we included PHP 8.5 support on the day of its release and Heartbeats to monitor your application’s pulse more closely than ever. If something is offbeat, you’ll receive timely alerts.

We improved alerting by introducing fine-granular transaction level response time and made automatic tracepoint triggers more powerful.

Summary

PHP 8.5 Support

PHP 8.5 has been released last week and Tideways – as always – supports it from the start with the PHP Extension Release 5.30.0.

Heartbeat Monitoring per Transaction

Some transactions (think cron jobs, payment completion, webhooks) are so critical for web applications that it is a sign of failure or at least a problem when no data was processed for a few minutes or hours.

Tideways can now send notifications on missing transaction check-ins at a granularity of 1 minute and more. For any given transaction, you can configure an individual check-in interval in the transaction settings.

Heartbeat Monitoring

Furthermore, we have renamed the “Missing Data” notifications on the service level to “Heartbeat Monitoring” because this name is clearer and well established.

Check our documentation for more detail.

Improved Alerting on Transaction Response Times

Alerting for response time thresholds on a per-transaction basis was previously exclusive to only bigger plans. We have completely rebuilt how it works to allow a much wider audience to benefit from this feature.

You can now configure the notification under transaction settings, just like all the other transaction-level notifications.

Improved Alerting

You will notice an added line in the performance chart for the transactions on which you enabled this feature.

Response Times

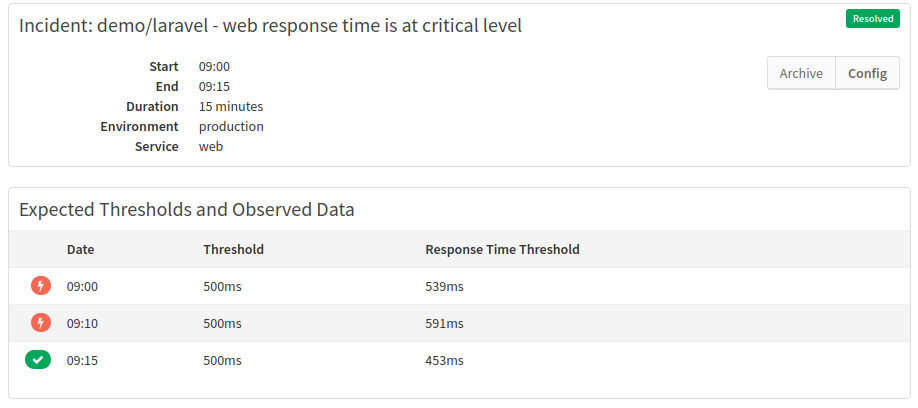
When the response is slower than expected for 5% of all requests, then an incident is created and notifications may be sent:

Improvement Transaction List Filters

Because of these new transaction notification options for heartbeats and response times, we worked on a few small improvements for the Transaction settings list:

  • You can now see at a glance which notifications are set per transaction.
  • There are filters available to only select transactions with selected notifications configured.

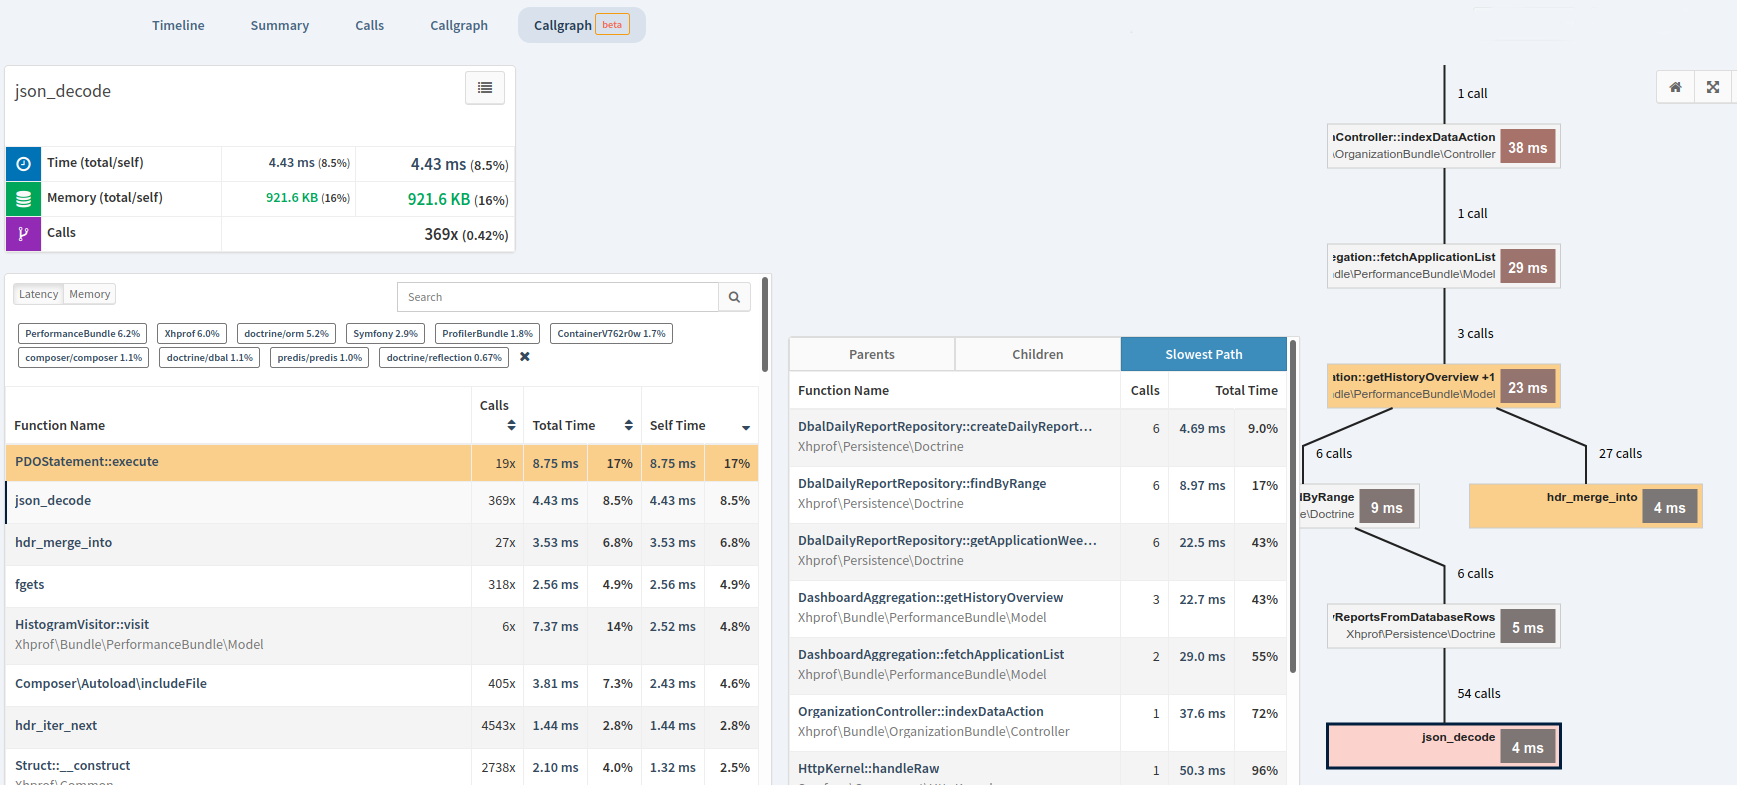
More nodes in Callgraphs

Callgraphs can become quite complex quickly. After all, every function call is tracked. With modern frameworks or ecommerce solutions, this can be hundreds or thousands of different functions being recorded.

Visualizing this data can be a challenge. Which is why we limit the number of visible nodes by a simple algorithm: take the three most costly function calls and build the graph upwards from there. The full list of function calls has always been available using the table on the left anyway.

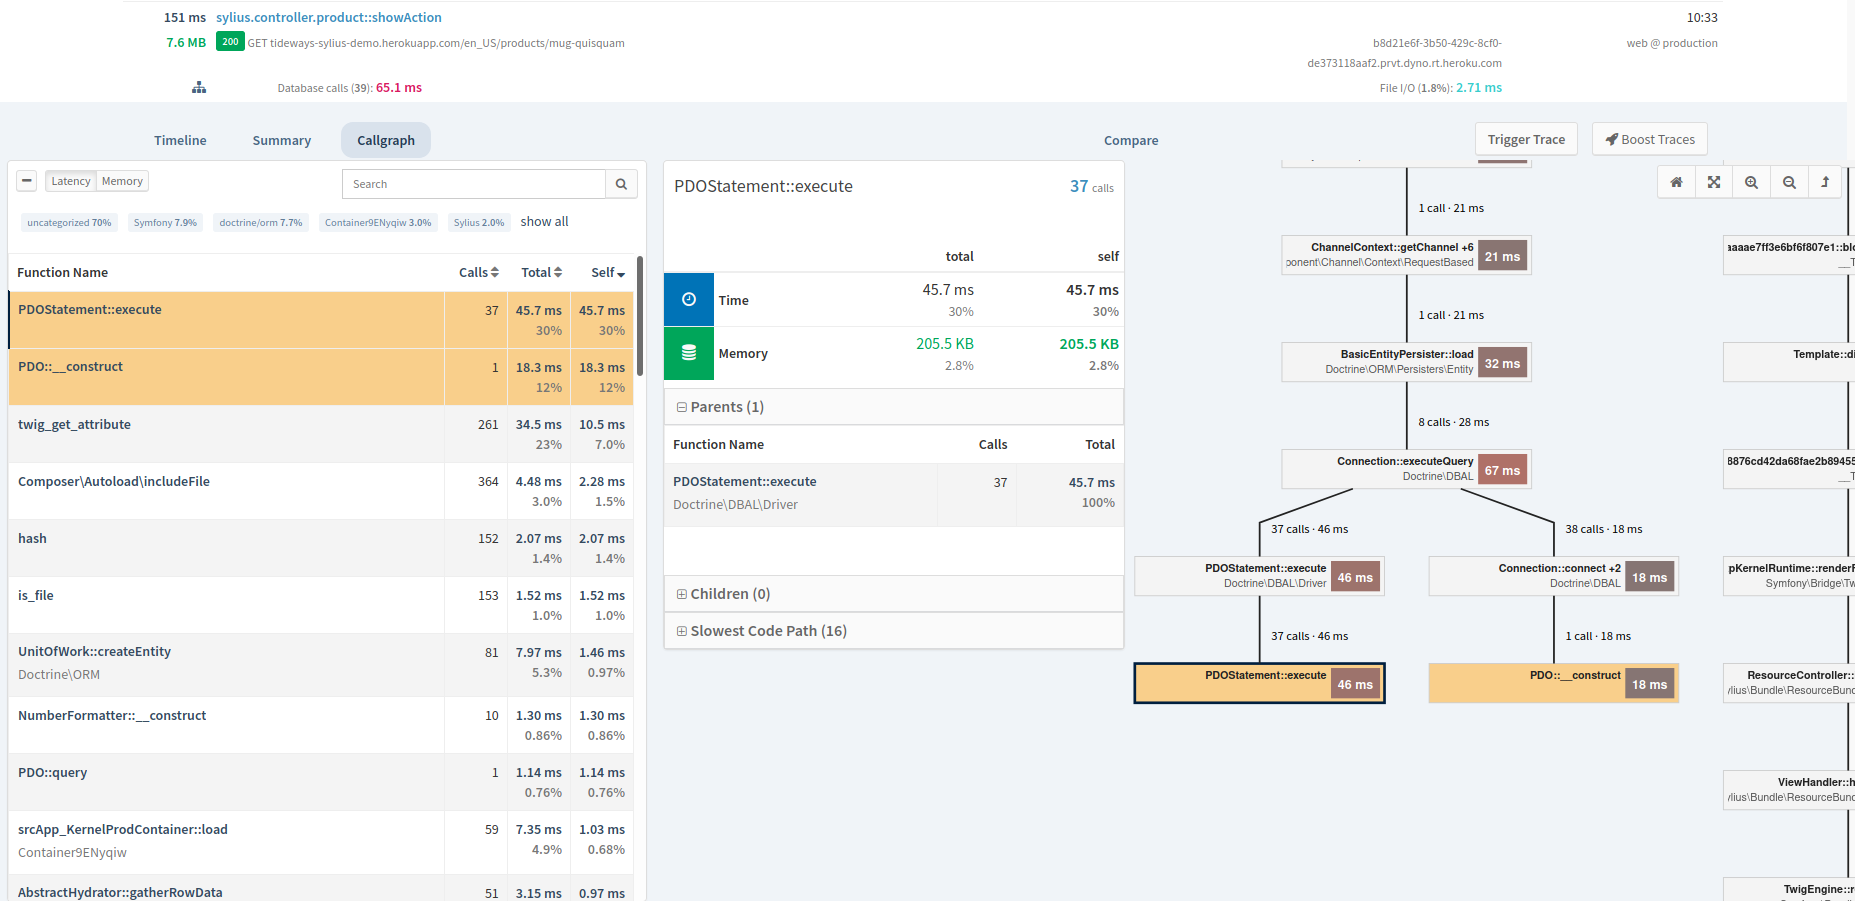
But since it is helpful in some cases to see a wider range of nodes, we added an option to change this start-count using a dropdown. This might be useful, e.g., with long-running scripts, where there might be more than a handful of important calls.

Automatic Tracepoints Trigger

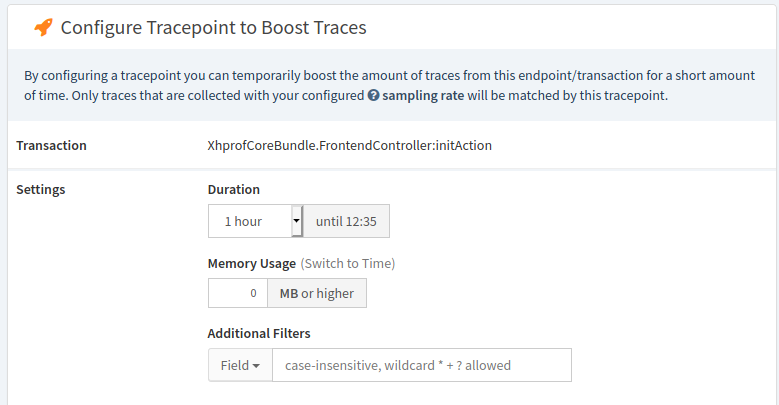
After introducing automatic tracepoints in the last release, there is now another strategy to create a tracepoint automatically: It picks one of the seven most high-impact transactions that are rotated every week.

This will provide you with callgraph insights into different parts of the application automatically, and in combination with the trace history this data is available over a long period of time as well.

This strategy is available for Business and Enterprise plans and is used automatically for triggers created for new services. Alternatively you can select the strategy from the settings called “Rotate between highest impact transactions”.

More Stacktraces on Spans

We’ve changed the default INI settings that control when stack traces are added to spans in a trace to 1 ms (from previously 3 ms) and increased the stack depth to 10 (previously 5). Overall, this should make stack traces more valuable for pinpointing performance problems.

PDO Transactions

Long-running database transactions can have a significant impact on database performance and should thus be active as long as necessary but as short as possible. Tideways already included individual spans for BEGIN and COMMIT / ROLLBACK queries, indicating the start and end of a transaction and the COMMIT performance.

Now Tideways will also create a “meta span” spanning the entire transaction, making it easier to see at a glance which queries are part of the transaction and for how long the transaction was active. Since rollbacks can be particularly expensive and generally indicate issues, the spans for rolled-back transactions will also be marked as “errored”.

PDO Transactions

Incoming Network for Predis

When using the predis/predis library, spans will now contain a Network (incoming) annotation, just like HTTP calls or MySQL queries.

Magento Sections

To improve the efficiency of the page cache, Magento retrieves dynamic user-specific components of the resulting page in bulk from a special “Section Loader” endpoint. Traces for this endpoint now contain spans for each component loaded, helping you find out which components are particularly expensive to calculate.

Minor PHP Extension Improvements

This release, as always, contains some minor improvements to various features. Amongst those is extending support for the automated worker instrumentation to Yii 2 Queues, support for transaction name detection with Slim 4 and extended detection of email addresses in error messages and URLs in Tideways Daemon to prevent them from leaving your infrastructure.

Check our detailed changelog for more detail.

Time to get started with Profiling! With our free trial.

Tideways 2025.3 Release

In our third Release of 2025, you’ll uncover new ways to correlate data, debug critical bottlenecks, and streamline your workflow.

Over the last few months, we have been working on powerful new features and refinements for you; designed to give you more in-depth visibility, more automation, and smoother workflows.

We’ve added Performance Correlation in our service overview, so you can now spot dependencies and degradations system-wide at a glance.

To make troubleshooting smoother, Tracepoints can now be triggered automatically, along with further improvements that give you faster, more precise profiling results.

For Shopware users, we’re introducing powerful new debugging options for the HTTP Cache, while an improved Transaction Tagging API gives you cleaner, more flexible insights across all environments.

We expanded crawler monitoring for assessment of their impact on app performance.

We’ve also sharpened instrumentation:

Magento 2 template insights for spotting hidden inefficiencies.

HTTP Location header instrumentation for more complete visibility.

Enhanced TYPO3 and AMQP insights, closing gaps in instrumentation.

On top of that, quality-of-life features like choosing the default organization shown right after login make everyday use simpler and more intuitive.

More correlation. Smarter insights. Smoother workflows. With this Release, you’ll be ready to track performance from every angle and resolve issues faster than ever.

Enjoy and see how Release 2025.3 helps you push your application performance to the next level.

Summary

Correlation In Service Overview

Through the “Service Overview” feature, Tideways allows you to pinpoint performance issues in different parts of your application. But as these services are often still connected, comparing their performance directly can reveal hidden dependencies and system-wide slowdowns.

With the new ‘All’ option in the performance screen, you can now view and compare performance graphs across all services in your project at once.

Screenshot1 Release 2025.3

Hovering over a timeslot will make the familiar detailed tooltip for that service appear, while the same timeslot is highlighted across all other charts, making cross-service correlations effortless.

Trigger Tracepoints Automatically

Tideways now allows to configure the automatic creation of tracepoints on a schedule for the transactions of a service that have the highest performance impact.

In the Project Settings, you find a new section “Tracepoints” that allows you to configure these automatic tracepoints.

Screenshot_Tracepoints

This feature is currently limited to the current request-based plans only and for all these projects, an automatic tracepoint was created already that creates a tracepoint, including callgraph collection, for the highest impact transaction once a day.

Based on this regularly available call graph trace, Tideways can detect more bottlenecks automatically and provide you with fresh insights every day in the “Observations” tab.

Additionally, Tideways can store these traces via Callgraphs in the trace history with long-term retention, enabling you to compare call graph data months or even years apart—and clearly see where your code has regressed over time.

Other Tracepoint Improvements

Callgraph Tracepoints Activated By Default

When creating a new Tracepoint, the “Activate Callgraph Profiler” checkbox is now toggled on by default, because we saw the majority of tracepoints were created with Callgraphs activated.

Screenshot Configure Tracepoints

Start Again Button for Tracepoints

A completed tracepoint can now be restarted with the same settings and duration again, by clicking on the „Start again“ button.

Screenshot_Start_Again_Button1

Debugging Capabilities for Shopware Cache

For Shopware, Tideways will now also collect the context information influencing the page cache key, making it easier to determine why a specific transaction could not be served from the page cache.

Screenshot_Debugging_Capabilities

Improved Transaction Tagging API

The \Tideways\Profiler API now includes new methods getTags(), addTag(), and removeTag(). These allow you to build up the list of tags incrementally at different stages of a transaction. For example, adding an “authenticated” tag during bootstrapping and a controller-specific tag later when the controller runs.

The page cache instrumentation, which automatically sets cached and uncached tags, received an in-depth rework. Instead of a Shopware-specific solution, it now includes direct support for Symfony’s HTTP cache, benefiting all Symfony applications and implicitly fixing some bugs within Shopware’s page cache support—for example around stale responses.

The cached and uncached tags added by the automated instrumentation and the Profiler::markPageCache*() methods will also no longer overwrite any other tags already set for the transaction.

Monitoring Crawler Impact

Crawlers, bots, and robots have always been an influential source of traffic on public-facing web applications, and with AI bots doing more and more work on behalf of users, this share is increasing recently.

To allow debugging performance issues caused by crawlers, Crawler Detection for traces was added in the 2024.3 Release of Tideways.

In this Release we are expanding its use into Monitoring: You can now see the percentage of crawlers in the current monitoring timeframe as a percentage and in the tooltip for each time slot. You can also see the crawler ratio in the history data at the daily, weekly, and monthly granularity.

Screenshot_Monitoring_Crawler_Impact

Improved Magento 2 Template Insights

Information captured for Magento blocks has been extended. Block events now contain both the name and class name of a block instead of just a block, and new events for rendered template blocks have been added.

HTTP Location Header Improvements

Tideways will now store the redirect target (location response header) as an annotation on the root span.

This helps debugging and understanding in the cases where it’s important to know where exactly a request was redirected to.

Screenshot_Location_Header_Instrumentation

Improved TYPO3 Insights

Tideways now includes automated instrumentation for TYPO3, including transaction naming, automated service detection, page cache tagging support, and Fluid Template spans.

Improved AMQP Insights

The existing AMQP instrumentation for both the amqp extension and the php-amqplib/php-amqplib composer library has greatly been extended.

  • The timeline now includes spans for the connection establishment and opening a new channel.
  • The publish command now includes annotations for the channel ID and improves reliability for the existing annotations for routing key and exchange name.
  • For the amqplib composer library, time spent communicating with the AMQP service will now be tracked more accurately within the “Queue” layer.

Select Organization shown after Log-In

For users with access to multiple organizations, any one organization can now be marked as default by clicking on the star icon and will then be visible immediately after logging in.

Time to get started with Profiling! With our free trial.

Performance Benchmark Report Q2 2025 for Magento 2

How does your Magento 2 store’s PHP backend performance compare to other operators of Magento in general?

To answer this question, we have aggregated and anonymized performance data from over 70 Magento 2 stores over the last quarter and computed benchmark numbers to compare to for the most important page types: Product details, Category Page, Search, and Homepage.

Executive Summary

  • For the Magento operators in the Top 10% and 25%, the numbers show what is possible if you operate with a focus on backend performance. The top 10% of shops perform in the range of 500 ms on average and below 1 second in the 95% percentile.
  • The slowest 25% of shops have their pages perform around 2 seconds on average and above 3 seconds in the 95% percentile in Time to First Byte (TTFB). This will affect the Largest Contentful Paint (LCP) scoring, which turns from Good to “Needs Improvement” at 2.5 seconds. These shops have no chance of reaching a good result from these numbers, as TTFB is only one factor in LCP.
  • Without very high full page cache hit ratios, many visitors of Magento 2 shops will have suboptimal performance.
  • Compared to our Shopware 6 benchmark, these numbers look worse – but they are not comparable, as a larger number of Magento stores uses Varnish for cached pages compared to PHP-based full page caching in Shopware 6.
  • The fastest and slowest 10% are 5–15 times apart, showing that there is tremendous potential in analyzing and optimizing PHP backend performance with tools like Tideways.

Benchmark of average response times

Page10% Best25% BestMedian25% Worst10% Worst
Product Details671 ms895 ms1407 ms1983 ms3071 ms
Category Page639 ms927 ms1471 ms2303 ms3199 ms
Search431 ms735 ms1087 ms2175 ms3711 ms
Homepage191 ms543 ms863 ms1535 ms2943 ms

Benchmark of 95% percentile response times

Page10% Best25% BestMedian25% Worst10% Worst
Product Details895 ms1279 ms2047 ms3071 ms5631 ms
Category Page959 ms1407 ms2303 ms3583 ms6399 ms
Search543 ms1023 ms1599 ms3071 ms6399 ms
Homepage239 ms735 ms1151 ms2175 ms4351 ms

Methodology

The data foundation for this is daily average and 95% response times of PHP requests in Magento 2 shops that have an active Tideways subscription or trial during the first quarter of 2025 and reported data to our backend. This is measured through the Tideways PHP extension, tapping into the PHP runtime.

From a Core Web Vitals perspective, this is an approximate benchmark for the Time to First Byte (TTFB) of all requests in the shop that are served by the PHP backend. Requests served cached from Varnish, Fastly or other HTTP cache in front of the shop are not included.

A shop must have had at least 5,000 storefront requests that day processed by PHP in the backend and 250 requests of the page type to be included. Only shops using the default controllers for the product details, category list, search, cart, and homepage page types are considered. This leads to 26,951 data points included in the report.

Take these numbers with a grain of salt because they intentionally include Magento users across all major PHP and Magento versions, with Elasticsearch or MySQL-based search, with Magento’s HTTP Cache enabled or using external HTTP caches (Varnish) and across all industries and customer personas.

Upcoming Improvements

In the future we plan to include non-default controllers for these pages as well, as Magento 2 stores often use plugins with custom controllers for product or category pages.

See where your store ranks

To see where your Magento 2 store is ranking, sign up to a free trial with Tideways and collect backend performance data. Tideways can recommend performance optimizations and provides effortless insights into all code-level performance problems.

Tideways 2025.2 Release

In our second Release in 2025, we’re introducing additional performance insights to help you identify and resolve even more Bottlenecks faster and more effectively.

Detailed information is now integrated in our Weekly Report, namely the number and types of the observations discovered in your application. We’re eager to make it easier than ever to stay on top of optimizations.

If some of the Bottlenecks should not match your particular project, you now have the option to ignore them, giving you greater control and flexibility.

We’ve also streamlined Checks and Alerts with a more intuitive service and environment selection UI – so setup is simpler and more user-friendly.

The Profiler was extended: We’ve added automatic insights for MySQL queries, flagging cases with missing or inefficient indexes. You’ll also get better visibility into session handler behavior, helping you catch subtle performance issues earlier.

More context. Smarter detection. Fewer surprises. Browse through our latest Release and keep your stack running smooth.

Dive into the Release and take your application performance to the next level.

Summary:

Bottlenecks in Weekly Report

Integrated into the Weekly Report, each customer can now find the statistics on the various observations, namely the number and type that were detected in their application during the past week. We have chosen the light bulb as symbol.

Mute Bottlenecks

Tideways’s list of observations has been growing steadily. If some of those don’t match your particular project, you now have the option to ignore them and to decide that they will no longer be displayed in your list by default giving you greater control and flexibility.

New Automatically Detected Bottlenecks

  • Significant sleep/usleep usage You will get alerted if traces take a long time calling sleep/usleep and removing or optimizing can improve performance.
  • Shopware6 / Consider using Elasticsearch/OpenSearch This Bottleneck highlights the need to consider using Shopware with Elasticsearch, especially given the potentially slow SQL aggregation queries (for price and properties).
  • Symfony ErrorHandler::handleError If lots of deprecations, notices or warnings are being triggered, Symfony’s error handler can slow down requests significantly. Take a deep dive with our blog post on Composer Patches.
  • ORM Query Parsing takes significant time Frequent use of Doctrine’s query parsing function can negatively impact performance.
  • Doctrine ORM: Entity Metadata not cached This suggests metadata caching may not be enabled—something strongly recommended for production uses of Doctrine ORM.
  • Refactor use of array_unique The Bottleneck array_unique suggests inefficient use of arrays; using unique identifiers as keys to maintain uniqueness automatically during insertion would be a suitable remedy. Looking for more details? Read our related blog post.
  • wp_nav_menu usage takes up a significant amount of time Heavy use of wp_nav_menu may affect performance—consider using the Automatic plugin to cache navigation menus.
  • Slow Google Analytics/Tag Manager Plugin Shopware, Magento and WordPress sites often use plugins integrating with Google Tag Manager. Caching these API calls or using custom implementations can increase performance significantly.

Overhaul of Service/Environment Filter for Checks & Alerts

You can now select which services and environments should trigger notifications via a drop-down menu. That means you don’t have to enter the complex services and environments filter language anymore to make this selection.

MySQL Statistics in Query Spans

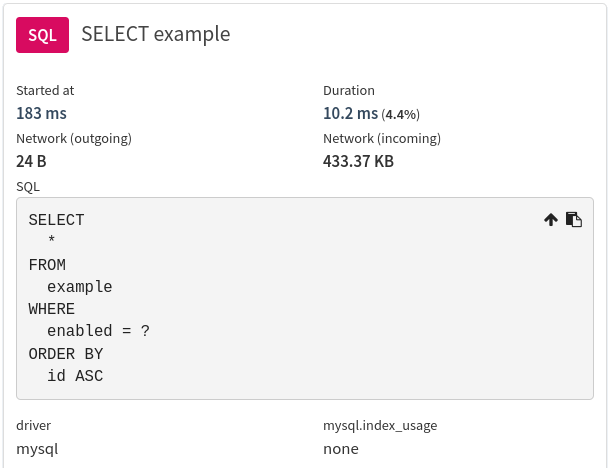
When using MySQL, SQL spans in the timeline will now include additional annotations. The new mysql.index_usage annotation indicates when MySQL reported that no (none) or a bad index (bad) was used by the query.

The “Network” annotations known from HTTP spans are now also available on MySQL spans, giving better visibility into the size of query payloads and the amount of data fetched.

Insights on Session Handlers

During session initialization, it’s important to measure how long the process takes ****to ensure optimal performance. Blocking sessions is a regular bottleneck in PHP applications that Tideways points out.

A key configuration impacting session performance and blocking is the INI setting session.save_handler.

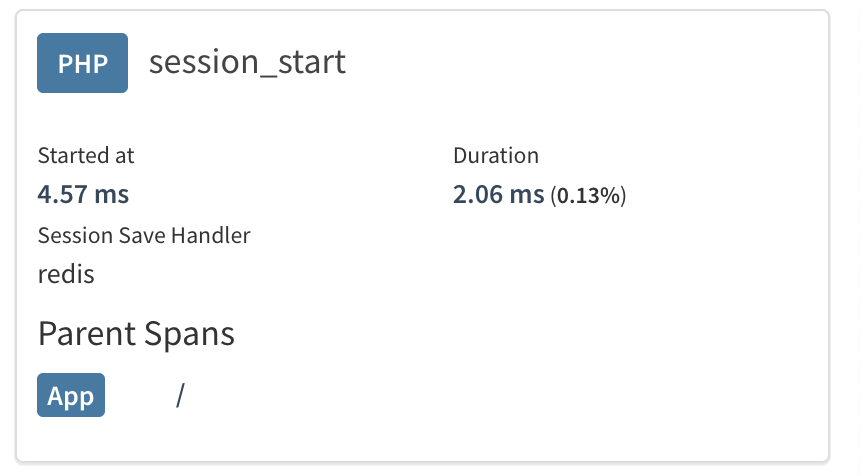
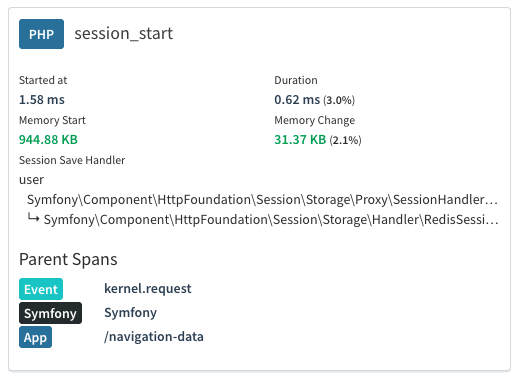
Traces in Tideways that open a session now show the save handler that is being used.

With this you can more get more insights on the current session behavior in your application.

For “user”-implemented session handlers, Tideways provides additional clarity on exactly what storage mechanism is being used by highlighting the concrete class.

Improve WordPress service and transactions

Several enhancements have been made to improve WordPress service performance and transaction handling:

WordPress cronjobs (wp-cron) are now fully integrated with Tideways’ transaction detection, allowing Tideways to capture each individual cronjob’s performance metrics.

The admin and the user interface of a WordPress application are now separated into two services automatically. This allows a clear distinction of their respective performance. Usually the user interface must remain fast and responsive, and for the admin interface performance is less critical.

Layer Metrics API in PHP Extension

Support has been added to make the raw layer metrics accessible via a new API. This means that the timings of the various layers (e.g. SQL Database, External HTTP calls) are now available to the application itself.

The primary use-case we have in mind for this API is the Server-Timing HTTP response header and its integration into frontend performance testing tools.

This feature is made available through the new method \Tideways\Profiler::getLayerMetrics().

This enhancement empowers developers and users to better integrate these information with other performance tools.

Time to get started with Profiling! With our free trial.

Tideways 2025.1 Release

For our first Release in 2025, we have cooked up more precise performance insights for you and can now, with Automatic Bottleneck Detection, serve you bottlenecks on a silver platter including recipes on how to fix them. Work on several improvements, like Native Worker Support in the PHP Extension, has kept us busy over the winter. A series of instrumentation improvements has chased away the winter blues and is now making way for a spring full of user-friendliness. We also present you with improvements to the Layer Monitoring and a new Notification Log. As part of the spring-cleaning, we renamed the traces that are compared with each other from Base/Target to Before/After. And that’s by no means all there is to report — dive head first in our Release and enjoy!

Summary:

Automatic Bottleneck Detection

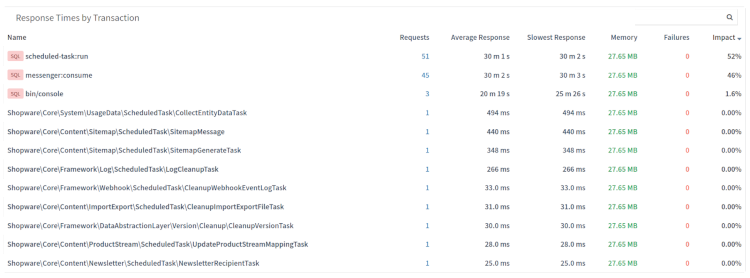
A profiling trace in Tideways has a lot of information across Timeline and Callgraph data, and finding bottlenecks usually means diving deep into this data. In the current Release, we introduce a more comprehensive automatic bottleneck detection that is based on the data from traces that we already collect. Instead of having to dig out the bottleneck from the profiling data yourself, if it’s a known problem, we can now show you both the bottleneck AND a solution recipe. Our goal is helping you accelerate bottleneck detection and troubleshooting.

Screenshot 1 Release Q1:25

With this foundation, we plan to add automated detection for even more bottlenecks specific to certain frameworks, such as Shopware, Symfony, or Magento. This customization will bring clarity more quickly, as it expedites the process of performance optimization by saving you the time-intensive search for solutions yourself.

So far, detected bottlenecks were displayed only in ‘Traces’ listed in the ‘Bottlenecks’ tab. Now, the bottlenecks will not only be way more detailed; they will also be aggregated to the service level and shown in ‘Observations’. You will get a complete overview in the observations tab and don’t need to sift through individual traces anymore.

Our new bottlenecks can also leverage Callgraph traces. So if you collect Callgraphs regularly, we will be able to gain even more insights into where your system is slowed down. Whilst we are expanding this feature, we incorporate everything we know about PHP performance into bottlenecks.

For now, we have added automatic detection for these new bottlenecks:

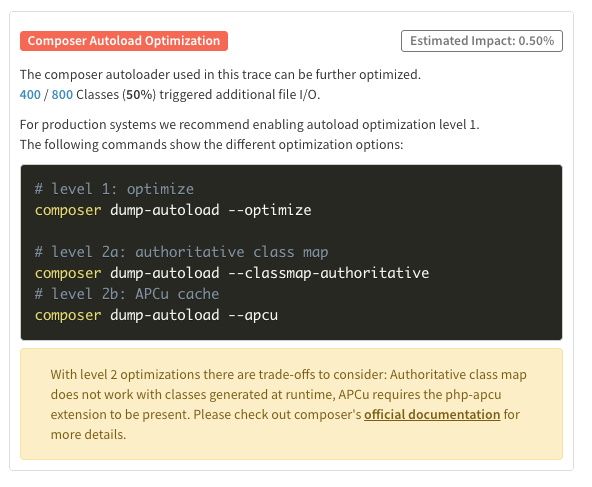
  • Not using Composer Autoload Optimizations
  • Using Symfony’s trigger_deprecation excessively
  • Using Shopware’s CartPersister API incorrectly for a huge performance hit
  • Blocking page views by using the Facebook Graph API to track Events 

Native Worker Support in PHP Extension

Tideways now automatically detects transaction names for individual tasks executing within worker queues of Symfony, Laravel, Shopware 6, Magento, and WoltLab Suite.

In this Shopware 6 demo application, you can see the worker tasks individually monitored.

Screenshot 2 Release Q1:25

Native support for workers improves observability for requests that dynamically perform multiple independent (background) tasks with differing performance profiles.

Previously, Tideways would only detect the execution of a single long-running request, with the collected data and timeline showing the actions of all executed tasks. By automatically detecting the individual tasks and creating separate transactions, Tideways now can clearly attribute individual actions (e.g., SQL queries or HTTP calls) to the specific task, measure the failure rate of individual tasks and point out bottlenecks on a per-task basis. This also enables setting tracepoints on these individual tasks. 

Besides the supported worker queues listed above, we also plan to add more generic support and other frameworks in the future.

Layer Improvements

Additional Layers

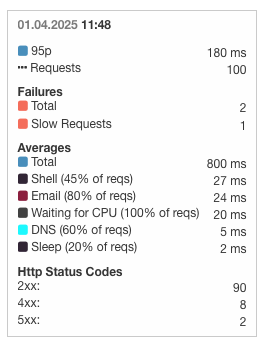
While Tideways can already account for much of the time in a request when looking at our performance chart, there is still more to cover. With the following new layers, we can now provide an even more fine-grained summary of where the time is spent processing a request. 

As a result, there is less ‘Unaccounted Wait’ because more time spent waiting can be accounted for; that means more time is assigned to actionable layers. 

The layers are displayed in the averages chart in the performance section and in each trace (see layer report):

  • Waiting For CPU
  • Sleep
  • DNS
  • Mail
  • Shell
Screenshot 3 Release Q1:25

New Layer: Waiting for CPU

One of the Additional Layers is ‘Waiting for CPU’. It indicates the time spent waiting for the operating system’s scheduler to free up a CPU core to continue processing the request. It provides an indication that particular requests are experiencing delays in processing that are not necessarily caused by the request itself, but insufficient hardware resources or other processes, such as a database running on the same server, performing computationally expensive processing.

Layer Report: a high-level breakdown of your traces

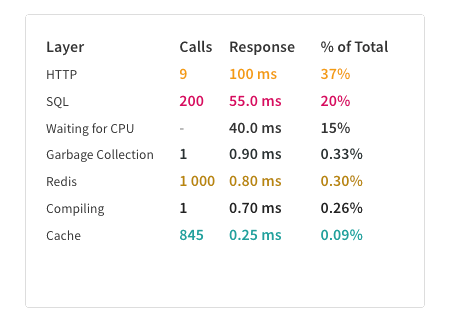
The first thing you see when you open a trace now is a complete, detailed layer report, a breakdown of all the layers that contributed to the total time of that trace.

Screenshot 4 Release Q1:25

Improved Layer Collection

As part of the improvement of the layer functionality, we did not just add additional layers and improved the UI, we also cleaned up the technical basis that collects the layer information within the Tideways extension. 

As a result, the collected data is more precise. For example, async HTTP requests using CurlMultiHandle now measure the time that is spent processing the retrieved data. 

Previously, the entire time from sending the request until the full response is received was measured, which would consider the sum of the runtime of parallel requests, exceeding the actual time spent blocking. 

Notification Log

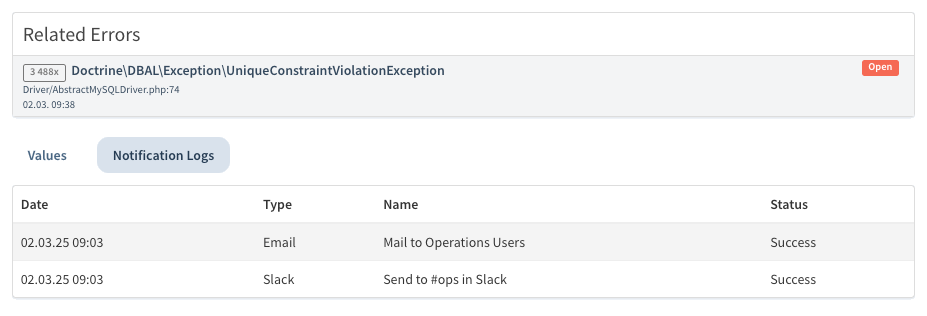
We added a new ‘Notification Log’ for Errors/Exceptions, Incidents, and Releases. For each of these events, users can now view the date and time of the notifications and through which channel, e.g. Slack or email, they were notified.

Screenshot 5 Release Q1:25

session_write_close() in Timeline

Tideways will now indicate with a timeline marker when session_write_close() is used, indicating the time the session is unlocked. This can help other requests to go on without further ado.

When using PHP’s integrated session functionality, sessions are automatically locked for concurrent access while they are in use by a request to prevent race conditions. As a result, requests using the same session are blocked until previous requests finish. When no additional modifications to the session data need to be made, for example in read-only requests, the session_write_close() function can be used to write the updated session data and unlock the session, allowing other requests to proceed without waiting for the request to finish. Similarly to the existing marker for fastcgi_finish_request().

Trace Comparison: Base/Target is now Before/After

Previously, we used ‘Base’ and ‘Target’ as names for two traces that were to be compared with each other. This technical reference has now been altered in favor of a temporal perspective. Using ‘Before’ and ‘After’, the naming is now solely based on the chronological order of both traces. ‘Before’ for the older trace and ‘After’ for the newer one. Regardless of the comparison direction, the traces retain their names. It can be Before ⇒ After or After ⇒ Before.

Why do two traces differ in speed? By comparing them, you can detect why. A comparison of two traces can also make optimizations visible. Does the change I initiated make a difference, regarding speed? This question can be answered by making use of the trace comparison.

Screenshot 6 Release Q1:25

Show muted errors in the UI

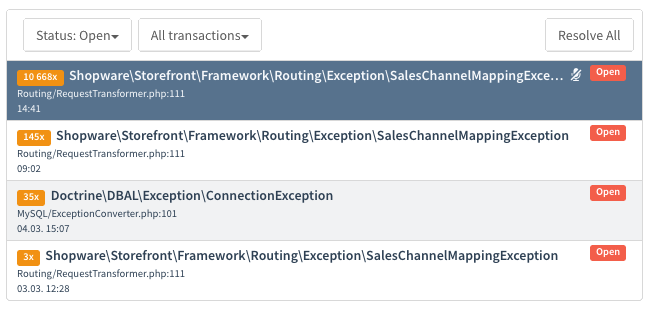
The action ‘Don’t Notify’ for Errors/Exceptions was renamed to ‘Mute’ or ‘Unmute’, and in addition you can now see this in the UI with the crossed-out microphone icon.

Screenshot 7 Release Q1:25

Keep User-Agent for crawlers in trace metadata

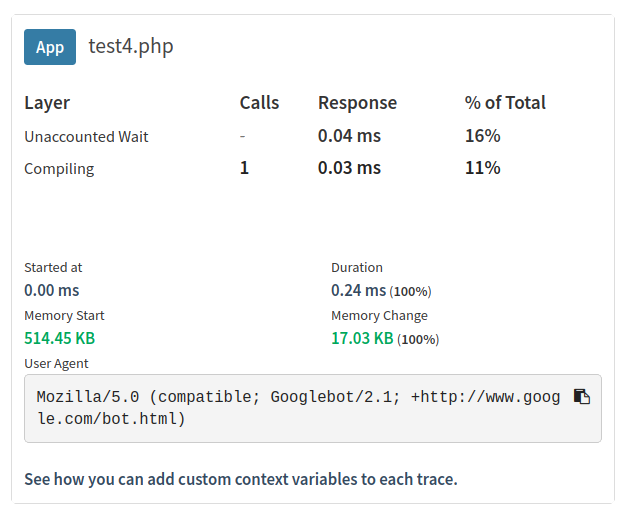
Since Tideways Release 2024.3, Tideways recognizes requests performed by crawlers and adds a ‘Crawler’ tag. For requests tagged ‘crawler’, the full User-Agent will be available on the root span of a trace, allowing you to take action if an undesired crawler makes excessive requests to expensive routes.

Screenshot 8 Release Q1:25

Instrumentation improvements

As always, this Tideways Release includes a number of assorted improvements and bug fixes to the existing instrumentation functionality.

  • The experimental MongoDB instrumentation added in Tideways 5.7.0 replaces the old MongoDB instrumentation as of 5.15.0. The new instrumentation is more reliable and provides better insights into the commands used.
  • Each MongoDB command span now has peer.host and peer.port annotations, indicating the exact server the command was sent to. The mongo.service annotation on the “connect” span was removed, since the MongoDB client dynamically detects the cluster topology, making this information misleading.
  • MongoDB: Logical conjunctions, such as ['field' => ['$gt' => 0, '$lt' => 10]] are now correctly reported in the mongo.filter annotation.
  • HTTP requests performed using cURL multi now unconditionally collect a stack trace when calling curl_multi_add_handle(), pointing towards the location where the request is actually initiated, instead of the curl_multi_exec() event loop.
  • Collect Shopware DAL spans in the EntityRepository instead of the EntitySearcher to catch more cases.
  • A new swdal.criteria.title annotation is available on Shopware DAL spans, containing the result of Criteria::getTitle().
  • The instrumentation for colinmollenhour/credis, which amongst others, is used by Magento now supports the tideways.features.redis_keys feature.
  • Add the cached tag to pages returned from Magento’s page cache.
  • Add automated service detection for WoltLab Suite’s ACP.
  • Symfony Messenger transactions now include a span for each message handler.
  • Improve Callgraph for Doctrine, by disambiguating calls to UnitOfWork::createEntity(), allowing to measure hydration performance per entity type.
  • Instrument Symfony’s ErrorHandler component, allowing to see Exceptions handled by it in Tideways.

You can see these changes listed by PHP extension version on the changelog page.

Time to get started with Profiling! With our free trial.

Tideways 2024.3 Release

We strive to improve clarity and user-friendliness, and have thus focused our efforts on several features that align with this objective. Our new Sidebar Menu, the Release Tracking Feature and an increased comparison range for Releases and Markers as well as the possibility to show error messages in notifications all fall into this category.

Summary:

PHP 8.4 support from the start

PHP 8.4 will be released at the end of November 2024 and Tideways – as always – supports  it from the start with the PHP Extension Release 5.14.0.

The last versions of the PHP extension also added new instrumentations: DNS functions, password hashing and sending e-mails are now visible in the Timeline Profiler.

Turn navigation into an intuitive experience: Our new Sidebar Menu

We are convinced that the new Sidebar Menu improves usability and discoverability and makes the overall navigation experience more intuitive. With an increasing amount of primary features in Tideways, the top navigation no longer provided enough room to accommodate them anymore. A sidebar navigation proved to be the most effective approach to meet this challenge and enhance its user-friendliness.

There are new shortcuts in the sidebar navigation:

  • If you click on the Tideways logo or the organization, a popup will open, allowing you to swiftly navigate between all your organizations and projects.
  • From the footer navigation, you can access user and organization settings.
  • Main features such as Tracepoints, Incidents or Slow SQL queries are now available directly from the sidebar navigation.

In the line of improving our menu, it is now possible to jump directly to the relevant performance details of a trace via the widget “Go”.

We decided to switch to the new Sidebar Menu completely and activate it for everyone by default. You will be able to go back to the old sidebar navigation from the “User Settings” until the end of the year 2024; thereafter, only the new Sidebar Menu will be available.

Compare Aggregated Traces directly from Incident and Release Tracking

What was previously feasible at the monitoring level has now become feasible also at the profiling level.

Now, it is possible to identify the leading cause behind a change in performance, rather than simply observing that a change happened. 

Subsequently, it has become more convenient to compare performance data from two distinct time periods.

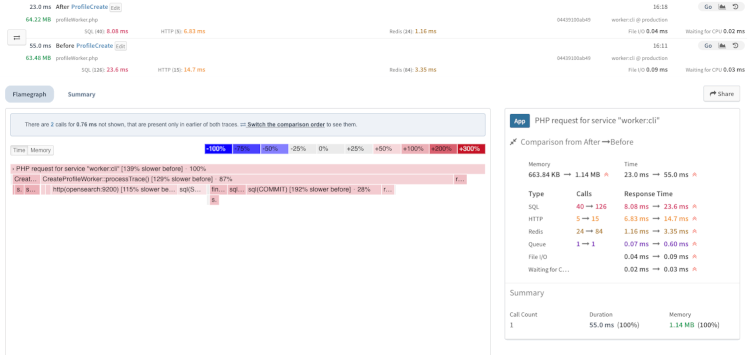
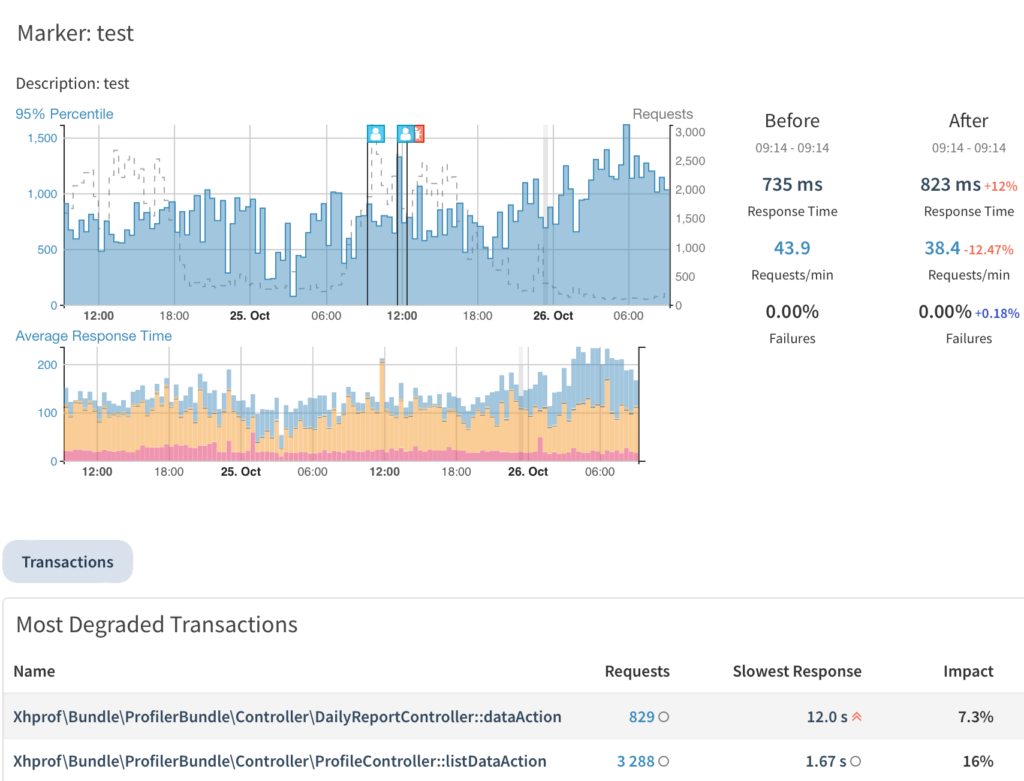
You can instruct Tideways to compute an aggregate of traces from before and after the comparison time and Tideways will immediately show you the differential flame graph that allows spotting the degraded calls such as SQL queries.

There are three possibilities to start into this performance comparison 

  1. Set/Add markers. To display performance before and after a selected date, you can set/add a named marker. This is useful to reference important events in the project lifecycle and allows a swift comparison between the before and after. A significant event could be, for instance, the start of an email marketing campaign.
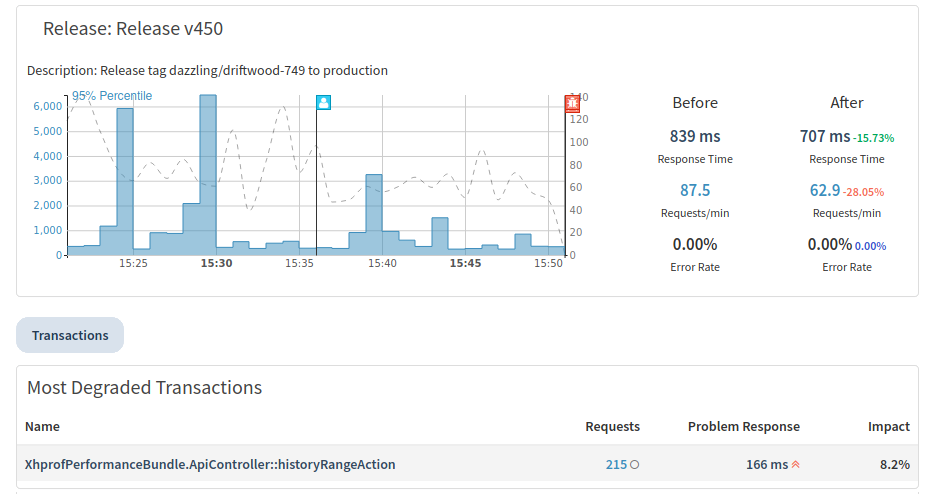
  1. Use the Release Tracking Feature: Since markers do not support automated notifications, the Release Tracking Feature should be used to compare performance prior to and subsequent to releases. You can see a list of recent releases on the left side of the release tracking screen: 

Below the details, which show a before-and-after comparison, transactions for this timeframe are listed:

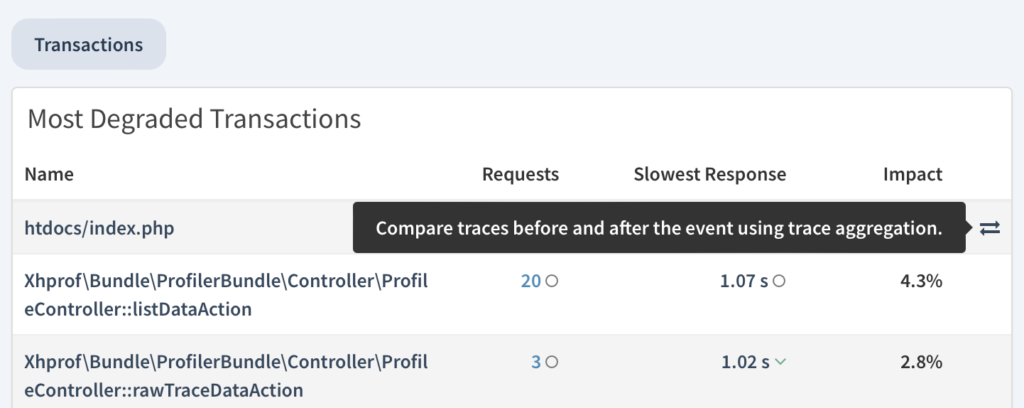
3. Response Time Incident: When a response time incident is triggered the Tideways UI now shows the most degraded and improved transactions in the timeframe before and after the start of the incident.

Increased Comparison Range for Releases and Markers

Comparing data sets from different time periods can be very revealing when you want to evaluate the performance of a website. By extending the time frame from a maximum of 90 minutes to a maximum of one day, a whole day’s worth of data can now be included in the comparison of release events or markers. Fluctuations can be factored out much better, and thus results are more meaningful. You get more insight into what has really changed.

Crawler Detection

Crawlers can be recognized in Tideways and are now displayed with the tag “crawler”. Using filters, only the traces that were triggered by crawlers can be shown.

The identification of crawlers works based on user agents. It is not enabled by default and can be enabled with php.ini configuration change: tideways.features.crawler_detection=1

Allow opt-in to show error messages in notifications

We’re pleased to announce that we’ve built this feature in response to quite a few customer requests and that it’s ready for use now. They asked us to make it easier for them to see exception messages directly in notifications, and we’re delighted to have done that for them.

Exception messages can be the key to determining the cause of an error easily. Since they could potentially contain private data, we initially decided against including them in notifications. 

However, as their importance can’t be underestimated, we now allow toggling to include error messages in email, Slack or Microsoft Teams notifications. The inclusion of error messages remains disabled by default due to privacy concerns.

Don’t get spooked by bad PHP performance. Try Tideways and get your remedy!

Tideways 2024.2 Release

Get the cake, Tideways is turning ten!

Exactly on this day ten years ago, we lifted the veil on Tideways’ predecessor and thus began our exciting journey that continues to this day.

We would like to celebrate by presenting interesting new features to you.

Summary:

You can also watch a recording of our webinar on the topic, where Benjamin connects all these new features into a small story of improving a Shopware 6 plugin.

Differential Flame Graph

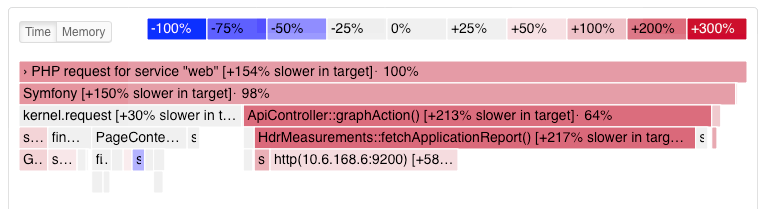
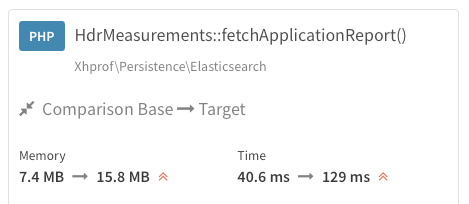
Differential Flame Graphs are a visual representation of a comparison between two sets of profiling data and is a beneficial tool for quickly identifying the root causes of performance problems. To benefit best from the findings, in Tideways they are presented in a comprehensible comparison box which shows the comparison base and the target, a summary and an example span. Unlike before, it’s now possible to see at a glance why a trace has become faster or slower.

It’s useful for instance to check whether a change in the source code, a system update or a configuration change improved performance or brought about a regression. It’s also possible to compare traces from different time periods or of different system states.

The color code depicts the most common way Differential Flame Graphs are presented. Red colors, alert you to an increase in execution time or resource usage. Blue, on the other hand, depicts a decrease. There are different shades of blue and red to depict minor or major decreases and increases. Neutral colors mean that no significant change has occurred.

Our Differential Flame Graph is interactive; you can hover over or click on the different areas to get more specific information.

The high level of detail helps to find an unwanted outlier in time or memory consumption faster.

Share Trace Comparison

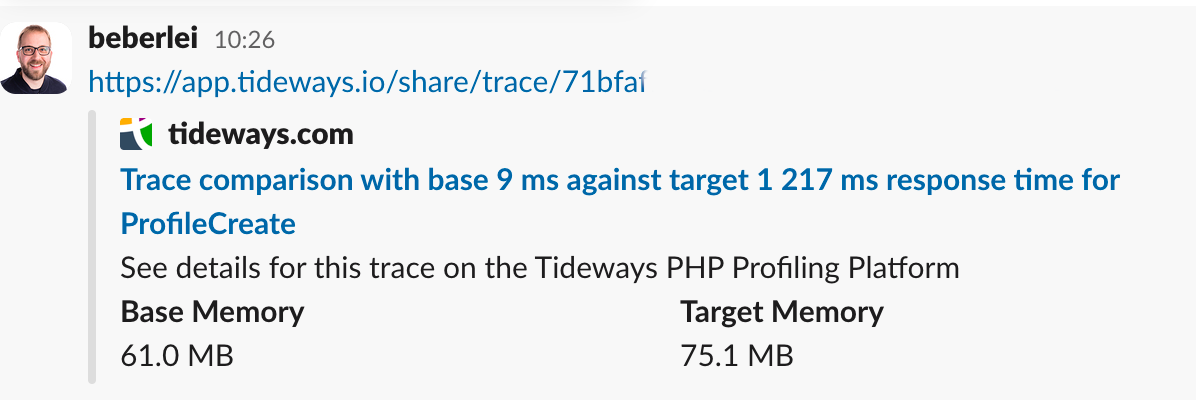
The comparison of two traces can now be shared with persons who don’t have a Tideways account or are not members of the respective organization. This is an immensely helpful addition to the existing feature that already allowed the sharing of a single trace.

You can click the share action directly from a trace comparison and share a link to it. That makes investigating performance problems and validating improvements much easier.

When sharing a trace in Slack or in other chat / social media tools, a preview is generated to offer the message receivers a summary:

Dynamic Instrumentation for Functions from the UI

Dynamically instrumented functions are a new feature within Tideways to improve Profiling data and in turn identify performance problems even faster.

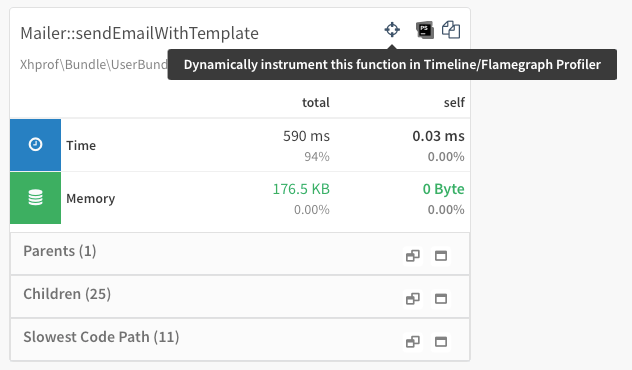
Previously, instrumentation was either defined within the Tideways extensions and could be added by changing the code to use the attribute #[WithSpan]. Now you can add instrumentation to your functions by simply clicking the “Dynamically Instrument Function” button from the callgraph interface. 

No changes in your application code or deployment of a new version needed!

Transaction Failure Rate Alerts

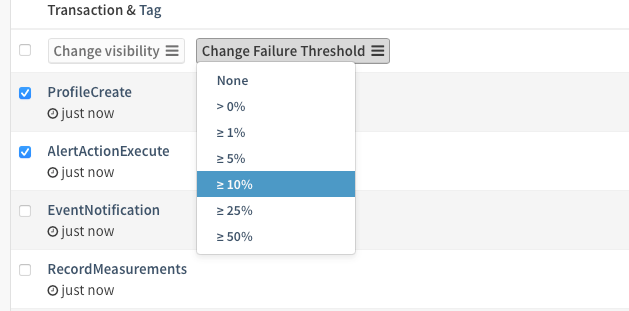
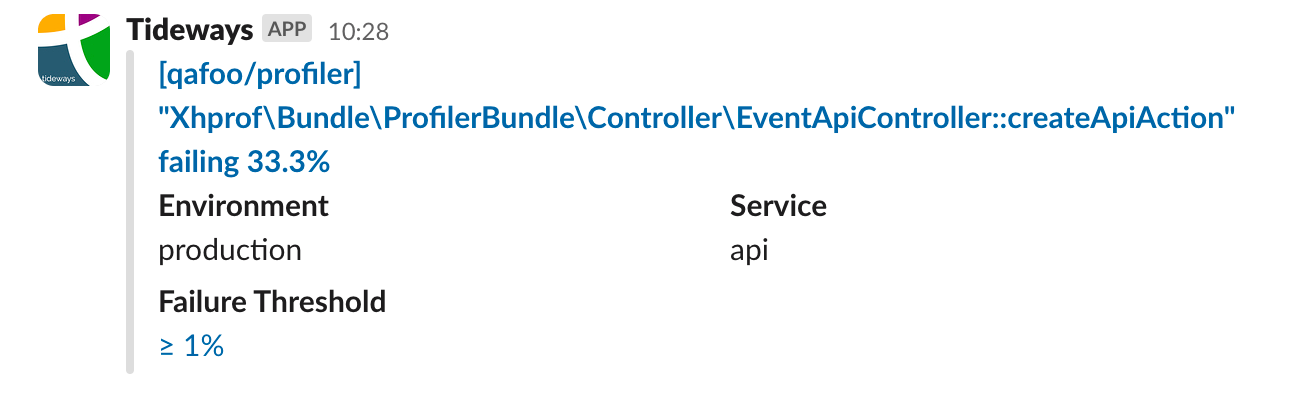
What failure rate is acceptable for individual transactions? To find out what causes errors in one specific transaction, a failure threshold can be set for each individual transaction. The failure threshold is based on a list of predefined percentages and can be configured via the transaction settings page. 

To that end, you can set up a notification under “Project Settings > Notifications”. You then get notified via Slack or email or other supported integrations when the failure rate for a transaction increases and it needs attention to be resolved. 

For more details on how to configure it view our documentation.

IDE Integrations

You can now use the “Open in IDE” icon in Errors and Callgraphs. This makes it easier to directly switch from Tideways into the code and start fixing a bug or performance problem.

At the moment you can configure this integration for PhpStorm and VSCode. For third party libraries you can also directly jump to the code on GitHub without the need to configure anything.

For more details view our documentation.

PHP Extension:

Improved Stacktraces from Third Party Libraries

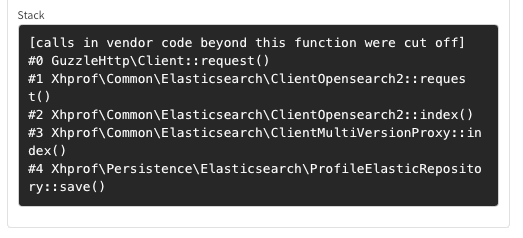
For libraries such as Doctrine, Guzzle and Laravel, stacktraces in the Timeline Profiler are now modified to show primarily frames from your code-base and not from the library. Before, due to the limiting of the stackframes size they sometimes included only frames from the library itself and no indication where in the application they occurred. Relevant ones were sometimes cut off. Now, the stacktrace is cut off to show primarily application-code function calls.

In addition we reduced the default duration for a span to keep its stacktrace from 5ms to 3ms and increased the number of stacktraces Tideways keeps per trace across plans.

FrankenPHP Support

FrankenPHP Tideways

Tideways is the first APM solution that fully supports FrankenPHP, including worker mode. Starting from PHP extension 5.8.0, Tideways supports FrankenPHP.

Worker mode only loads your framework once into memory. Subsequently, it sends requests to the same instance of your application and doesn’t spin up a new instance for every new web request. 

That means that one gives up the shared nothing of for example PHP-FPM or even FrankenPHP without worker mode but saves time and optimizes performance. 

For more details on how to use FrankenPHP with Tideways see our changelog entry and our documentation.

WoltLab Suite Support

Tideways now also includes instrumentation of WoltLab Suite out of the box. The Tideways PHP Extension will automatically detect which type of page of your community has been accessed to automatically fill in the transaction name, making the collected data useful without requiring manual changes on your end.

You’ll never know until you try … our free trial!

Optimizing Shopware 6 Checkout Performance with Callgraph Tracepoints

A few weeks ago, Andrey from Ecommlab contacted me to ask me about a strategy to get performance insights from Tideways into Shopware 6 checkout. 

The store of our joint customer “Bär Schuhe” was slow for customers during the order confirmation process.

Optimizing checkout performance is important but much more difficult than product or category pages for two reasons:

  • Customers do not visit them nearly as often as they view products/categories.
  • As a developer it is difficult to put them into production without causing payment transactions and order cancellations in the ERP system. 

In this blog post, we will go through an optimization of the order confirmation step in the checkout process, reducing the 95% percentile performance from 1-2 minutes to 6-9 seconds.

Identifying the Bottleneck with a Callgraph Tracepoint

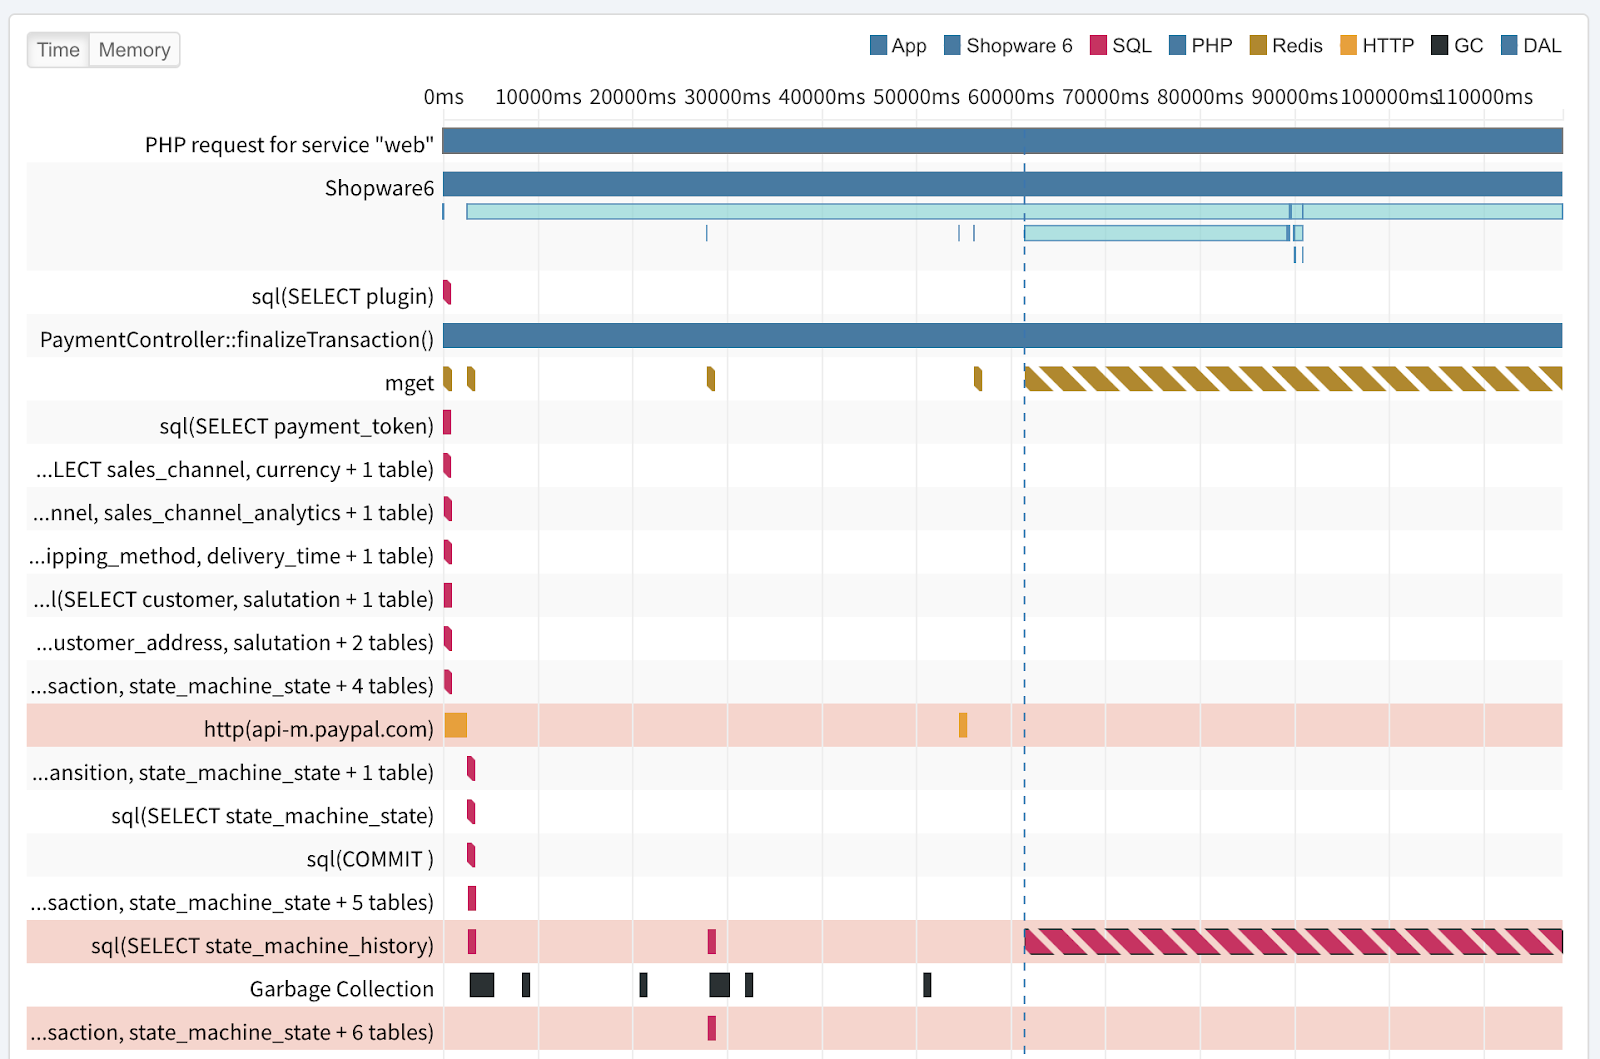
Looking at Timeline profiling traces collected from customers of the “Bär Schuhe” store, nothing immediately jumped out as a bottleneck.

To get more detailed profiling data at the function level, we created a callgraph tracepoint and, after waiting for the results, examined the slowest collected callgraph to identify the bottleneck. 

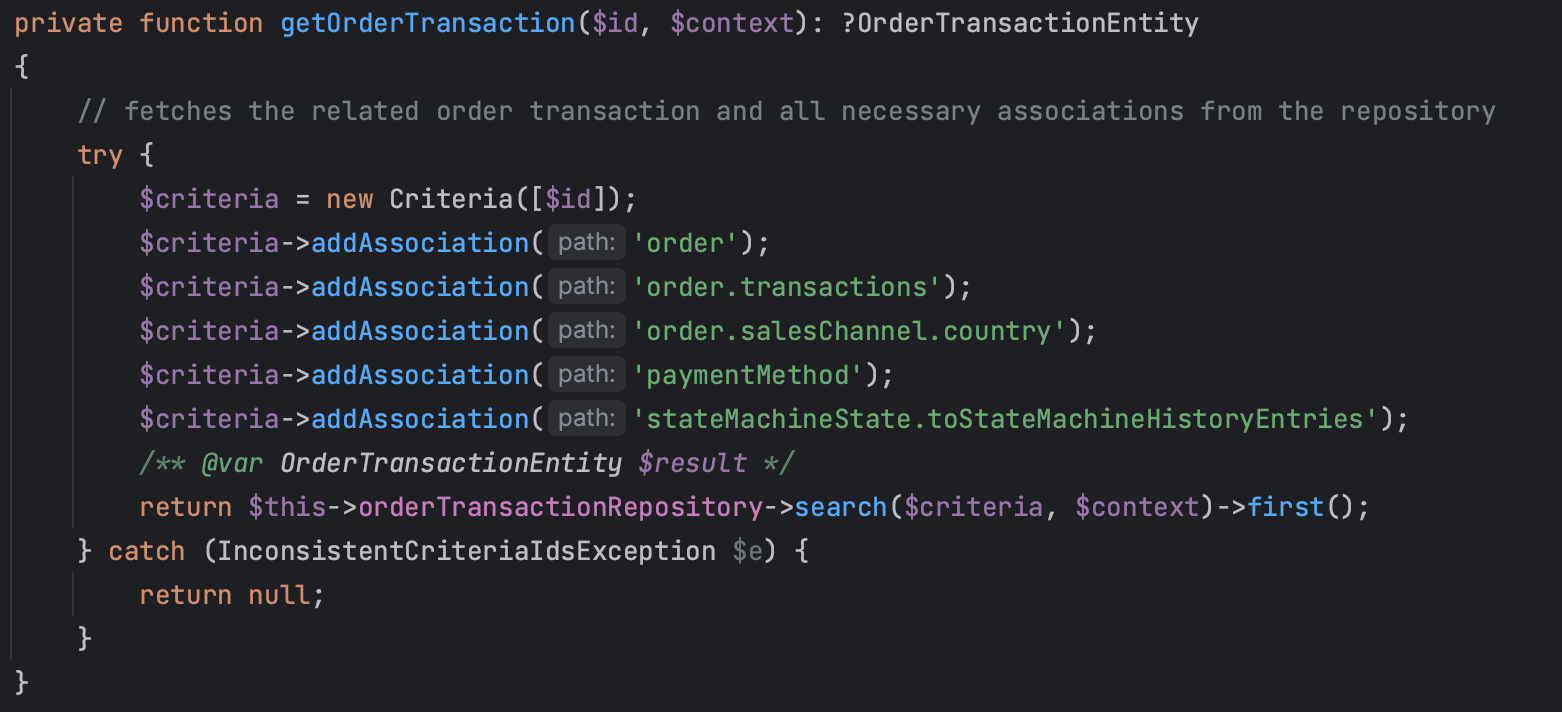
One plugin stood out, taking 66% of a 45-second request and causing approximately 50,000 objects to be created from database rows. This is a custom plugin that connects the store to the ERP system. The combination of slowness and excessive database load warrants an investigation of the plugin’s code:

There are a lot of associations being eagerly loaded for the order transaction, which makes us wonder which one is responsible for the majority of the 50,000 or so database objects being created. 

Comparing this piece of plugin code with other places in the Shopware core and available plugins, we determined that the bottleneck is most likely caused by eagerly loading the state machine history.

Confirming the Optimization Works

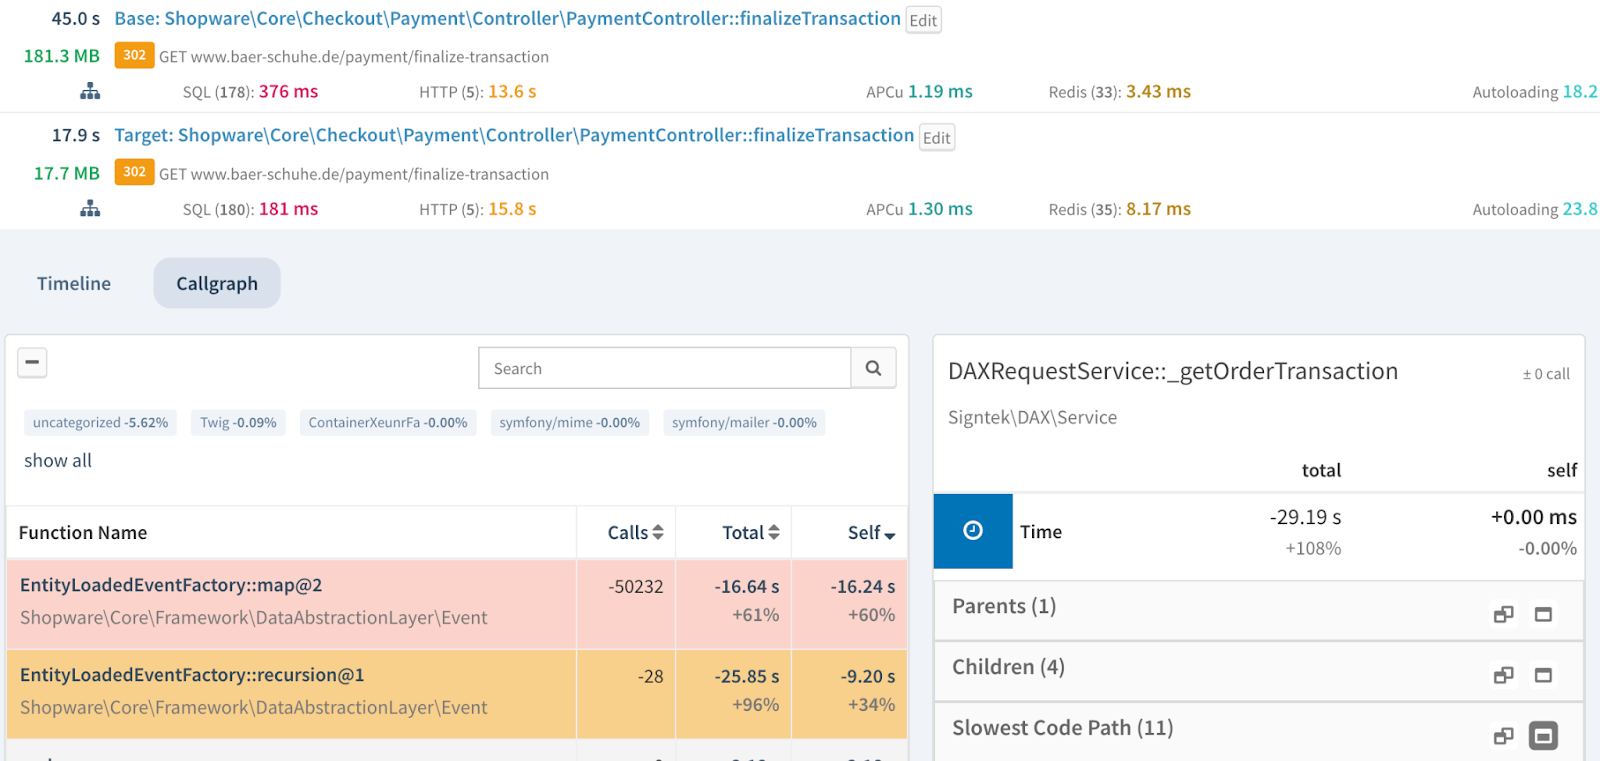
Andrey confirmed that removing this line did not break the code and rolled it out to production, where we confirmed our hunch: Performance for the order completion step of the checkout dropped from up to 2 minutes to a maximum of 17 seconds. 

The following comparison shows that the plugin code is now 29 seconds faster overall, and that the creation of 50,000 database objects was reduced, accounting for the majority of the time savings, 16 seconds.

Conclusion

This solves the biggest performance bottleneck in the order confirmation process code with a one-line change. 

Further improvements to the checkout were made to bring the user experience to an acceptable level, but each had a much smaller impact overall than this one.

This shows how based on insights from a Profiler, you can start optimizing the biggest bottlenecks first and minimize the time spent optimizing.

For a quick read, you also find this Case Study as a pdf here:

What an AI would never be able to tell you the way we can! Follow us on LinkedIn or X and subscribe to our newsletter to take a deep dive into technical issues surrounding PHP performance.

You’ll never know until you try … our free trial!

Tideways 2024.1 Release

You can now unpack the Christmas present that was promised to you at the end of 2023! As you may have already read in the Flamegraph Feature Preview, this exciting new feature of the Profiler is now the focus of our first release in 2024.

The Flamegraph complements the Timeline and Callgraph features and visualizes Aggregated Traces. The goal was to provide profiling information across many traces and thereby gaining new and deeper insights into performance. The aggregated spans the Flamegraph makes visible in its easy-for-the-eye color scheme are very useful to get a representative average over many samples.

Summary:

Aggregated Traces

Tracepoints can now paint a representative average picture for all its traces. This gives a statistically more correct view of the trace by smoothing the effects of outliers.

Tideways computes an aggregated summary trace by averaging the data from all collected traces. The aggregated traces are visualized with a Flamegraph and thereby make an in-depth performance analysis possible.

When callgraph data is available for the tracepoint, these are also averaged in the aggregated trace.

This feature is only available to customers with current Tideways plans.

More information:

Feature Preview: Flamegraphs

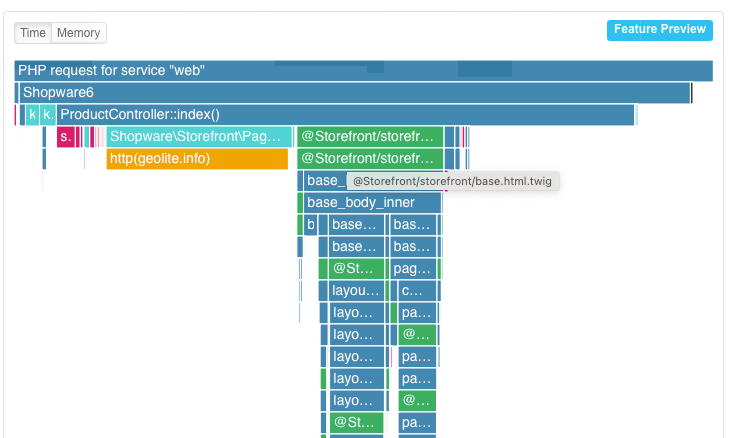
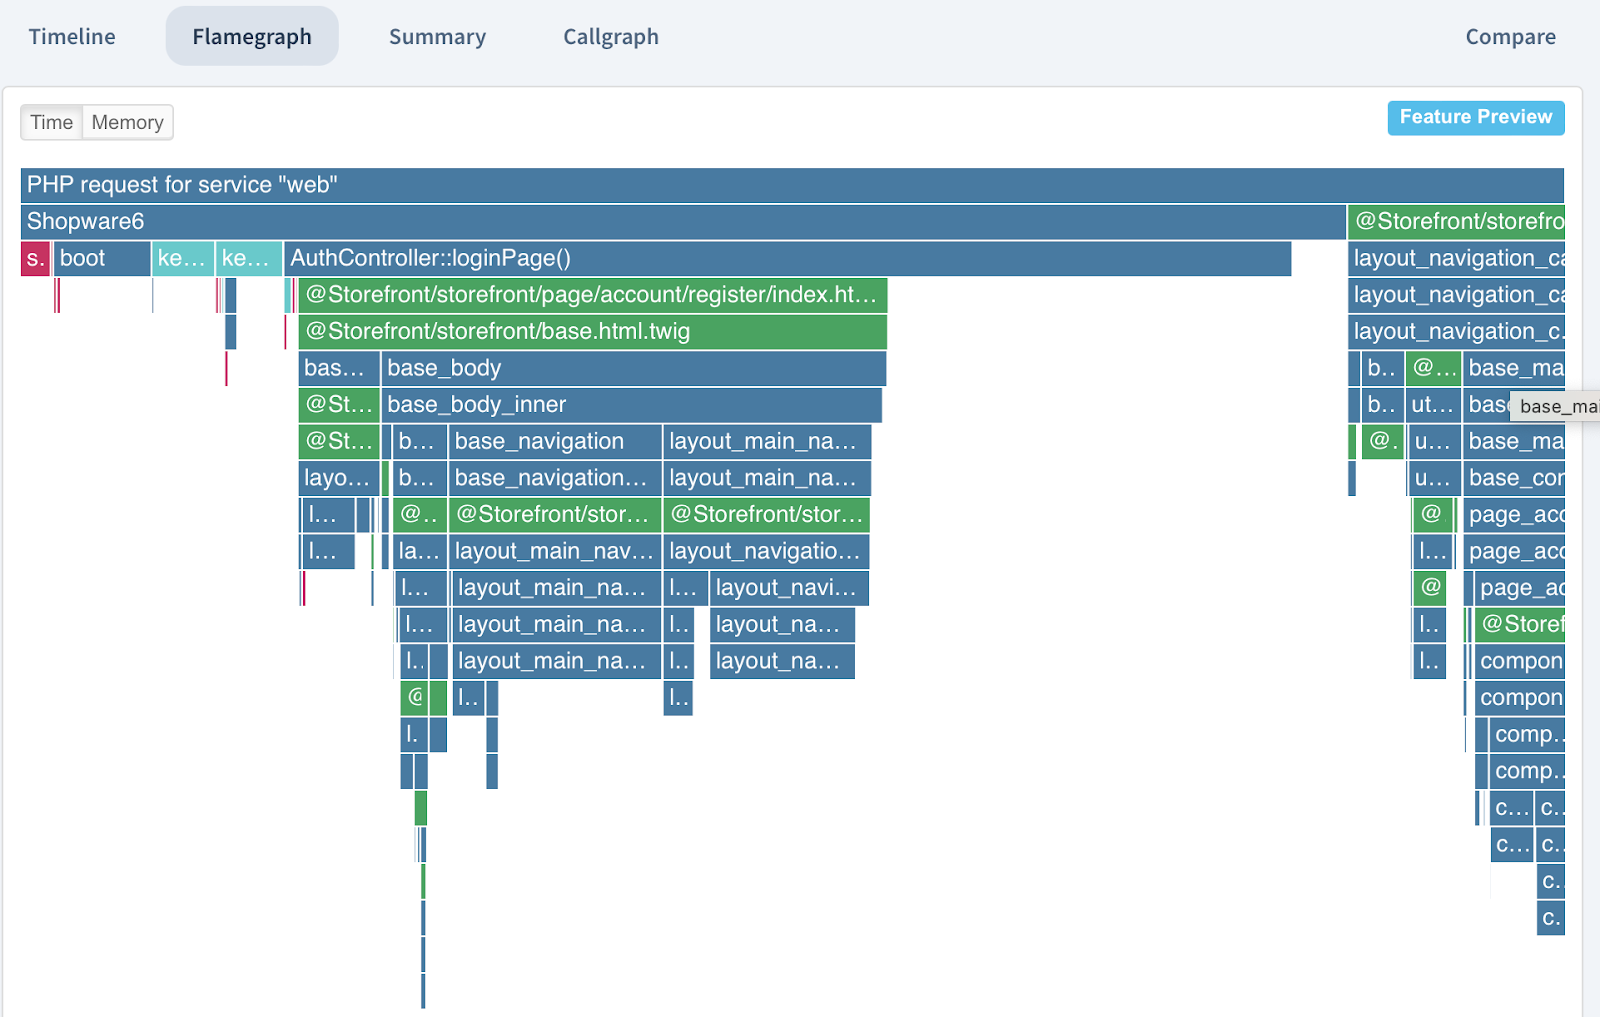
The new Flamegraph Feature gives you a different visualization of existing data than you currently have with the Timeline spans and as such is a useful tool to measure time and memory consumption. It’s a well-known visualization, as it is used in many other performance tools. Tideways uses the inverted “icicle graph” which helps to avoid scrolling when starting at the top. For complex Timelines, Flamegraphs are usually more compact, since they aggregate lots of small spans of the same category into one frame.

We are planning to make improvements to the PHP Extension to supply more and more detailed data before we mark this feature as complete. For now it’s marked as a feature preview in the UI.

More information:

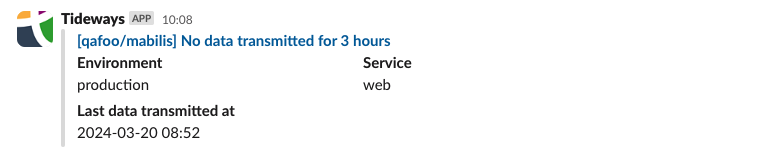
Missing Data Alerts

This feature proactively notifies you when there is no data flow, it identifies gaps or interruptions in data collection, thereby ensuring the reliability of data-driven processes.

For new projects created since early March it is activated by default for a timespan of 24 hours without discernible data flow. 

For existing projects the alert has to be created under Project Settings > Notifications for now. We plan to automatically create it for all existing projects in the next few weeks.

You can create and change that under “Notifications” and choose between different time periods of 1 to 24 hours, according to your specific business requirements. It helps you to quickly identify issues to minimize disruptions and improve operational resilience.

More information:

Ignore Control-Flow Framework Exceptions

Tideways now ignores a preselected list of framework exceptions by default that were used for control-flow and not to signal an actual error. 

This solves the problem that exceptions such as Symfony’s NotFoundHttpException or Shopware’s CustomerNotFoundException would create many entries in the exception tracking, including notifications, and a Tideways user would react to them by ignoring them, being distracted, or finding the button to ignore them.

Now we turn this around, these exceptions are ignored by default but if you need to see them you can configure that in the Project Settings => Exception Tracking => Ignored Exceptions menu.

Feature Preview: Sidebar Menu

We also implemented the Sidebar Menu which is aimed at improving usability, discoverability and making our overall navigation experience more intuitive. What’s more, the Sidebar Menu leaves more room for the profiling information. 

At present, both menus are available and the Sidebar Menu can be tested but due to the various advantages we are considering switching to the Sidebar Menu completely. Every user can take a look at the new layout by switching to it in User Settings: There you’ll find a button “Enable Sidebar Menu” under “Feature Preview: Sidebar Menu”.

PHP Extension 5.7 Release

To derive the most benefit from the new features it is necessary to install the latest version of the PHP Extension. We improved the quality of the PHP Extension 5.7 so that all our new features can be used to their fullest to support you in the best possible way.

New Shopware 6 Instrumentations

Tideways now has improved Shopware 6 instrumentation. Important functions of the Shopware API on product detail, category and other core pages are automatically instrumented with spans in the timeline to provide better context.

In addition, we have made Tideways compatible with the upcoming Shopware 6.6 release.

RdKafka Instrumentation

Tideways 5.7 includes instrumentation for Kafka producers using the rdkafka PHP extension. You’ll now start to see various Kafka-related spans within your timeline.

\Tideways\Profiler::markAsCliTransaction()

Tideways already automatically separates transactions using PHP’s CLI interface into the separate :cli service to prevent long-running cleanup tasks from skewing the number of web requests, making the performance profile incorrect for both the regular requests and the cleanup tasks.

As the CLI interface might not be available with all hosting providers, it forces them to run such cleanup tasks by means of a regular HTTP request. This will most likely intermingle them with the regular web requests by default.

Calling the new \Tideways\Profiler::markAsCliTransaction() method will cause the current request to be sorted into the corresponding :cli service, just as if it was executed using the CLI interface. Shopware 5’s web-based cronjobs are automatically detected to make use of this new functionality.

MongoDB Experimental

We improved the instrumentation support for MongoDB. You can now see the exact query that was sent. Query parameters are eliminated so that we can guarantee no personal information is transmitted to Tideways.

tideways.enable_cli now defaults to 1

The INI setting tideways.enable_cli now defaults to 1 instead of 0. Nevertheless, you can disable it and change it back. We are changing this default, because many users do this change eventually themselves already, often in response to struggling why no traces are collected on the CLI.

tideways.dynamic_tracepoints.enable_* now default to 1

Another improvement concerns the INI settings tideways.dynamic_tracepoints.enable_web and tideways.dynamic_tracepoints.enable_cli which now also default to 1 and will be activated with the next update. We are changing this default, because the tracepoints feature has been available for several years, many edge case problems have been addressed and we see no risk in activating it by default.

macOS Builds

Just to remind you that Tideways can be installed on macOS M1/M2/M3 (ARM) and Intel systems with the help of Homebrew, including the installation of PHP Extension, Daemon and CLI. We outlined for you how to get started with Tideways on macOS with Homebrew.

Docker Image for tideways-daemon

There is now a public docker image to use for the tideways-daemon where we previously only provided a Dockerfile in the documentation. The image is available under ghcr.io/tideways/daemon and we have updated the documentation to show it used with Docker and docker-compose.

Documentation: Install with Docker

Flamegraph Feature Preview Christmas Present, Thank you for 2023!

As a Christmas present, we have started rolling out a new feature for the Profiler: flamegraph rendering in addition to the existing Timeline and Callgraph. This is a feature preview and will see more changes in Q1 of 2024. For now, only customers with the most recent plans (Tideways 6) can access them, or you can view them in traces of the „demo“ organization.

Let us know what you think of it!

This also gives you a first insight into our roadmap for 2024, as we plan to build on the flamegraph view to provide profiling information across many traces. We are looking forward to it already!

The Tideways team wishes you merry Christmas, happy holidays and a successful “slide into the new year” as is German custom.

As in previous years, every Tideways employee could choose their own purpose and so we donated 500 € each for

  • Doctors without Borders (German Chapter) is a charity that provides humanitarian medical care
  • Kältehilfe Berlin helps homeless people in Berlin who are threatened by cold or hot weather with food and a bed to sleep in.
  • Zonta Club Bonn – is a service organization with the mission of Building a Better World for Women and Girls, in support of Sustainable Development Goal 5
  • Robin Good is a family fund in Bonn supporting kids and their families that are living in poverty. They provide financial help to pay for school trips, school bags or for other emergencies.
  • ZeSaBo: The charitable Central Warehouse for Donations in Bonn (ZeSaBo) accepts donations and makes them available free of charge to private and institutional customers who care for people in need.

Tideways 2023.2 Release

Since our last release announcement in April we have been working on a number of new features for Tideways that we are now happy to share with you. This is the second and final release for 2023.

From here the team will be looking ahead to 2024, the 10th anniversary of Tideways’ launch, and preparing some amazing new features and improvements.

Summary:

  • PHP 8.3 Support
  • #[WithSpan] Attribute
  • Redis Instrumentation Improvements
  • Automatic Service Detection for Shopware 5, 6 and Magento 2
  • Report PHP Notices & Warnings
  • Related Errors for Failure Rate Incidents
  • Support for Previous Exceptions
  • Transaction Failure Rates Beta
  • Trends of SQL, HTTP and other layers in History
  • Slack App

PHP 8.3 Support

PHP 8.3 will be released next week, on November 23rd 2023 and Tideways supports it from the start with PHP Extension release 5.6.4.

#[WithSpan] Attribute for Custom Instrumentation

Starting with Tideways PHP Extension 5.6 the attribute #[WithSpan] from the Tideways\Profiler namespace is available to automatically create a custom span for the Timeline Profiler during Profiling.

Redis Key Instrumentation 

When setting the new INI option „tideways.features.redis_keys=1“ in your php.ini, Tideways will now keep the key for every Redis operation and show them in the Timeline Profiler.

Automatic Service Detection for Shopware 5, 6 and Magento 2

Previously Tideways already had automatic service detection for Shopware 6, and with the extension 5.6 release this is extended to Shopware 5 and Magento 2.

With the automatic service detection, transactions for backend/API of these three e-commerce systems are assigned to a second service „api“ or „backend“, depending on the system.

The automatic service detection has lowest priority and you can always overwrite it by setting tideways.service ini, TIDEWAYS_SERVICE environment variable, call \Tideways\Profiler:.setServiceName at runtime or by simply disabling automatic service detection with „tideways.features.automatic_service_detection=0“.

Reporting of Notices and Warnings

Tideways now supports reporting of notices and warnings as part of the Error Tracking, completing support for the various types of errors that a PHP script can produce. 

Support for reporting notices and warnings is disabled by default and needs to be activated by setting tideways.features.warnings=1 and/or tideways.features.notices=1.

Support for Previous Exceptions

The Tideways PHP Extension now reports all previous exceptions in addition to the exception that crashed a request. The stacktrace of the previous exceptions and their messages are shown in the UI now.

Transaction Failure Rate Alerting (Beta)

In addition to service-level failure rate alerting, Tideways now supports failure rate alerting on the transaction level. This has many different use-cases, for example:

  • strict zero-error cronjob monitoring
  • better identification of failing project features that would not raise the service-wide failure rate. 
  • individual alerting in combination with response time targets – a feature released earlier this year.

In addition related errors that could be the cause of the increased failure rate are displayed for these incidents. Service-wide failure rate notifications also include Related Errors if available.

This feature can be activated from the Beta Features organization settings before it can be used. 

Trends of SQL, HTTP and other layers in History

The weekly report already included a report of the downstream layer performance of each service and a comparison to the previous week. This information is now also shown in the Trends section of the history report and allows a comparison on the day, week or granularity level across the complete retention of history data for a project.

Slack App for Tideways

You can now integrate notifications from Tideways with a Slack app – in addition to the previously available support using the legacy “Incoming Webhook” integration. This provides admins of the Slack workspace more control when integrating with Tideways.

Tideways 2023.1 Release

In the 4 months since the last release (2022.4), we have been working on a number of new features and improvements that we are pleased to share with you today as part of our 2023.1 release of Tideways.

In addition to the new features, we also revamped our pricing and plans at the end of March under the umbrella of “Tideways 6”. The main difference is that all plans now include all features and are now limited by transactions as the primary metric.

Summary:

Monitoring for tagged transactions

In 2022.3 we added support for cached and uncached tags assigned to traces. As part of the Tideways 6 release, we are extending this feature to monitor tagged transactions individually. You can view the minute-by-minute performance of the transaction as a whole and broken down by any tags assigned.

In addition to the “cached” and “uncached” tags set automatically for Shopware 6 projects or via the markPageCacheHit/markPageCacheMiss APIs, the PHP extension now includes a new Profiler::setTags() function for setting up to 3 tags per request.

More Information:

Performance Budgeting with Response Time Targets

In preparation for supporting performance budgeting, we renamed “Errors” to “Failures” in the previous release. With the addition of Response Time Targets, Tideways can now mark requests as failed if they take longer than a configured response time in milliseconds.
This configuration is available at the service level and, with the new Tideways 6 plans, at the transaction level.

Combined with the existing failure rate notifications, this enables fine-grained performance budgeting and alerting.

More Information:

Profiling Spaces

One of the missing pieces in Tideways’ organization, project, and pricing is a space where you can collect profiling data for any PHP script you want to test around, analyze open source code you depend on, or small projects that are not monitored.
With the new Tideways 6 plans, we are introducing Profiling Spaces as a secondary mechanism for grouping profiling data besides projects.

In a Profiling Space, you can only trigger traces via Chrome Extension, CLI or Magic Query parameters.

A limit of profiles per day depending on the selected plan is the main restriction in the use of profiling spaces.

More Information:

Trace sharing

You can now share traces with people outside your organization. Each trace has a Share Trace button that initiates the process. You configure the duration of the sharing and a unique link is generated that requires no authentication to view.

For existing organizations, only administrators can share a trace at this time. You can change which users are allowed to share in the organization’s user settings.

For new organizations created after this release, all users can share traces by default.

More information:

Performance improvements for multi-host projects

For projects with a large number of hosts, starting with 5 or more, we have added an additional aggregation step for the monitoring data, which significantly improves the performance of the UI for the service and transaction monitoring screens. When looking at a 24-hour time frame of the project this often shaves several seconds off the response time.

Variable Timeframe in Error Count Chart

In addition to showing hourly error counts for the last 3 days, the Error Details screen now has the option to show minute-by-minute data for the last 2 hours, or longer time frames of 5, 14, or 30 days (depending on the retention days of the project license).

Tideways 2022.4 Release

This post contains a comprehensive list of all the features that we worked on and deployed over the last 3 months, all included in this 2022.4 release.

PHP Extension

We have released PHP extension version 5.5.12 with the following changes:

PHP 8.2 Support

The end of the year brings another new PHP version 8.2, due to be released on 7th December 2022. Tideways is already fully compatible with PHP 8.2.

This is the first PHP release that includes work sponsored by the PHP Foundation. Tideways is a major sponsor of the foundation and we are very proud to support the PHP language by funding developers to work on it. In fact we have increased our support to $15.000 this year.

One notable change in PHP 8.2 that affects Tideways is the improvement of the Observer API to include internal functions, which should further reduce the overhead of Tideways in Callgraph mode.

Monitoring

Rename “Errors “to “Failures”

The “Errors “metric used in Tideways’s monitoring, weekly report, and history components is now named “Failures”.

This is done primarily to avoid confusion with the Errors/Exception Tracking due to slightly different semantics.

“Failures “in the monitoring component can either be:

  • Requests aborted by Exceptions or Fatal Errors
  • Requests sending an HTTP status code of 500 or above (without exception)

Default Service of new projects is now “app”

Previously the first and default service of a new project was called “web “.

We changed this default to “app “for all new projects created since October. Existing projects will keep “web “as their default service if in use.

This rename is due to a change in the service feature we are currently preparing and to increase clarity for users.

Splunk OnCall (VictorOps) support for alerting

Customers can now integrate with Splunk OnCall (formerly VictorOps) to send notifications.

Documentation: Splunk OnCall

Profiler

Filter Traces by specific Day

In addition to selecting traces by pre-defined ranges such as “Last Day “or “Last 7 days “, users can now filter traces by a specific day.

Account Management

Two-Factor Authentication

Tideways now supports adding Two-Factor Authentication to user accounts. In addition, organization admins can require all members of an organization to use Two-Factor authentication for access.
Documentation: Two-Factor Authentication

Single Sign On with Azure Active Directory

Tideways now supports Azure Active Directory SSO. Contact [email protected] to get access to this feature.
Documentation: Azure AD SSO

Improve Settings Visibility for all members of an organization

The current settings of an organization and its projects are now visible to regular and privileged users. This helps users to understand how Tideways is configured so that they know when and how to ask an admin for changes.

Tideways 2022.3 Release

In this post we post a comprehensive list of all the features that we have worked on and deployed over the last 3 months, all included in this 2022.3 release.

Monitoring

Page Cache Hit Rate for Services and Transactions

Monitoring for services and transactions now supports calculating the hit rate for PHP-based page caches. For example, if you have a full page cache storing the HTML on the filesystem, Redis or any system, then using the Tideways Profiler API, you can mark a response as cache hit or miss. The hit rate is then calculated on the service and transaction level automatically:

For Shopware 6 applications, automatic instrumentation into the Page Cache API is provided so that no code changes are necessary to calculate the cache hit rate.

In addition to the monitoring, there is also a new observation for the page cache hit rate, letting you know if it’s not doing it’s job. You can find more information in the Page Cache Hit Rate observation documentation.

One more for Shopware 6, there are extras; the product and category details pages have their own page cache hit rate observations.

Change the Default Environment Name

The environment support in Tideways previously had the hardcoded default environment “production” that received the primary load of traces. It is now possible to change the default environment to something other than “production”. See the documentation on how environments work and how to configure them if you want to make use of this change.

Profiler

Tagging Traces as Cached or Uncached

Using the page cache hit rate API introduced in the previous section, traces that are either cached or uncached are tagged as such in the trace list and details now:

There is a new filter “Tags” so that you can select “Cached” or “Uncached”. We are planning to add other tags and an API to add custom tags.

Callgraph Profiler: preg API regular expression profiling

With PHP Extension 5.5.8, the Callgraph Profiler includes support for argument capturing for the PHP functions preg_match, preg_match_all, preg_replace and preg_split. These functions are often performance bottlenecks due to inefficiencies in the patterns combined with their excessive use. By capturing the first 30 characters of all patterns, we group the functions in the callgraph, making it much easier to identify which regular expressions are performance bottlenecks and which are not.

Timeline Profiler: Shopware 6 Data Access Layer

The Timeline Profiler now includes timespans for the Shopware 6 Data Access Layer, similar to our instrumentation of Doctrine or Propel ORMs. For product and category DAL this even includes the Criteria query.

Exception Tracking

Resolve All Errors

We added a “Resolve All” button in the exception tracking list that allows resolving all open errors. This action only applies to the currently selected environment, service and optionally transaction(s).

This can be helpful when you want to reset the notifications and occurrences without having to create a release event.

Exceptions across Environments

Exceptions will now be tracked separately by environment starting October 1st 2022. The change is dated since its a backwards incompatible break from the previous behavior. You can opt into the feature using the “Beta Features” section of Tideways.

This change to exceptions by environment includes occurrences, stacktraces and notifications. When you are using different environments, then enabling this feature will initially trigger new notifications for all errors in non-production environments.

When triggering a release for an environment and service, only errors of these will get reset and notify again, according to your notification filter settings.

Chrome Extension

Building on the changes in the 2022.2 release, we have improved the Chrome Extension further:

  • Show that profiling is still in progress when triggering traces for the next 15 or 60 seconds. This provides better feedback about the current state of a profiling session and prevents the trigger buttons from being clicked multiple times and causing confusion.
  • Improve rendering of projects and previously collected traces in the Chrome extension popup screen.

Your chrome extension was auto-updated to version 1.5.2 a few weeks ago, which already includes these changes.

Commandline Interface (CLI)

We have relased the tideways CLI tool as version 1.0.0 now, it required very little changes and bugfixes in the past years, so that a 0-point version number does not communicate the stability of it well.

One user facing changes is included in this release:

  • Bugfix: Always query backend for traces, even when executed PHP command failed with non-zero exit code. This is important when running for example phpunit, psalm or php-stan under Tideways profiling, while they throw errors.

Tideways 2022.2 Release

In this new release, there are changes to many different parts of the Tideways stack. This includes new releases to the PHP extension (5.5.2), daemon (1.7.26, 1.7.28), CLI (0.4.6), and Chrome Web Extension (1.5.1).

Add Generic Markers to Charts

In addition to the existing Release and Deployment events, it is now possible to add generic markers to the performance charts to indicate an event for example “Beginning of E-Mail Marketing Campaign”, or “OpCache Configuration Change” or “MySQL Upgrade”. Performance before and after the marker event is comparable to allow investigation of its effects on the application.

You can create markers through a new button called “Add Marker” that is now present on the Application/Service performance screens and for selected snapshots. In addition, markers can be created through the event REST API or the CLI.

Smarter Long SQL Statement Truncation

SELECT statements longer than 4000 characters are now using a smart parser in the PHP extension to keep all parts beginning with the FROM clause instead of the column list during truncation.

Before the new version 5.5 release (May 2022) of the PHP extension, very long SQL statements were truncated to 4000 characters to reduce the payloads sent from PHP extension to the daemon over socket or TCP/IP. This could produce truncated SELECT statements that did not include the FROM, JOIN or WHERE parts because the column list was already very large, for example including a subselect or entities with many fields in Doctrine ORM.

Chrome Extension shows triggered traces

The Tideways Chrome extension will now store links to the resulting traces when using the “Take Profile” feature. This will allow you to keep going back to the last ten recently generated traces by clicking on the Tideways extension icon inside Chrome.

Before this change, it was necessary to click on the traces immediately in the popup to avoid losing the links.

Navigate between Referenced Traces

When you trigger traces through the Chrome extension, CLI or tracepoints, all traces include a shared reference UUID generated at the time and stored in our database. The trace view screen now has a new tab called “References”, which shows all referenced traces.

New and Updated Instrumentation in PHP Extension

The version 5.5.2 release of the PHP extension includes a few other notable changes:

  • The transaction name of cached requests in Shopware 6 is now correctly detected. Previously the fallback transaction name “public/index.php” was used.
  • We improved the Symfony instrumentation for event listeners and transaction name detection.
  • Improved Laravel exception tracking support
  • A bug was fixed for curl multi instrumentation incorrectly batching spans together, leading to information inaccuracy in the Profiler.

Other notable changes

There are a few other notable changes:

  • The Performance Metrics REST API was improved to include median and all downstream layeImproved The Performance Metrics REST API to include median and all downstream layers in the response.
  • The weekly report and export charts now show the requests as a second y-axis.
  • Updated the CLI tool to allow sending events for any environment via the –environment flag. Previously the environment was hardcoded to “production”.
  • SQL Connect operations are now identified as “CONNECT” in the Timeline Profiler instead of “OTHER”.

Tideways 2022.1 Release

This new release of Tideways includes tracking exceptions with codes, improved notifications, improved trace filtering and sorting, several new features for the Callgraph Profiler and changes to the PHP extension.

Exceptions with Codes

Previously when an exception was tracked by Tideways that had a non-zero Exception code, then this code was not transmitted to Tideways as additional debugging information. If your application code uses Exception codes to convey information this then from PHP Extension 5.4.36 and daemon 1.7.24 Tideways will collect and show it:

Improved Notifications

A few improvements to notifications are in this release.

The response time and error rate notifications now only trigger if a minimum number of requests / minute threshold was crossed. This avoids flapping notifications during the times your application has low traffic, for example nights and weekends. For all existing notifications the threshold has been retroactively set to 10 requests / minute, for new ones it starts at 25 requests / minute.

For the New Error/Exception notification there is a new filter to notify or suppress errors by their lifecycle status: New, Reopened or still open after release.

Notifications sent to integrations also include this lifecycle kind in their messaging:

Lastly, when previewing an integration in the configuration, there is now a visual feedback the preview was triggered.

Improved Trace Filtering

In addition to pre-defined ranges of milliseconds, the response time, SQL duration and other response and count based filters in the Search Traces UI now allow to specify custom ranges with minimum and maximum values.

In addition to sorting by date or response time, traces can now be sorted by Memory Usage:

New Features in Callgraph Profiler

The folding of function calls has been improved by rendering dedicated nodes in the callgraph that state “number of folded calls (click to expand)”. This textual representation gives a much better clue what call folding is about and how you can work with it in the callgraph. By clicking on a folded call notice, the hidden calls in the chain will become visible.

The Profiler now gives a little hint about compiler optimizable functions. To avoid falling into a micro optimization trap, this hint is only shown when the calls are responsible for at least 5% of a requests response time, starting at which case the compiler optimization could realistically provide a benefit.

The Tideways reference documentation contains a new page explaining Compiler Optimized Functions in detail and how to automatically benefit from this optimization by using php-cs-fixer.

New and Updated Instrumentation in PHP Extension

With the release of PHP Extension version 5.4.38 and two previous releases in the last few months a number of new automated instrumentation is now included in Tideways:

  • Support for detecting the Glue API service in Spryker based applications
  • Support for argument capturing entity names from Shopware 6 Data Access Layer APIs (Changelog)
  • Elasticsearch Query Payloads now get truncated to a maximum of 4000 characters to avoid extremely large search queries from slowing down serialization and transmission of traces to the daemon and breaking rendering in the trace UI.
  • Timeline Profiler Spans created with the programmatic \Tideways\Profiler::createSpan API now receive special handling in the UI and are clearly marked as using the custom API.

Shopware 6 Benchmarking

In collaboration with Shopware we have released the first beta version of a new open-source tool for benachmarking and load-testing Shopware 6 stores using pre-defined and configurable scenarios and user behavior patterns. See this example PDF report for a demo shop.

2021.3 Release

This quarterly release of Tideways includes Distributed Tracing and Profiling, Traces in the History, and many more features.

In this blog post, we will provide a detailed overview of all the changes. There was also a webinar on the release that you can follow here:

Distributed Tracing and Profiling

In more complex projects where several applications or microservices communicate with each other, profiling becomes more powerful when it can propagate to each sub-request that takes part in a trace. With distributed tracing, the software industry has developed an approach to combine data from multiple related requests. Tideways joins this effort by releasing distributed tracing and profiling across multiple related HTTP requests.

When triggering a trace via Chrome Extension or CLI, Tideways passes information about the parent trace to the child via HTTP headers and combines the results on the backend into a single trace to look at.

This improvement means the Timeline visualization is shown in a single view:

The callgraphs for each participating request can be selected and explored as well.

This feature is available to projects with a “Pro” license.

Trace History

Tideways now stores a few selected traces as part of the application’s history, longer than the regular retention of 5-30 days, depending on the license.

These stored traces allow comparisons of performance through detailed analysis over long periods of time. In combination with our revamped trace comparison that was part of the last 2021.2 release, this gives more insights into long-term changes of application performance.

Every day 1-5 traces are stored as part of the history, and they are selected from the transactions with the highest impact in every service.

This new feature is available to projects with the latest “Standard” or “Pro” license.

Documentation: Trace History

Compact Slack Notifications

Slack messages from bots can quickly claim a lot of real estate on the screen and crowd out other important messages. Depending on how a channel is used, more compact notifications are essential to allow a high number of messages on the same screen. Configuration for Tideways Slack Notifications now allows users to select between a new compact message mode and the already existing detailed message mode.

The documentation shows examples of both compact and detailed messages and how to configure the mode.

cURL Timers in Timeline Profiler

The Timeline Profiler now collects timing information for cURL based HTTP Requests that are available from curl_getinfo at runtime and shows them in the span details panel.

You can find more information about the available timers in the changelog.

PHP 8.1 Support

Tideways now supports PHP 8.1, starting with the PHP extension 5.4.26. The PHP 8.1 support covers all existing functionality of PHP from previous versions. However, support for the new Fibers feature is not implemented yet. This means that code using fibers may produce confusing timeline and profiling results.

Reduced Daemon Overhead under Heavy Load

Usually, the tideways-daemon processing all monitoring and profiling data has a very low CPU and memory profile. However, we observed that when many PHP requests are processed within a second and the sample rate is high, then the load can sometimes increase. This has lad us to refactor the daemon in two specific ways:

  • Serialization of data between PHP extension and daemon was optimized to use a more CPU and memory efficient Go library.
  • Parallel processing can now use a worker connection pool that limits the amount of processed monitoring and profiling payloads in parallel. This is currently an opt-in feature that you can enable with the –use-connection-pool flag. (Documentation)

Several customers have reported significantly better CPU and memory usage of the daemon with these two changes enabled.

Log all tasks the Shopware 6 queue processes

The Shopware 6 software architecture heavily relies on a message queue to process tasks in the background. This is a fundamental change of how Shopware works compared to version 5, which did not have a message queue.

To fully leverage the benefits of Shopware 6 you should make use of the message queue as much as possible. Shopware can already do the following tasks in the background out of the box:

  • Store and Index Imported Products / Categories via the Sync API
  • Indexing of all entities
  • Warmup product and category pages in the HTTP Cache
  • Generate Thumbnails for Images
  • Generate Sitemap
  • Product Exports (Google Shopping Feed, …)
  • several others…

This has a lot of performance benefits, but it also introduces an operational risk: What if there is a bug, an error or any kind of problem in the queue? Will I see this and can I debug it?

You can make use of the canonical log line pattern to essentially generate yourself a more powerful equivalent of the webservers “access.log” for every task that the message queue processes. The output will look like this:

2021-08-15 10:39:58 ProductIndexing data=1791edec1f04464a8a4074423501e781 duration=0.190
2021-08-15 11:30:48 UpdateThumbnails mediaIds=102ac62ba27347a688030a05c1790db7 duration=0.015
2021-08-15 11:32:16 DeleteFile files=shirt_red_600x600_800x800.jpg duration=0.002
2021-08-15 12:08:25 WarmUp route=frontend.detail.page domain=http://shopware6.tideways.io cache_id=cc3e1493bc874b62b16c11cd291826f9 duration=0.003
2021-08-15 12:08:25 WarmUp route=frontend.navigation.page domain=http://shopware6.tideways.io cache_id=cc3e1493bc874b62b16c11cd291826f9 duration=0.002

This can easily be achieved, because the message queue is based on the Symfony Messenger component and it can be extended via so called Middleware.

We create a middleware class with the following structure:

namespace Shopware\Production\Messenger;

use Symfony\Component\Messenger\Envelope;
use Symfony\Component\Messenger\Middleware\StackInterface;

class TaskLoggingMiddleware implements MiddlewareInterface
{
    function handle(Envelope $envelope, StackInterface $stack): Envelope
    {
        return $stack->next()->handle($envelope, $stack);
    }
}

And we register it as a service that is a message queue middleware with this Symfony container service definition:

# config/packages/framework.yaml
framework:
  messenger:
    buses:
      messenger.bus.shopware:
        middleware:
          - "Shopware\\Core\\Framework\\MessageQueue\\Midleware\\RetryMiddleware"
          - "Shopware\\Production\\Messenger\\TaskLoggingMiddleware"

services:
- "Shopware\\Production\\Messenger\\TaskLoggingMiddleware": ~

This will run the middleware whenever a task is processed in the Shopware Message queue. Next up is the implementation of logging what is happening:

  • map each task into a task name
  • extract arguments from all known message task types to enhance the log output
  • handle errors in tasks
  • write the task processing to a file

On the macro level I use the following implementation for handle:

public function handle(Envelope $envelope, StackInterface $stack): Envelope
{
    $message = $envelope->getMessage();
    $taskName = $this->getTaskName($message);
    $args = $this->extractArgumentsFromMessage($message);

    $start = microtime(true);
    try {
        return $stack->next()->handle($envelope, $stack);
    } catch (HandlerFailedException $e) {
        $args = $this->addExceptionToArgs($e, $args);

        throw $e;
    } finally {
        $this->logTaskProcessing($taskName, $args, $start);
    }
}

The try catch finally makes sure that regardless of an Exception, we always “logTaskProcessing” to store information about the processed task. We have two methods for mapping the message to a human readable task name and extract the arguments at the beginning and when an Exception occurs, we extract the exception class and message into the arguments.

The interesting part is “extractArgumentsFromMessage”, which has special code for a lot of the different Shopware internal messages, for example “EntityIndexingMessage”, “WarmUpMessage” or “ScheduledTask”.

private function extractArgumentsFromMessage($message)
{
    if ($message instanceof EntityIndexingMessage) {
        $data = $message->getData();

        if (is_array($data)) {
            return ['data' => implode(',', $data)];
        }
    } else if ($message instanceof ScheduledTask) {
        return ['taskId' => $message->getTaskId()];
    } else if ($message instanceof DeleteImportExportFile ||
              $message instanceof DeleteFileMessage) {
       return ['files' => implode(',', array_map(
           function ($f) { return basename($f); },
           $message->getFiles())
       )];
    } else if ($message instanceof GenerateThumbnailsMessage) {
       return ['mediaIds' => implode(',', $message->getMediaIds())];
    } else if ($message instanceof WarmUpMessage) {
       return [
           'route' => $message->getRoute(),
           'domain' => $message->getDomain(), 
           'cache_id' => $message->getCacheId()
       ];
    }

    return [];
}

When you add your own messages to Shopware, you should extend this method to add arguments to your tasks as well for the log file.

You can find the full code of the TaskLoggingMiddleware in this Gist. We are working to turn this into a Composer package in the near future.

Combining this with Tideways, you can even get aggregated performance insights and profiling for Message Queue on top using the “tideways/symfony-messenger-middleware” package.

Related content:

Tideways 2021.2 Release

This quarterly release of Tideways includes External HTTP Monitoring, Observations about PHP Metrics and Application Configuration, a redesigned Callgraph Compare screen, the ability to name traces, a new GitHub app to synchronize users into an organization and many other features.

Update to PHP Extension 5.4 and Daemon 1.7 to access all new features of this release.

In this blog post we will provide a detailed overview of all the changes. We have also recorded a webinar that summarizes and shows all these features if you prefer video.

We also made a decision not to use the seasons for naming releases as Summer/Winter can mean something entirely different depending on your hemisphere. Instead we will now number our quarterly releases with the year as a prefix, starting with 2021.2 for this release.

External HTTP Monitoring

Almost every application needs to integrate with one or many other applications through HTTP-based APIs. These integrations are often the cause of failures and slowdowns and deserve thorough monitoring. 

Tideways now supports this with a minute by minute monitoring of every external HTTP host that your application communicates with, recording typical average response times and problem response times and the failure rate of HTTP 500+ requests in proportion to successful requests.

Each HTTP host can be viewed in detail where a list of all traces calling the host are listed in every plan. In the pro plan Tideways also tracks the performance of requests to the external HTTP host over time.

For HTTP Hosts that are monitored by a Service within the same Tideways project you can manually link them to each other through the Services Settings page by linking the primary hostname. The UI then allows to simply switch from HTTP Monitoring directly to the service.

Observing PHP and Application Metrics

Performance does not solely depend on code and databases, but also on PHP and Application configuration and metrics. The most important configuration values for PHP are OPcache related and for many frameworks there are important configuration options that influence performance.

Starting with this release Tideways will observe PHP configuration and runtime metrics as well as known application configuration options that affect performance and make Observations about them.

You’ll find the observations module under “Issues” then “Observations” in the Tideways UI and it will show you all observations in either error, warning or pass state. 

For now the observations are related to OPcache, Realpath Cache, Timeouts and other core PHP metrics. A handful of Shopware 5 and 6 specific observations start our work on application specific observations for now. Each observation provides information about cause and remedy including a detailed documentation page with explanations. Here you an see an application that has the OPCache Interned strings setting configured too low:

Compare Callgraph Redesign

Last year we completely redesigned the callgraph screen to provide a unified UI with better navigation and more information on a single screen. When comparing two callgraphs with each other it now uses the same unified UI.

Start with visiting a trace with callgraph that you want to compare to another. The navigation contains a link to “Compare”. Select the trace to compare with the current trace and the following screen will show the “Callgraph” compare.
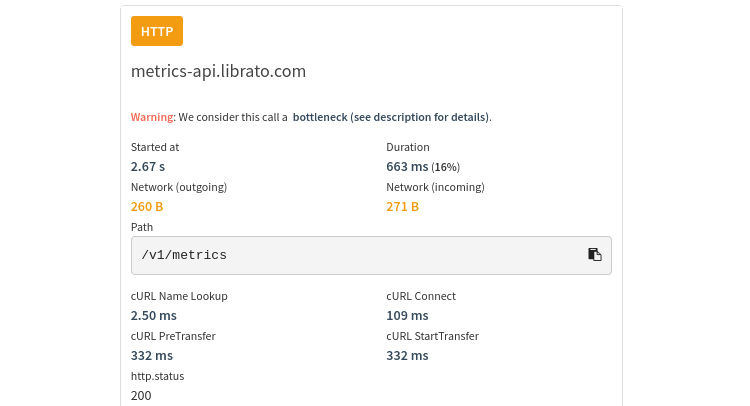
There is also the familiar callgraph view that now shows a diff of the two compared callgraphs:

Give Traces Names

To better aid the performance optimization process you can now give traces a name that describes them and helps you to organize them for reference and comparison.

Click on the “Edit” button next to the transaction name of a trace and enter a name or description of what the trace represents for you.

You can find a list of all the traces you named on the “Traces” “History” screen.

Retry failed data collection requests from Daemon

Starting from version 1.7 of the daemon package, failed network requests with monitoring and profiling payloads for the backend are now retried for a few times instead of dropped immediately. This prevents the occasional one minute drop of data that was happening before, because of network problems and will help with the rare cases where the backend suffers from a downtime.

The retry mechanism works with two failsaves: It only stores up to 50 MB of payloads in memory and retries to send them for a maximum of 5 times in intervals of 60 seconds.

Symfony Messenger and Shopware 6 Worker Integration

While Tideways already supports instrumenting worker queues written in PHP, they currently need custom instrumentation of the processing loop to start and stop individual traces for each processed job/task.

If you are using Symfony Messenger or Shopware 6 worker queues then you can now use our Composer package instead, that makes this instrumentation quick to setup and integrate in your application.

GitHub App to synchronize Users into Teams

Tideways already allowed you to synchronize users from GitHub teams into an organization using their OAuth authentication. But since their OAuth tokens are tied to single users and not to a GitHub organization, this required the user that set up the synchronization to stay a GitHub admin to keep the synchronization working.

We have now migrated to a GitHub app that provides the team synchronization features. You can install the GitHub app between your GitHub and Tideways organizations through the “Integrations” admin screen in Tideways.

Afterwards you can create new teams and link them with a GitHub team in your organization.

Documentation: Synchronize Github Teams

PHP 8 and JIT Support

While Tideways already supported PHP 8 since its release in December 2020, it did not yet work in conjunction with the JIT. We have now rectified this by using the new Zend Observer API which supports both Profiling and JIT to work in combination. As a side effect it should reduce the overhead of Tideways on PHP 8 even more than with the previous profiling hooks that we used.

New Features and Changes in Profiler PHP Extension

The Profiling PHP Extension got new instrumentation since the last release that will collect new or more detailed information in the Timeline and Callgraph Profilers:

  • Magento 1: Added automatic transaction detection for SOAP and REST API
  • Shopware 5: Detect HtmlMinCompressor::minify in Timeline Profiler as common source for bottleneck
  • Laravel: Added Blade template names as tags to nodes in the Callgraph
  • Zend Framework/Laminas: Added template names as tags to nodes in the Callgraph
  • Improved cURL Multi Instrumentation to work when curl_multi_remove_handle is not used.

Additional changes in the extension include:

  • New INI setting tideways.traces_max_seconds that defaults to 60 seconds. Traces running for longer than this threshold will stop collecting timeline data as viewing very long traces that take longer in most cases adds no new information that cannot already be seen in the first 60 seconds.
  • Runtime metrics of PHP about Opcache and others are exported to the daemon in intervals of 60 seconds. This can be disabled by setting tideways.features.stats=0
  • Better Process / SAPI Information about FPM is sent to daemon, so that Tideways can detect multiple PHP-FPM pools and correctly see runtime metrics for each of them.
  • All HTTP requests are always monitored to allow the new HTTP monitoring feature to observe 100% of all HTTP calls. You can disable this to only observe HTTP calls made in sampled traces by setting tideways.features.monitor_http=0

That is everything for now. If you want to see some of these new features in action you can view a recording of our webinar about all these features.

What’s new? Winter Release 2021

Winter is clearly over here, the sun is shining, which means it is time to sum up everything that is new in the Tideways Winter 2021 release.

  • HTTP Status Code Monitoring
  • Deployments UI
  • Incidents UI
  • Improvements to Error/Exception Workflow
  • Filtering by Custom Annotations in Traces List
  • Improvements to Autoloading Layer Computation
  • PHPStorm IDE Stubs
  • Dialog to change Billing E-Mail Addresses

Aside from this blog post explaining the new features in detail and the documentation, we also recorded the 34 minute webinar about the release:

Tideways Winter Season 2021 Release Webinar

HTTP Status Code Monitoring

To complement the requests and errors counters in monitoring, Tideways now also tracks the HTTP status codes that an application responds with. This will enable a better understanding of the type of traffic that might cause a change in performance.

The common client and server error codes are tracked individually and other codes are grouped into 100s, 200s, 300s, 400s and 500s.

See the documentation for details

Deployments UI

In addition to viewing deployment comparisons from notifications or from the markers on the monitoring chart there is now a list of all deployments under “Issues” and then select “Deployments”.

Incidents UI

In addition to viewing incidents from notifications or markers on the monitoring chart there is now a list of all incidents triggered by response time or error rate notifications under “Issues” and then select “Incidents”.

Improvements to Errors/Exception Workflow

The workflow options for each error or exception have been rephrased to be more clear.

You now “Ignore” an exception from error notifications and prevent the errors from being counted towards the global “Errors” number in monitoring. Previously this workflow operation was called “Not Error”.

This is done based on the fingerprint of the error/exception, which is computed based on the class name of the error and its stacktrace.

You can then strengthen to “Always Ignore” to ignore exceptions based on their class name only, regardless of where the error occurs in terms of stacktrace.

Lastly, ignored errors and exceptions are not filtered on the daemon anymore, so that you can still see when and how often an ignored error occurred.

See the documentation for details

Filtering by Custom Annotations in Traces List

The advanced query syntax for trace filtering now allows for conditions on custom metadata annotations that are added to a trace.

If you add a custom annotation “user_id” to every trace then a query could look like this:

annotations.user_id = '100' 

Additionally, we improved the error handling for invalid syntax, including better error messages shown in the UI.

The documentation on the advanced query syntax has gotten an update as well to show all options and examples.

Improvements to Autoloading Layer Computation

In last season’s release, Autoloading was added to the downstream layers in monitoring. We made a conceptual mistake where autoloading included File I/O and compile time that was seperately counted already, effectively counting this information twice. This is now fixed and in downstream layers the autoloading timer counts the duration autoloading spent in everything except File I/O and Compiliation.

PHPStorm IDE Stubs

When working with the Tideways PHP Extension API, IDEs cannot usually provide autocomplete details. With the IDE Stub Composer package added to a project autocomplete information becomes available.

Just require the package to load the stub code into your projects vendor dependencies:

composer require --dev tideways/ext-tideways-stubs 

See the documentation for details

Dialog to change Billing E-Mail Addresses

In the billing administration it is now possible to change the billing e-mail address as a self-service operation, including adding additional billing e-mail recipients.

See the documentation for details

Photo by Jean-Daniel Calame on Unsplash

Autumn Launch: PHP 8, Autoloading Performance, Deprecation Tracking, Alerting Improvements

This autumn launch for Tideways includes new features and improvements that we worked on the last three months. These are (in no particular order):

  • Add support for PHP 8.0 and announce deprecation of PHP 5 support
  • Autoloading Performance in Layer Monitoring and Profiler
  • Deprecation Tracking
  • Improvements to Alerting: Filter for Service/Environments
  • Weekly Report: Make included services in weekly e-mail configurable
  • Add new “All” Services Filter-Option in Traces and Issues List
  • APCu Performance in Layer Monitoring and Profiler
  • New Apt and RPM Package Repository and Migration Timeline

Aside from this blog post explaining the new features in detail and the documentation, we also invite you to view the recording of our 30 minute webinar “New Features and Improvements launched in autumn 2020” scheduled for 25th November 2020, 15:00 Europe/Berlin.

Tideways Autumn 2020 Launch Webinar

To benefit from all these changes you need to upgrade your Tideways PHP Extension to version 5.3.4 and Tideways Daemon to version 1.6.24.

PHP 8 Support and PHP 5 Deprecation

The latest Tideways PHP extension version 5.3.4 (released today) includes support for the upcoming PHP 8.0 version, that will be released next week (November 26th 2020), and it includes support for the new Observer API for profiling right from the start.

In addition we are announcing to deprecate support for Tideways on all PHP 5 versions. All our release packages for Tideways will continue to include PHP 5 builds of Tideways, but only of the Tideways branch 5.2 (latest release as of today is 5.2.6). If necessary we will update PHP 5 builds with important bugfixes or security patches, but new features are not targeted for PHP 5 anymore.

Autoloading Performance

PHPs autoloading has a significant impact on performance of applications that you should be aware of. With this newest release of Tideways, we now track the autoloading performance impact in both monitoring and profiling. This means you can see the average time spent in autoloading aggregated by every minute in the layer tooltip:

And in the summary section of every collected trace:

As was the case before, you can then dive into a Callgraph to see where exactly time is spent during autoloading:

Deprecation Tracking

Tracking deprecations triggered in your PHP applications is now possible using Tideways. This hooks into PHPs E_USER_DEPRECATED and E_DEPRECATED error levels, collects and aggregates deprecations and shows them as a new issue type in the “Issues” screen of your Tideways projects.

With this feature it is easy to get an overview of all deprecations in PHP core or libraries that your application is causing, so that you can update the syntax and APIs before upgrading your dependencies.

Alerting Improvements: Fine-Grained Service and Environment Filters

Instead of having to select exactly one service and environment, configuration for notifications is now more flexible, allowing fine-grained control which services and environments should be included when checking for incident conditions.

This is achieved by adding a free-form filter syntax:

  • Using the star (*) is a wildcard matching all services or environments
  • Using the service or environment by name includes them in the notification checks
  • Prefixing a service or environment with ! excludes them from being checked.

Examples: “web worker” or “* !cli”

See the documentation for details

Include More Services in Weekly Report

Before this release, only the default service of a project was included in the weekly report e-mail. You can now configure which services to include and exclude from the weekly report on the “Services” configuration screen.

See the documentation for details

APCu Layer in Monitoring and Profiling

Usage of APCu is now tracked as a seperate layer in monitoring and profiling of Tideways. This gives you an average time spent in APCu and concrete times for individual traces.

View Traces and Issues from All Services

Previously you could only view traces and issues from one service of a project at a time. We have now added an option to show traces and issues from “All” services on a single screen.

New Package Repository

Our Debian and CentOS (RPM) package repositories have always been served directly from AWS S3 using open-source publishing tools and custom tools that we have added on top. To increase automation, convenience and security on our end, we recently migrated package publishing to Bintray, but are still mirroring packages from there to the old S3.

For now nothing has to change for you, but at the end of 2021 we will stop publishng to the S3 repository. Until then, you should perform these two steps:

  1. Trust our new GPG key for the [email protected] e-mail address
  2. Change the URL for package updating from the AWS S3 to the Bintray endpoint.

See more details in the documentation

Photo by Jeremy Thomas on Unsplash

Summer Release: Slow SQL Query Log, Callgraph Profiler, Memory Tracepoints

This Summer Release of Tideways builds on the previous Beta Announcements in May’s Spring Release and marks the general availability of

  • Slow SQL Query Log
  • Unified Callgraph UI
  • Events and Templates in Callgraph Profiler
  • Memory Tracepoints

This new functionality is fully available by updating the Tideways PHP Extension to version 5.2.4 and the Daemon to version 1.6.18.

In addition to rolling out new features, we also renamed the concept of “Application” in Tideways to “Project” and we provide a detailed explanation why at the end of this post.

Slow SQL Query Log

One major source of performance bottlenecks in PHP applications are slow SQL queries for a variety of reasons: Not using indexes, using the wrong index, using temporary tables and much more.

Tideways new Slow SQL Query Log provides a classic database slow query log with the application context to quickly identify and fix the faulty query:

  • Transaction, Controller and Action Names
  • URL and further information from the HTTP request context
  • Stacktrace with all functions

The Slow SQL Query log is using the same UI and workflows that Errors/Exceptions are and both are now grouped under a new main navigation module called “Issues”.

You can configure alerts to be sent when new Slow SQL queries occur in your application.

Unified Callgraph UI

The “Calls” and “Callgraph” tabs in Tideways Profiler have been merged into a single screen to improve the insights into your profiling data. This is the most significant change to the Callgraph UI in over three years. Previously with both separated it often happened that while stepping through callgraph data, you lost the context when switching between both views.

Both calls table and callgraph data is now shown on a single screen and completely synchronized. We achieved this by making use of the full width of the screen and without loosing information that was previously shown.

This change was carefully done with a lot of users feedback and our own tests.

Now that the new Callgraph UI is live for everyone, we are still looking for your feedback: Does it improve or deteriorate your experience with the Callgraph data?

Events and Templates in Callgraph Profiler

A central problem of the Callgraph Profiler until now has been that every function was only present once, with all outgoing and incoming children and parents pointing to it. For applications using centralized Event and Template libraries this makes it harder to find the root cause of a performance problem.

From PHP Extension 5.2 on function nodes in the Callgraph can be split up by a “tag”. This is represented in the UI by adding an argument to the function node with the name of an Event or Template for example.

See this example for a Symfony EventDispatcher function call.

Previously this would be shown as just a single entry in the Calls table and it would be difficult to find out which event is responsible for which share of the EventDispatchers performamce.

Memory Tracepoints

In the Winter release this year we shipped Tracepoints to give you a powerful tool to select the Traces you are interested in. We supplemented this with the Callgraph Tracepoint feature in Spring. Tracepoints so far have focussed on response time as filter criterion.

Starting with Tideways Daemon 1.6.18 you can now change the filter criterion to be memory usage of a trace. This is helpful to get traces including callgraphs for requests that are using excessive amounts of memory.

Renaming Tideways Concept “Application” to “Project”

Since the beginning Tideways used the name “Application” in the UI to represent what is better called a “Project”. The reason we think this name change is necessary can be explained by contrasting different project types.

For Tideways it does not matter if you have a monolithic applications with a single codebase, a few applications composed together or microservice architectures with many small applications. If they belong together they compose a “Project” that should be monitored and profiled together.
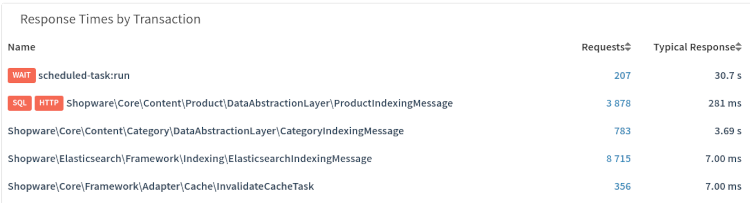
We have seen users create multiple Tideways applications, when a single one would provide the same insights. We hope the use of “Project” makes it clearer which applications and services should be grouped together in Tideways and which should be separated.

Every project can be grouped into individual units by the following dimensions:

  • Services should be used to view the project from different perspectives: Different user groups interacting with a monolith application or different microservices.
  • Environments should be used to split the project into their installations or deployments: Production, Multiple Production Instances by Region, Staging, Acceptance and Development.

Spring Release: Tracepoints, Callgraphs, Slow SQL Log and Deprecations

We are releasing a new stable minor version of the Tideways PHP extension 5.1 today, which will include a few new features that we have been writing about before and a few new ones that we have cooked up in the last few weeks.

The following packages have received updates:

  • tideways-php to version 5.1.14
  • tieways-daemon to version 1.6.10
  • tideways-proxy to version 0.1.34

Using Tracepoints to Trigger Callgraphs

We have written about trace boosting with Tracepoints a few times before. Now we have tested the dynamic callgraph tracepoints feature in great depth and are ready to release a stable version of it. In the Tracepoint form, you can now click the “Activate Callgraph Profiler” checkbox and select how long the Tideways PHP extension should be elevated to Callgraph Profiler mode:

Once the tracepoint is activated the collected callgraphs are highlighted separately from regular timeline traces in the UI:

By default, dynamic tracepoints is still deactivated, but there are just a few PHP.ini settings explained in this documentation page to get it running.

Automated Builds for Alpine, ARM and FreeBSD

You can now use Tideways with Alpine Linux (musl), ARM architecture and the FreeBSD operating system, as we have automated builds for these systems and they are now listed on the Downloads page. Builds for these systems are now fully automated and artifacts are released at the same time as the already supported operating systems and architectures are released.

In addition we have stopped building packages for i386 architectures as our logs indicate that nobody is using them.

In Beta now: Slow SQL Query Logging

Tideways now collects slow SQL queries from your application very similar to the MySQL slow log functionality, but enhanced with a PHP stack trace, transaction name and other context information. Slow queries are aggregated and de-duplicated similarly to exceptions and presented in a similar user interface:

This feature is available for beta testers with the PHP extension 5.1 installed. Please write to [email protected] if you want to be part of the beta test and see the documentation how to activate it.

In Beta now: Unified Callgraph Screen

We have but a lot of work into a prototype to merge the “Calls” and “Callgraph” tab in a single unified screen. The benefit here is that you don’t have to force reloads of the UI when switching between those two modes. The tricky thing about this new screen is that we have to make use of the full screen, and adjust elements on the screen much more to different display sizes.

For this change we are dependent on feedback from you, so we have published this beta early. This beta feature does not need to be enabled for you directly, it is available to everyone.

In Beta soon: Deprecations

Reusing the already familiar Error/Exception Tracking feature we have added Deprecation Tracking as another feature to Tideways. If you enable tideways.features.deprecations=1 in the new PHP extension 5.1, we will collect the following deprecations triggered in your PHP application:

  • trigger_error with E_DEPRECATED or E_USER_DEPRECATED, even if error_reporting is not enabled for these error types.
  • Engine deprecations triggered by using a deprecated feature of PHP itself, but only if userland error handlers don’t interfere with this. This is a restriction of the PHP engine itself and we are actively working to improve this for the upcoming PHP 8.

This feature is available for beta testers with the PHP extension 5.1 installed. Please write to [email protected] if you want to be part of the beta test.

New Feature: Support for GraphQL Queries in Timeline Profiler

We have just released the PHP Extension version 5.0.62 which includes a new feature, instrumentation for GraphQL queries made using the webonyx/graphql-php package, the most widespread GraphQL server package for PHP, for example by Magento 2.

The following screenshot shows how GraphQL spans are rendered in the Tidways Timeline Profiler, here using a Magento 2 GraphQL endpoint responding to a query for the cart:

GraphQL queries are parsed and anonymized in the tideways-daemon running on your machines in a similar way to how SQL queries are anonymized.

Each resolver has its own sub-span under the GraphQL query, so that you can see what part of the query took how long. This allows you to see exactly what SQL and Redis calls are made in resolvers due to the GraphQL query and can help pinpointing performance problems in certain GraphQL queries.

For this SQL query we can see the list of parent spans containing the “Cart” resolver inside the “Cart” GraphQL query.

Check out the 5.0.62 release (changelog), which contains a few other improvements to Magento 2 instrumentation that greatly increase the monitoring and profiling insights into this e-commerce platform.

New Feature: Max Memory Monitoring

The PHP INI setting memory_limit is important to configure right for two reasons:

  • Set too low and an increasing number of requests fail due to memory limit reached errors.
  • Set too high reduces the theoretical number of PHP processes that can run on a single server.
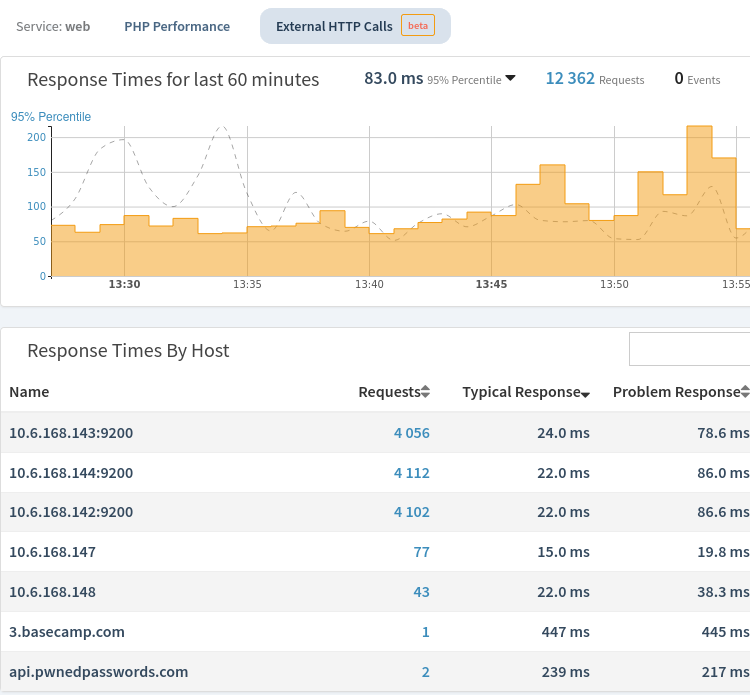
To help you finding the right memory_limit setting Tideways now offers two additional ways to see the maximum memory in use:

  1. on the service level for the currently selected time period
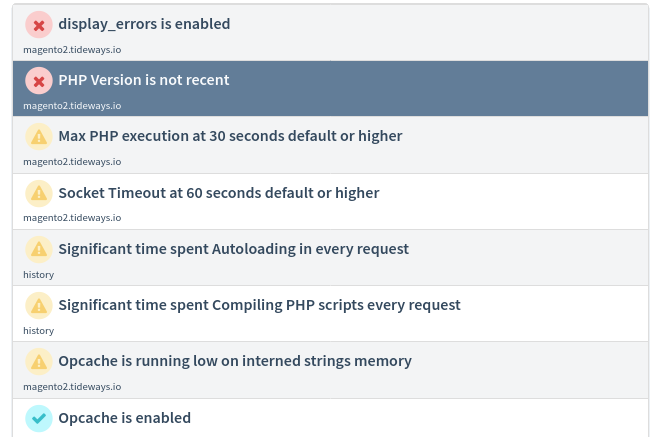
  2. for every bucket in the performance graph, visible via the tooltip when hovering.

I have recorded a short three minute video demonstrating this feature:

Max Memory Monitoring If you want to know more, setting the right memory limit was also a topic Matt and I interviewed our guest Arne Blankerts about in episode 8 of the Undercover ElePHPant podcast about PHP-FPM tuning and we wrote a blog post on PHP-FPM tuning with more details.

New Feature: Multiple Production Environments in Pro License

All Tideways applications with a Pro license can now create additional production Environments in addition to the one that is available by default.

Configuring a second or more environments as “production” effects the retention and the traces/minute collected for these environments. By default non-production environments have just 1 day of retention and 1 trace/minute.

Using multiple production environments is often useful if your application is run on multiple clusters for geographical reasons, for example one in Europe, one in the US and one in Asia.

It can also help to temporarily increase the retention and traces/minute for staging environments or environments built for intensive load-testing.

To configure an environment as production go to your “Application Settings” and “Server & Environments” screen.

A new column “Production” indicates which environment has production behavior, which by default is always only the environment by the same name. Click on the Edit link next to a “No” to get to the settings screen and click the checkbox and assign a traces/minute limit to this environment.

The traces/minute limit assigned is substracted from existing production environments. All of them together have 100 traces / minute in the Pro plan.

A New and Improved Application History

Tideways history functionality is still mostly based on the features available 4 years ago, before we introduced Services and Environments, Downstream Layers and many others.

Time for a redesign of the history to include support for all the features and data that are available now. By using the UI elements from the performance overview we also introduce a familiar look and feel, where the previous history screen used its own widgets.

New Tideways History screenNew Tideways History screen

What’s new?

Next to the production environment and the default service data, we now save history data for all services and for all environments that the application contains.

See history for all Environments and ServicesSee history for all Environments and Services

We also introduce the familiar time explorer component to allow navigation in the history. This helps provide a good visual overview of the performance in the last weeks and months.

In addition to the regular 95% percentile performance data, the history now also stores the downstream performance data in the history on an hourly basis. This way you can compare how the performance of different layers changed over longer periods of time. For the Pro plan, this includes downstream data for every transaction.

Lastly, Exception data is finally part to the history. You can now see Exceptions and their number of occurrences in each service on a daily basis in the history.

See list of all Exceptions in HistorySee list of all Exceptions in History

Transaction History

Several users kept asking us to provide more historical information on individual transactions, currently only a few with the highest impact are stored.

Transaction History for Standard and Pro plansTransaction History for Standard and Pro plans

For the Standard and Pro Plan we now also store hourly data for every single transaction in your application. This is paired with a new dedicated history screen for each transaction where you can compare the long time performance.

Timezone Aware History

Previously, the history was always anchored to UTC to determine when a day begins and ends. With the new history, we now support selecting the timezone that the application is primarily served from or the timezone that your team is based in. You can switch the timezone for all the applications that have been created before this feature from the “Application Settings” screen.

Change Timezone of Application for Daily and Weekly ReportsChange Timezone of Application for Daily and Weekly Reports

When changing, beware that the hourly data cannot be converted from old to new timezone that means midnight will always stay 0:00 UTC for the historical days before you changed the timezone.

Use Tideways for applications of all sizes with the new Flex plan

The PHP community is large and diverse in their approach to build and run PHP applications. We have seen hundreds of small applications running on a handful of servers and one product running on multiple clusters and hundreds of servers across the globe. Still, we believe all PHP applications regardless of size benefit from monitoring, profiling and exception tracking functionality.

That is why we introduce a new Flex plan today starting at 69€ / month, to complement our existing pricing, and offer a high level of flexibility for everyone that wants to use Tideways.

As usual nothing changes for our existing customers and you can keep your current plans. Pricing per application is also still available for new customers.

Why we are adding Flex plans

For the last two years Tideways has been using a pricing based on the number of applications (or projects), with three different flavors “Basic”, “Standard” and “Pro” that are different in data retention, traces/minute limits and features. This works nicely for our customers with medium to large applications and provides a fair and predictable month over month price.

However, we quickly realized that medium to large applications don’t run in isolation.

There are a lot of small applications out there too, for example internal tools that support your product, WordPress blogs, CMS sites, playground projects. Agencies usually operate tens, if not hundreds of small applications for their many customers.

All of them need monitoring, profiling and exception tracking as well, but pricing individually at 89€+/month for each application turned out to be unrealistic value proposition.

Flex Plan with Request-Based Pricing

The new “Flex” Tideways plan includes unlimited applications, and is limited by a monthly PHP request limit across all Flex applications in your Tideways account. Flex includes the core functionality of Tideways suited for small applications, lower data retention and a small amount of slow traces/minute.

See the pricing page for a feature comparison between Flex (Request) and Application based pricing.

The Flex plan starts at 69€ / month for up to 5 million PHP requests across all applications combined. If you want to have a higher monthly PHP request limit, you can also upgrade to a Flex plan with 20 million PHP requests for 129€, or even 75 million PHP requests for 299€ / month.

Accounts with Mixed Request- and Application-based Pricing

Should your applications with the Flex plan grow larger and cause the monthly limit to be reached, you can always convert the ones with a high monthly PHP request volume to application based pricing with the existing Basic, Standard or Pro licenses. All Tideways accounts allow a mix of applications with Flex (Request) and application based pricing.

We have thought a while about this mixed pricing model, because offering two completely different approaches introduces some obvious complexity. Our previous plans offered just request-based or application based pricing and neither of them alone allows us to serve the diversity of companies in the PHP community well. This new model now offers the flexibility for small and larger companies and for agencies, e-commerce and product companies.

Do you have questions about our pricing? Please don’t hesitate to write us at [email protected] and we get back to you.