Posts

High Performance Shopware 5.1 with Elasticsearch

The upcoming Shopware 5.1 release ships with native Elasticsearch support, complementing the MySQL backend. This new Elasticsearch support does not replace MySQL as a primary storage, but works as a cache in front of the slow search and category listing database operations.

On the occasion of the 5.1 Release Candidate 1 released at the Shopware Community Day this Friday we are taking the new Elasticsearch backend for a test-drive.

This change is the ideal study of performance impact due to architectural changes to an existing system. Architectural changes usually have much higher impact on the system performance than micro-optimizations or smaller caching or query improvements, but they come at much greater development costs.

In the last years we see a clear trend towards separation of frontend and backend in e-commerce applications to achieve high-performance consumer facing sites. But Shopware and other popular shop-systems such as Magento and Oxid are monolithic systems, with high coupling to a single database (mostly MySQL). All these older shop systems now have a hard time to keep up with this new paradigm.

With this background and starting position it is impressive how the Shopware Core Team added a complex caching layer into this monolithic core, without loosing functionality. They effectively achieved seperation of frontend and backend storage inside the same application. To put the development effort into perspective, I have discussed the first concepts of a road towards Elasticsearch with the Shopware team in early 2014 as part of my consulting work with Qafoo. Architectural changes are never a “quick win”.

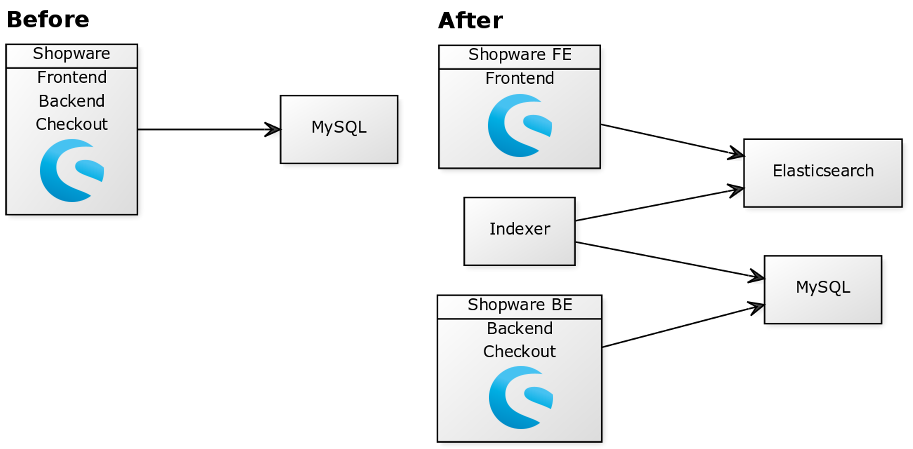
To understand how Shopware works take a look at the high-level before and after architecture diagrams, moving from single datastore to cache-layer synchronized regularly with a cronjob.

We installed Shopware from Github using the 5.1 branch on a fresh 2 CPU/4 GB server at Digitalocean. For the setup of Elasticsearch with Shopware we followed the dedicated documentation page.

We started comparing the performance with the usual Shopware demo data set of roughly 200 products with no visible effect. Actually Elasticsearch is several times slower (19ms) as the 27 SQL queries it replaces (7ms), but the numbers are still negligible compared to the overall response times of around 400ms:

This highlights an important fact of architecture changes: They always depend on your context. With a small amount of products Shopware is actually fast out of the box and there is no need to complicate the setup by introducing a second caching data-storage.

Let’s crank up the volume: We are using a random product generator to create a shop with 100.000 products in 100 different categories. Now the high-level and detailed comparison show Elasticsearch as the clear winner with 29ms, compared to the same category page with 3.9 seconds using MySQL:

The Elasticsearch cache replaces all the queries that don’t scale well to a high number of products with a single HTTP call.

We have experimented with different numbers of products and the story is always the same: Regardless of the number of products, using Elasticsearch will yield query results between 20-40ms. The MySQL based search backend however gets exponentially slower with more articles, around 2-4 seconds for 10.000 products, 10-20 seconds with 100.000 products and starting to consistently fail at maximum execution time with 200.000 products and above.

With a high number of products in your Shopware shop, you should investigate if the performance gain using Elasticsearch is worth the overhead of maintenance. With Elasticsearch as a cache you can achieve almost constant performance in the search and category listings with Shopware, independent of the number of products.

Constant performance regardless of database size is a great property for a system. To achieve this, a change to the architecture is required which introduces a more complex, distributed system. This introduces extra monitoring and maintenance costs. As always with software problems, there are trade-offs to consider between the two approaches.

High Performance Shopware 5.1 mit Elasticsearch

Das kommende Shopware 5.1 Release enthält eine Unterstützung für die Suchdatenbank Elasticsearch, um die Produktsuche und Kategorieseiten zu beschleunigen. Elasticsearch ersetzt dabei MySQL nicht vollständig sondern arbeitet wie ein Cache für die Produktsuche.

Anlässlich des Release Candidate 1, der heute am Shopware Community Day veröffentlicht wurde, haben wir nachgemessen was für Auswirkungen die neue Elasticsearch Suche auf die Shopware Performance hat.

Die Umsetzung einer alternativen Suche direkt im Core von Shopware ist ein großartiges Ergebnis für das Shopware Entwickler Team, die eine lange Vorlaufzeit hatte. Bei den ersten Planungen haben wir von Qafoo schon vor 1.5 Jahren mit Shopware mögliche Implementierungen diskutiert. Für dieses Feature ist eine aufwändige Restrukturierung der Codebasis notwendig gewesen, so dass Elasticsearch ein Drop-In Replacement für die existierende Suche ist.

Für einen ersten Überblick wie die Elasticsearch Suche funktioniert haben wir zwei Architekturdiagramme die erklären welche zusätzlichen Systeme zu einem Shopware Shop hinzukommen: Es wird Elasticsearch und ein zusätzlicher Cronjob benötigt, um eine regelmäßige Synchronization zu erreichen.

Für die Tests haben wir Shopware von Github installiert und nutzen die 5.1 branch auf einer frischen Digitalocean Maschine mit 2 CPU/4 GB. Für das Setup von Elasticsearch mit Shopware haben wir die Dokumentation verwendet.

Als erstes haben wir die Performance mit dem üblichen Shopware Demodatensatz mit 225 Produkten getestet. Bei geringen Produktmengen lässt sich kein Unterschied messen, es ist sogar so, dass die MySQL Suche mit 7 ms etwas schneller ist als Elasticsearch mit 19ms. Bei Antwortzeiten um 400ms ist das jedoch zu vernachlässigen.

Dieser Vergleich zeigt, dass Änderungen in der Architektur nicht immer bessere Ergebnisse erzielen. Die Verwendung von Elasticsearch mit Shopware verursacht zusätzliche Hardware-, Wartungs- und das Monitoringkosten, die sich bei geringen Produktmengen nicht rechnen.

Spannend wird es, wenn wir die Zahl der Produkte erhöhen: Wir nutzen einen Zufallsgenerator um 100.000 Produkte in 100 Kategorien zu erzeugen. Im Vergleich haben wir jetzt einen klaren Gewinner: Elasticsearch antwortet mit 29ms, kaum langsamer als mit 200 Produkten, während die selbe Seite mit MySQL 3.9 Sekunden für die Anzeige benötigt.

Die Elasticsearch Suche ersetzt genau die SQL Queries in Shopware, welche unter großen Mengen von Produkten deutlich langsamer werden. Dafür wird nur ein einziger HTTP Query an die Elasticsearch Datenbank benötigt, der unabhängig von der Produktzahl konstant im Bereich 20-40ms antwortet. Die MySQL Suche dagegen wird langsamer um so mehr Produkte Ihr Shop enthält.

Unser Ergebnis: Bei großen Produktmengen ist es sinnvoll sich die neue Elasticsearch Integration anzusehen. Die schnellen Antwortzeiten auch bei sehr großen Produktmengen sind einfach deutlich besser als die native SQL Suche. Da ist es auch von Vorteil, dass die Suche direkt in Shopware integriert ist.

Performance Probleme mit Shopware? Tideways überwacht die Antwortzeiten Ihres Shops und gibt detaillierte Analysetools und Optimierungsvorschläge für Entwickler und Admins. Jetzt 30 Tage testen und mit Coupon: scd15 weitere 30% in den ersten 3 Monaten sparen.

5 Ways to optimize Symfony Baseline Performance

We will continue our performance series with Symfony (previously on Doctrine ORM and PHP). This blog post describes some of the fundamental aspects that affect Symfony performance at the core of HttpKernel request lifecycle. These complement the Symfony Performance docs, which mentions general tips such as Bytecode Caching and Autoloader Optimizations.

Even though Symfony is consistently listed as one of the slower PHP frameworks in many simple hello world benchmarks (most notably Techempower) you can build scalable and performant applications with it. The trick is to keep the baseline performance of your application as small as necessary.

The five influences in this blog posts are by no means the only thing you can look for in Symfony applications, but they are important.

Disclaimer: There is no black and white in these suggestions, they will always affect the performance of your application no matter what. This blog post wants to make you aware of the influence. As a result you get a checklist of potential optimization spots that are usually hard to find in a Profiler when you don’t know what you are looking for.

1. Expensive Service Construction

There are a number of mistakes with services in the dependency injection container that can negatively impact performance. Your performance baseline with Symfony is affected by how expensive instantiating event listeners and services is for the different events of the HttpKernel lifecycle: kernel.request, kernel.controller, kernel.view and kernel.response.

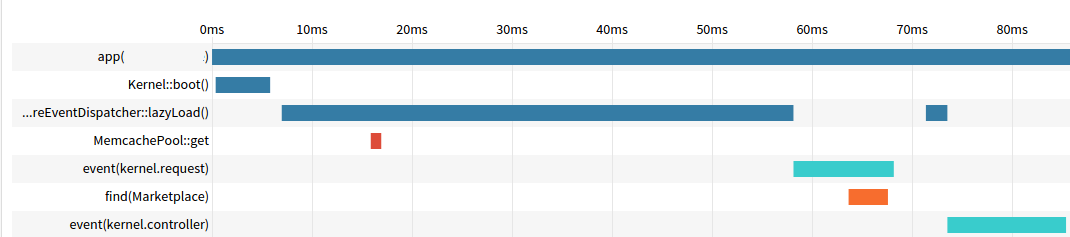
Symfony lazy loads all listeners and depending services inside the EventDispatcher. We can look at this method in a Timeline Trace and see how much time can be wasted in service construction. Here is an example from an application we monitor in Tideways:
Symfony Service Lazy Loading slows down applicationSymfony Service Lazy Loading slows down application

In this case about 51ms in ContainerAwareEventDispatcher::lazyLoad() is spent right before the kernel.request event is executed, which only takes 10ms itself. Something is clearly wrong in this application bootstrap code.

You should avoid the following traps when creating services in Symfony:

  1. The rule “Don’t perform work in the Constructor” is critical for Symfony, everything you do in a service constructor can potentially slow down every request of your application.If you use Doctrine Repositories as service and inject this into listeners, you already have this problem: Creating a repository service will unserialize ClassMetadata from the cache or even parse it.
  2. Services with deep layers of dependencies take a longer time to create. In the Symfony core, Security component is an offender of this trap, often when combined with the FOSUserBundle and more complex Firewall setups.
  3. Avoid injecting services into listeners that are not needed. For example, if you inject templating service somewhere into an EventListener it will get loaded in every request, which in turn loads Twig and every Twig extension that you registered. If your request is returning a JSON Response for an Ajax request this overhead is completely unnecessary.

Two ways exist here to remedy the problem:

  1. The old-school way is to only inject the Container into EventListeners and retrieve services from it when you need them. The downside of this approach is EventListeners are more difficult to test and maintain. The upside is that you don’t need code generation.
  2. Lazy Services were introduced in Symfony 2.3 to avoid injecting the container. This feature uses code-generation to create a proxy service and inject that instead of the real one. Once accessed the real service is loaded from the container.

Both ways work, but are only fighting the symptom: dependency mess. Fixing this is much harder to achieve though and out of your hand if you don’t want to replace third-party bundles.

In very fast Symfony Requests (~20-50ms) the Container::get($id) call is often the number one bottleneck. If you really need a very fast response and high throughput, you must work on optimizing service construction.

2. Slow Kernel Event Listeners

Now that we got through listener and service instantiation, the baseline Symfony performance can suffer from slow listeners that get executed in every request.

Avoid calling a database or external services in listeners, unless you absolutely need to and then restrict this calls to only those requests.

For example in Tideways we use the context pattern to pass state around through the application. The context object contains the organization and site you are currently looking at, the time resolution and more details. Knowing this listener is part of the critical path, we optimized the queries it executes.

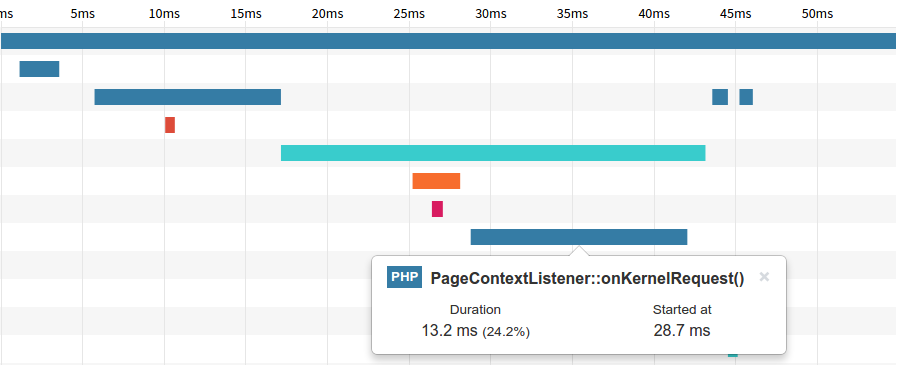
See this timeline of a request (58ms) with the PageContextListener highlighted:
Slow EventListeners decrease Symfony performanceSlow EventListeners decrease Symfony performance

The context listener takes 24.2% of the total request time and over 50% of the kernel.request events time. This is significant and it is important to monitor that this listener isn’t wasting time with unnecessary work.

It is a good idea to have a feeling for how long kernel.request takes in your application, maybe even the time each individual listener needs, because this event is the slowest one in most Symfony applications.

A special case for slow event listeners is the Security component in combination with a Doctrine or Propel based User object. A large user object with lots of properties and associations can slow down your application, because Symfony reloads the user from the database in every request. You can fix this problem by separating the User object Symfony Security needs from the one you are using in your application.

Another thing to look out for in listeners when you are using internal sub-requests: If your listener should only run for the master request, it is important to check for the type and skip for sub-requests. Otherwise the listener will get executed over and over again. Every Kernel Event class allows to checking for the type:

public function onKernelRequest(GetResponseEvent $event) {
     if (!$event->isMasterRequest()) {
         return;
     } 
} 

See the documentation for more information.

3. Excessive Usage of Internal Subrequests

Internal Subrequests are simulated requests inside your Symfony application, allowing to call and render multiple controllers in the same PHP request. This is great for decoupling applications with many different views/widgets on a single page.

But unless you are using some kind of caching, excessive use of internal sub-requests can increase your response times significantly. Especially when you misuse them to render all kinds of “partials”.

Every sub-request will go through the HttpKernel event lifecycle and depending on your Listeners this can add several milliseconds for every subrequest.

Definitely avoid rendering sub-requests in loops, for example to display items in a list:

{% for product in products %}
     {{ render(controller('AppBundle:Product:showList', {'product': product})) }}
{% endfor %} 

Individually each call to a subcontroller is not too slow, but once the number of calls exceeds 10 or 50 per page, their overhead becomes very real. Often controllers used in this way exhibit N+1 query problems, because they cannot share the result of queries efficiently.

Instead of using subcontrollers you can often use a Twig {% include %} statement. It has much less overhead. If the subcontroller does some work that cannot be done in the view, you could think about moving it into a Twig extension.

If your sub-controller is indeed an independent widget, another solution is to use ESI caching. Depending on the cache-lifetime this allows you to have a lot more sub-requests, if the reverse proxy is caching everything for you.

For highly dynamic pages with many widgets on a page, you should investigate different architectures like the one described in Bastian Hoffmann’s slidedeck.

If you are not using ESI or HttpCache from Symfony, but want to cache sub-requests take a look at Alexander’s Twig Cache Extension.

4. Not Delaying Work to the Background

Try to delegate expensive work to the background, such as sending emails or processing uploaded files and images.

When you use PHP FastCGI Process Manager (FPM) the kernel.terminate event is executed after the response is sent to the user. You can see how powerful this is by looking at a timeline of a Symfony Controller sending a mail with Swiftmailer during kernel.terminate:
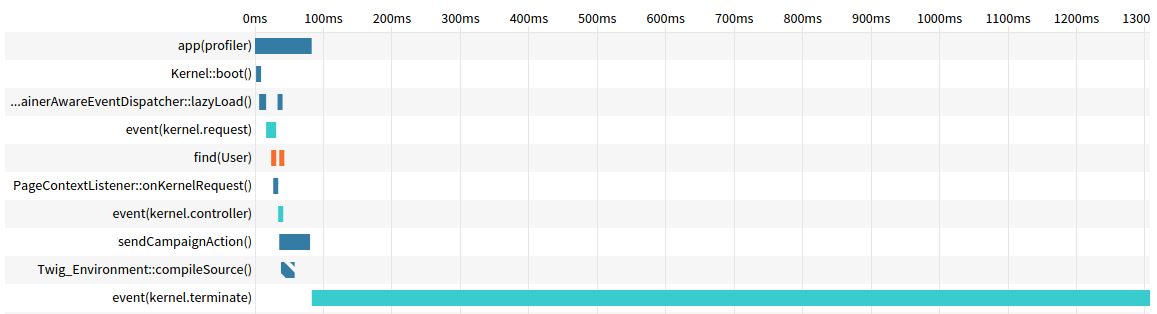
Symfony kernel.terminate allows to delay work into backgroundSymfony kernel.terminate allows to delay work into background

The request ends for the user after less than 100ms, but takes another second to actually send the e-mail in the background.

Using kernel.terminate for too much work can be unreliable, a better alternative is using one of the many existing messages queues. I can recommend Beanstalkd as a simple queue for first time users. In the Symfony ecosystem Redis and RabbitMQ are two other choices that are very popular.

If you are not using PHP-FPM, you cannot rely on kernel.terminate, because users still wait for the response to finish.

5. Increasing “Framework Overhead” with Tons of Libraries and Bundles

A Symfony application is never just the framework alone: The standard edition ships with Doctrine DBAL + ORM, Twig, Monolog and Swiftmailer. Many other libraries have excellent support for Symfony such as Guzzle, Buzz, Propel and Imagine. And there are obviously lots of third party bundles, like FOSUserBundle, FOSRestBundle and JMSSerializer. Each of them adds a tiny bit to the baseline performance or framework overhead.

Building a Symfony application makes you responsible for choices about the desired performance level and the libraries you select can move the needle of the baseline quite significantly.

For example: When you want a REST API to respond below 75-100ms for even complex requests, then you will have a hard time to achieve this when using all the heavyweights in your code like Symfony Forms, Doctrine ORM and JMS Serializer. But if you only need a handful of endpoints to be this fast, then using these libraries in all the other endpoints may be fine.

Similarly, if you need a very fast frontend (eCommerce for example) then you can run into trouble when you combine this into one Symfony app with an oversized backend, containing many bundles that add various listeners to all the kernel events.

To provider an anchor, I work on different projects at the moment that clock between 20ms and 100ms for the Symfony framework+bundle overhead.

Conclusion

Symfony by itself is pretty fast, if you can avoid slowing it down with inefficient services, listeners and libraries or misuse of subrequests for partials. This is because of the sound architecture of Symfony as a framework.

First, being able to hook into the compiled dependency injection container avoids lots of runtime overhead that other frameworks quickly gain when going beyond Hello World. As a developer you are in full control of how expensive bootstrapping Symfony is.

Second, its first-class support for ESI and Http Caching allows you to easily plug any reverse proxies in front of the application and benefit from their performance properties.

Essential Macro Optimizations to Improve PHP Performance

This blog post describes four macro-optimizations for PHP applications that are essential to consider before investigating other possible optimizations.

I often find myself discussing small micro-optimizations for 1-2% of speed gain with other developers, even though these macro optimizations haven’t been dealt with first. While it’s fun chasing after small micro optimizations, often it is debatable if the developer time is well spent. After all, I/O is the more important bottleneck in almost every application.

Micro-optimizations are not useless, as SQLite recently showed – investing months of work and applying hundreds of different changes can improve the performance significantly.

But it’s much more efficient to fix the big issues first. The changes I present in this post can be done quickly and their gains can be massive.

1. Upgrade PHP to a recent version

Are you still using older versions of PHP? You are missing out on a lot of improvements that have been made to the Zend Engine. Every minor version in the PHP 5 lifecycle had some improvements compared to the previous versions.

Rasmus is touring conferences in the last months with his talk Speeding Up the Web with PHP 7 showing numbers for the improvements in different applications and frameworks. Lorna has a post on her blog showing improvements in every new PHP version using the Zend Bench script.

Granted, updating to new PHP versions is not always easy if you are working with legacy code. But if your application is suffering from performance problems then updating is something you should look into.

With PHP7 getting released in November 2015, we will see another performance increase of roughly 100% across all kinds of applications. That means, not having a strategy to upgrade to PHP7 in the next year (maybe two years) is careless from a performance perspective.

Another reason to upgrade to recent PHP versions is the reduced memory consumption. PHP 5.6 uses around 50% less memory than 5.3 and you can handle many more requests at the same time without exhausting server memory.

2. Use accelerator such as APC or OPCache

PHP runs your code in two steps:

  1. The script will be transformed from PHP code into opcodes by the PHP compiler.
  2. This intermediate opcache format is then executed by the PHP virtual machine.

Accelerators can cache the first step of this process until the php file changes. Depending on the kind of application you run and your PHP version, using an accelerator can double the performance and then some.

PHP 5.5 already includes Opcache, so there is another reason why you should upgrade to newer versions. On earlier versions you should use APC (5.3) or install Opcache from PECL (5.4).

If you are running on shared hosting then it is possible that your hoster disabled an opcode cache for security reasons. If you are technically savvy then you should move your code to more modern hosters that give you more control and are still very affordable. We are big fans of both Digitalocean and Syseleven for hosting.

3. Close Session for Writes

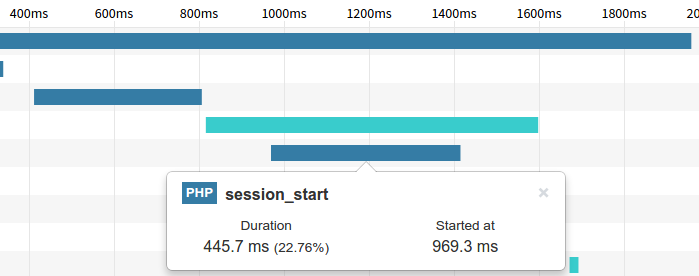
Careful with sessions in PHP: By default only one request can execute synchronously per session at the same time. Other requests for the same session will wait inside the session_start() call until the previous requests are finished. This problem becomes visible to the user when executing a lot of ajax requests on the same page, loading perfectly one after another and not in parallel.

Session locks exist, because otherwise lost-updates or corruption could happen when two requests write to the same session at the same time.

Contrary to popular believe the Memcache Session handler does not fix the locking problem anymore. Up to version 2.0 it had no locking, but this was implemented in version 3 which is now part of all major Linux distributions. The memcached extension uses locking as well.

What you need to do to fix this problem is explicitly close the session for writes. The PHP function session_write_close(); releases the lock and requests with the same session can be executed concurrently.

Only keep the session open in requests where you are writing to the session, such as the login page. In general you should avoid writing too much data to the session, so that you can close it very early in the majority of requests.

In a Tideways Timeline Trace you can identify this problem when there is a large duration for the session_start() function, in this case over 400ms:

Session Blocking in Tideways TimelineSession Blocking in Tideways Timeline

4. Don’t run XDebug in Production

The XDebug extension should not be used in production, it is a development extension. Just by installing it, your PHP code will run slower – sometimes several magnitudes.

That doesn’t make XDebug an extension non-grata, it just isn’t built for production as the author Derick Rethans mentions himself. If you absolutely need to use a debugger in production, then activate the extension only for a short amount of time on a single server.

If you need a Profiler for production look into our Tideways PHP extension. You can use it with our UI for Timeline- and Callgraph-Profiler or one of the many open-source UIs like XHGui.

5 Doctrine ORM Performance Traps You Should Avoid

Doctrine is a powerful Object-Relational Mapper (ORM) for PHP. It increases developer productivity and allows more secure access to your database.

But using any ORM requires careful consideration with regard to performance, especially the critical paths in your application that you want to be very fast.

This blog post discusses performance traps that you should avoid falling into when using Doctrine ORM.

1. Not Caching Metadata and Query Parsing

This is the most important problem to avoid and it is mentioned in the ORM documentation about performance: Use caching for Metadata and Query Parsing. It is also easy to fix and requires no changes to your application code, except configuration.

For every access to an entity metadata or a DQL query, a relatively expensive parsing process is triggered. Both are built to be fully cacheable and you should make use of this in production applications.

See the documentation on caching for details on setup for different caching backends.

2. Complex Fetch-Joins in Doctrine Query Language

One of the Doctrine’s most powerful features is the Doctrine Query Language (DQL), but you should know about the cases where it can cause performance problems.

I have seen a tendency in many developers towards reducing the number of SQL queries at all costs. This often increases the cost of converting database rows to objects (called Hydration) considerably. There is a trade-off involved between reducing the number of queries by using “Fetch Joins” and hydration performance.

Consider this query for both companies and its employees:

SELECT c, e FROM AcmeEntityCompany c JOIN company.emplyoees e 

The fetch-join part is defined through the alias e in the SELECT-clause, causing Doctrine to load both Company and every Employee entity together.

Using a fetch-join for a too-many association here, results in the company parts of the query being repeated over and over again while retrieving all the employees. This is the nature of the relational model and it doesn’t fit very well with objects here.

Skipping parts of a row is expensive for Doctrine, because it has to detect the row and skip it, performing unnecessary transformations all the time.

You can avoid fetch joins by efficiently fetching the data yourself after the first query:

<?php
 
$dql = "SELECT c FROM AcmeCompany c";
$query = $entityManager->createQuery($dql); 
$companies = $query->getResult();
$employees = $entityManager->getRepository('AcmeEmployee')->findBy(array('company' => $companies));

$employeesByCompany = []; 
foreach ($employees as $employee) {   
  $companyId = $employee->getCompany()->getId();
  $employeesByCompany[$companyId][] = $employee; 
} 

Some convenience of the ORM is lost here, but you get a more performant and scalable solution. The exact gains depend on every individual situation, it is easy to compare the difference looking at a timeline.

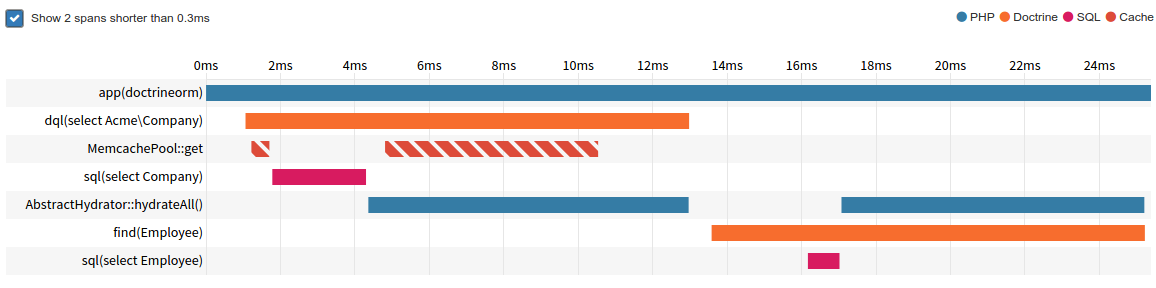
For the Company example it looks like a small decrease in total SQL and hydration can be achieved when fetching the data in code:

Doctrine2 DQL with Fetch Join PerformanceDoctrine2 DQL with Fetch Join Performance

Doctrine2 DQL with Eager Loading PerformanceDoctrine2 DQL with Eager Loading Performance

3. Inheritance and Associations

When using an entity with inheritance hierarchy in an associations, lazy loading proxies will not work. This can be very inconvenient when it triggers additional queries and entity creation that is not needed in a request.

This mistake slips in easily when using inheritance, because you don’t see it in the mappings, for example in this association where you need to know Animal is an entity using single table inheritance:

class AnimalRegistration 
{
    /** @ORMManyToOne(targetEntity="Animal") */     
    public $animal; 
}

$registrations = $registrationRepository->findAll(); 

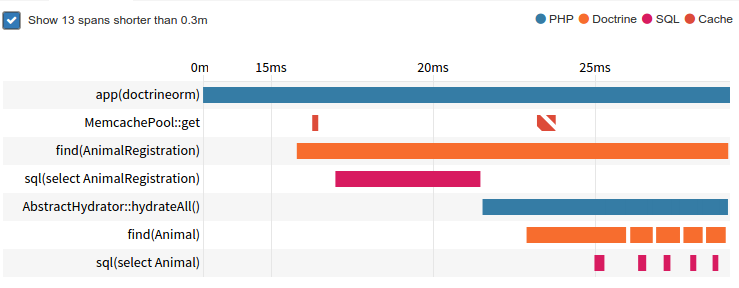
But you can see this when looking at the timeline of a request, how inside the Doctrine findAll() operation we see one additional query for each registration entity.

Bad Performance with Inheritance and Associations in Doctrine2

This is extremly inefficient and one reason why I generally avoid inheritance in Doctrine and discourage others to use it.

4. Bidirectional One-To-One Associations

Similar to the Inheritance and Associations problem, you should avoid bidirectional one-to-one associations in Doctrine. The inverse side of a one-to-one association cannot be lazy loaded.

In contrast to the case of Inheritance Doctrine can perform joins here automatically to fetch the entity. You should not rely on this behavior, because it is dependent on how you query the entity. In larger applications with many developers this performance trap is often a problem, because it is so hard to spot in code.

I avoid bi-directional one-to-one altogether to avoid this performance trap.

5. Lazy-Loading and N+1 Queries

Doctrine’s lazy loading feature is an amazing time-saver for prototyping, but when growing an application it can be a huge performance killer.

The most common problem is passing entities to the view/template and then using lazy loading to access related information.

The following twig template causes the problem. It loops over a list of entities (employees) and prints the field of the association (company):

{% for employee in employees %} 
  <tr>
    <td>{{ employee.name }}</td>
    <td>{{ employee.company.name }}</td>
  </tr>
{% endfor %} 

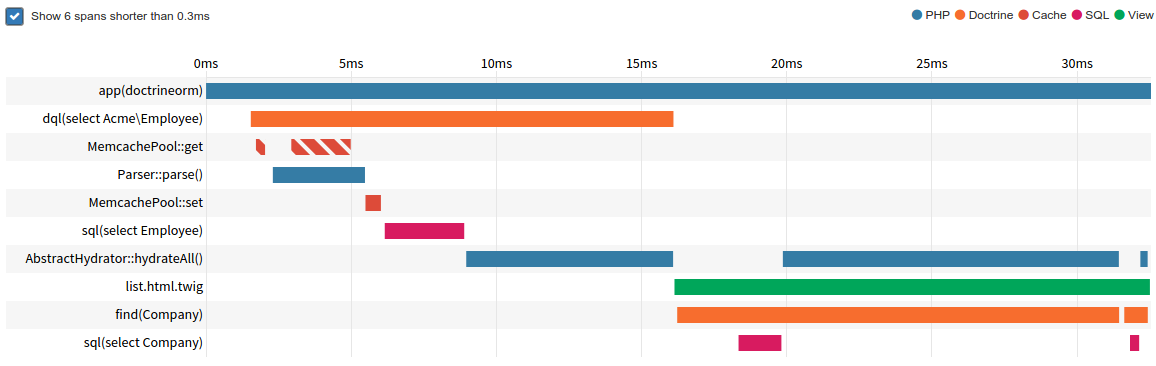
In a Timeline profile this can be easily spotted, the purple/orange spans for SQL/Doctrine are located inside the green Twig span:

Doctrine Lazy Loading Performance BottleneckDoctrine Lazy Loading Performance Bottleneck

There are several ways to fix this:

Use a DQL query to fetch both employees and their company. But be aware of trap #2

Trigger eager loading of the proxies explicitly in the controller:

$companies = array_map(function($employee) {
     return $employee->getCompany();
}, $employees);

$repository = $entityManager->getRepository(AcmeCompany::class);
$repository->findBy(['id' => $companies]);

Set the assocations fetch-mode to “EAGER”: @ORMManyToOne(fetch="EAGER"). This will achieve the same as bullet 2, but will always use eager loading. Use this strategy when you almost always need both entities in combination.

Use a view model object and fetch only the fields that you really need in your view:

SELECT new EmployeeListView(e.name, c.name) FROM AcmeEmployee e JOIN e.company c 

    It depends on the use-case which one to pick, something you should experiment with to get a feeling for the trade-offs at play.

    Three Fully Functional Demo Applications

    Tideways stands for smart and efficient profiling. To offer first-time-users an easy access, we incorporated a lot of feedback to simplify the installation.

    Among other things, we now provide three fully functional demo applications, to give you an impression of Tideways’ possibilities:

    • simple WordPress blog
    • Sylius eCommerce (based on Symfony2) with demo data
    • Shopware 5 with demo data

    With no work required from your side, you can check out all the features of Tideways. All you need to do is sign up for a Tideways account to get direct access to the demo applications.

    Don’t worry, exploring the demo applications does not count towards your available 30-day free trial, you can look around without any rush and decide to start a trial later.

    All the available features are showcased and we are forcing error conditions and durations of slow performance into these applications to make them feel like an exciting roller coaster ride.

    If you already created an account before and the demo applications are not visible in your dashboard, you can enable them in your settings.

    Enjoy the demo applications and let us know how they work for you – as always we are looking forward to your feedback!

    Trace Timelines Public Preview Available

    We are happy to release a first public preview of Trace Timelines for Linux today that we unveiled two weeks ago. You can find the PHP Extension v2.0.3 on the downloads page. Please note that this a preview and there might still be bugs.

    A small number of our customers have tested the new feature already and provided a lot of feedback, most of which we already incorporated into the current version.

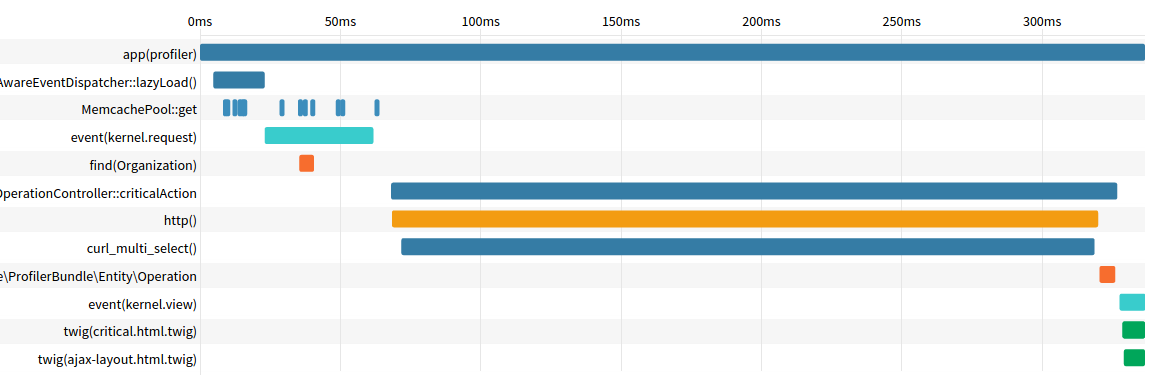
    Improvements were made mainly on the user interface, mostly adding much more information to each individual span. Each timeline contains a large number of individual timespans that are PHP calls, Events, SQL or HTTP calls:

    TimelineTimeline

    More information is available by hovering over each individual timespan.

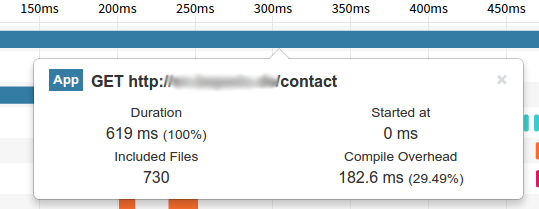
    Take this first example for the main PHP request span. It contains the total duration and additional information such as the number of included files and the PHP compile overhead that this request required.

    Request PerformanceRequest Performance

    In this case 29% of the request spent compiling php files points to a missing opcache extension.

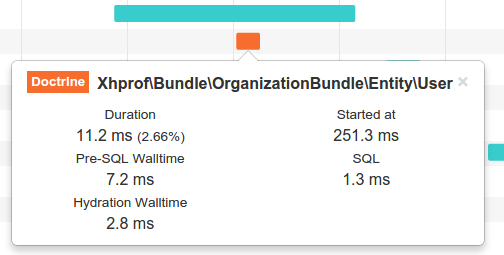
    Another example is this Doctrine ORM timespan which contains information about the time spent building the SQL query and the hydration overhead.

    Doctrine PerformanceDoctrine Performance

    With this information readily available a decision about writing this query manually or keep using the ORM can be quickly made.

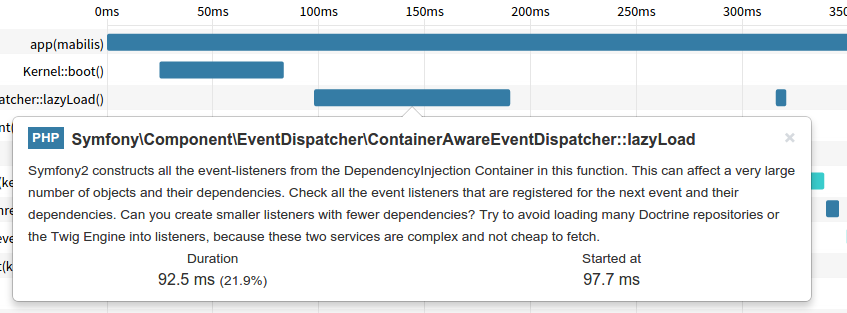
    We also hook into framework specific functions that are known to be performance hogs, for example the service lazy load in Symfony’s EventDispatcher can take a significant amount of time per request.

    Symfony PerformanceSymfony Performance

    We are adding custom descriptions to guide you towards identification and fixing issues so that you don’t have to dig deep into the internals of third party libraries and frameworks.

    These examples show features of the instrumentation that the new Tideways extension detects automatically. But the new Tideways is not limited to automatic instrumentation: Any span can be enriched with custom information and you can create your own spans declaratively and programatically. See the documentation for the API on adding custom spans.

    On top of a much better insight into your applications, we can collect this profiling information at a much lower overhead than with XHProf. So far it runs 50% faster and we still have room for additional improvements. Going forward we will be able to trace much more individual requests allowing to paint a much better picture of your applications.

    Tideways Update: On Timelines

    Tobias and I have been super busy the last weeks adding more features to Tideways. With new customers joining our awesome group of early adopters every month we can now invest more time in working on Tideways. Most of the current work is building new features from scratch which is why it takes so much time compared to previous iterations on the Profiler.

    However, we are really excited about the next features and this blog post is about sharing some of that excitement with you.

    One feature that we are working on right now is called “Timeline”. It implements profiling as initially proposed by Google with a system called Dapper.

    The idea is to collect timespans of interesting events that happen during a request. Each timespan can contain contextual information such as SQL queries, URLs in HTTP calls or template names. All timespans are then displayed in a timeline. What got us hooked on this visual design was the possibility to show all the relevant information on a single screen, no endless clicking and zooming necessary anymore.

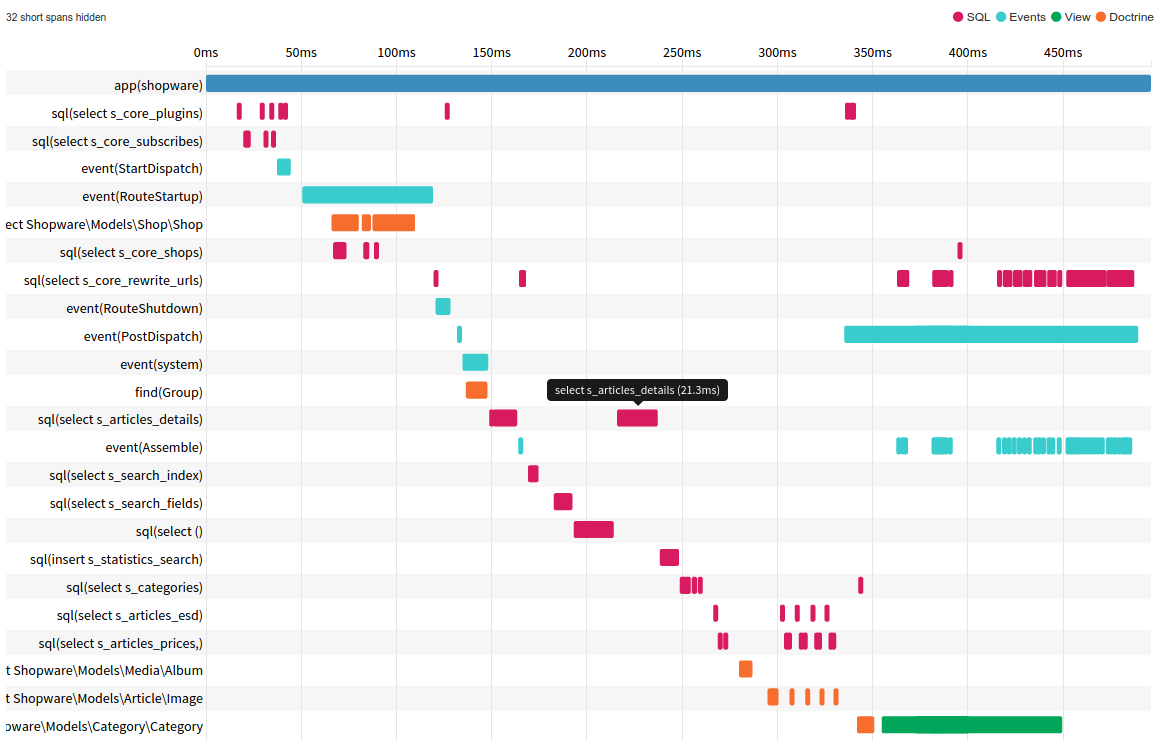
    Have a look at a sneak preview of this feature showing a request of a Shopware 4 application with demo data:

    Shopware4 TimelineShopware4 Timeline

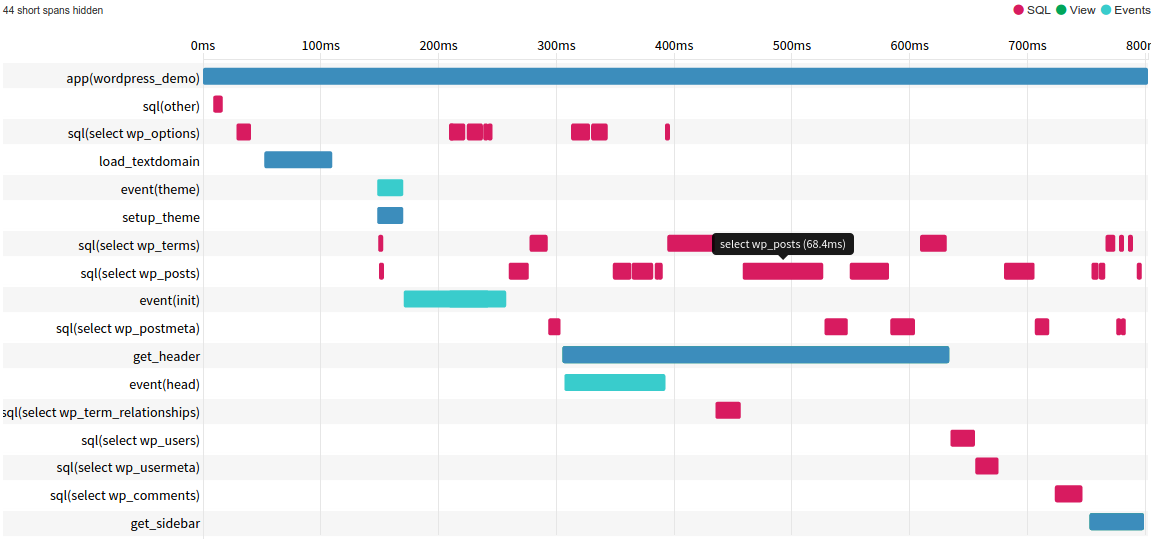
    You can see timespans collected for SQL Queries, Events, Templates and Controllers neatly aligned to show the requests sequence from left to right. Hovering over each timespan bubble will show additional context information. You can spot critical performance problems such as slow or N+1 queries within seconds and know exactly when they happened in the request.

    Our PHP extension collects this data automatically for common PHP extensions, frameworks and libraries. Here is another example from a WordPress blog:

    WordpressWordPress

    We believe Timeline can provide much more valuable profiling data than XHProf in most cases. Our initial prototype built in January already proved successful when we worked with Shopware to improve the baseline performance of their new Shopware 5 release.

    Signup for Tideways now to get early access when we release timelines in the next days. We will automatically set your trial to 30 days once the release is ready, so that you don’t have a disadvantage signing up now.

    If you are worried about XHProf callgraphs being removed from Tideways now, don’t be. You can still send XHProf traces from your applications either automatically with a sample rate or explicitly triggering them.

    Watch out for follow-up posts that explain our rationale for introducing Timeline and why we think it will benefit you when we put less focus on XHProf data. You can follow us on Twitter to keep up to date.

    Heatmaps in Weekly Report

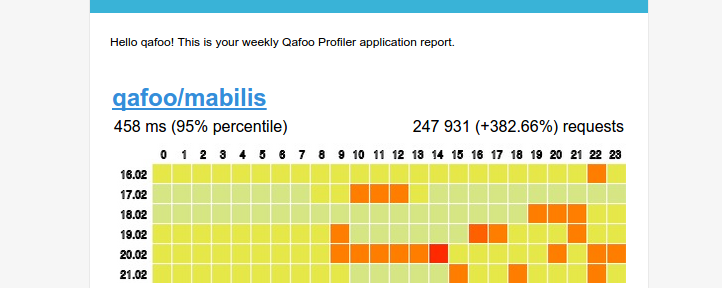
    Changes to the weekly mail were already planned for a long time and now we are pushing them forward with heatmaps as an additional tool to find periods of slow response times. The heatmap will show the response time (95% percentile) of all your applications for each hour of the last seven days.

    It is now part of the weekly application report that is sent every monday morning.

    Heatmap in Weekly Report MailHeatmap in Weekly Report Mail

    By clicking on the square for any hour you will be redirected to the Profiler, showing the graph of response times in the selected 60 minutes as well as the critically slow transactions and traces.

    You will receive the first mail including heatmaps next Monday.

    Using Tideways with HHVM

    Note 2018 We have discontinued support for Tideways on HHVM because there wasn’t enough interest from customers. With all the new features since 2015 our HHVM support was not at the same level as our PHP support and with HHVMs teams decision to move away from PHP.

    Facebooks PHP runtime HHVM bundles its own profiler compatible with the XHProf API. Because Tideways works with the XHProf output format as well, you can start to monitor and profile your HHVM based applications in production today.

    To install the profiler with HHVM requires the tideways/profiler Composer package or download Tideways.php file directly into your application.

    Add the Profiler initialization code to your project as described in the Profiler Setup documentation with the following snippet:

    <?php
    
    TidewaysProfiler::start($apiKey, 10); // 10% Sampling Rate 

    For more insight into your app you should also capture the name of the called transaction using TidewaysProfiler::setTransactionName().

    With a running daemon on the server these are all the necessary changes for monitoring HHVM application performance.

    Detecting Bottlenecks: Blocking Session

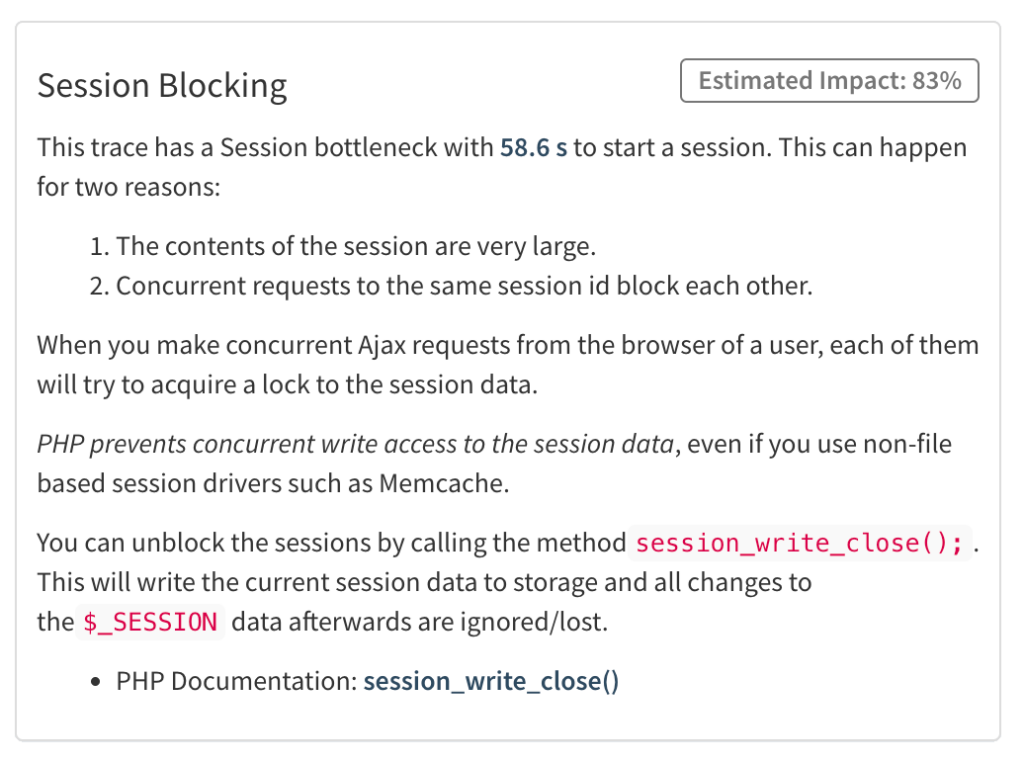
    PHP uses a file-based session store by default that conveniently works out-of-the-box. However, file-based sessions can introduce a serious bottleneck when used with parallel (AJAX-) requests. PHP locks each session file during session_start() until the request ends, preventing concurrent access to the same session at the same time. A blocked request waits at session_start() until previous requests release the lock.

    This leads to linear AJAX-requests execution instead of in parallel.

    We improved the bottleneck detection to scan for this problem automatically, as you can see in this screenshot that shows a transaction that is called via AJAX:

    No changes are necessary to your Profiler setup, this can be extraced on our side already. If your application is suffering from this problem, you will see the warning label popup automatically with the next affected trace.

    There are multiple different fixes to this problem:

    1. If you want to keep file based sessions or use any other backend with locking support such as Memcached: Call session_write_close() when you are sure that you are not writing to the session anymore later. This allows other requests to start reading the session until again session_write_close() is called or the requests end.
    2. You can switch to a custom session backend that don’t implement locks on the session. Careful though, you can theoretically suffer from lost updates when two parallel requests read and then write to the same session. The PHP manual describes how to create a custom session backend in detail.

    See the Session reference in the PHP documentation for more information.

    Elasticsearch Outage analyzed

    Yesterday morning the Profiler didn’t show data in the user-interface for about 7 hours. No data was lost, the workers just stopped importing while Elasticsearch went unresponsive.

    We want to apologize that you could not rely on the data of our product for such a long span of time.

    I want to take the time to explain the background of the outage, our response, and how we want to prevent this from happening again.

    Background

    We decided to use Elasticsearch for storing traces and performance data of the Profiler for several reasons:

    1. Simple clustering and sharding properties compared to MySQL
    2. ES has proven reliable for Time-Series use cases such as Graylog and Kibana
    3. Statistical aggregations (Percentiles) with good performance
    4. A big share can be attributed to trying out new technology as well, we started the Profiler as a side project after all.

    Our inexperience with the technology led us to making two initial mistakes that are a necessary background to explain yesterday’s incident.

    • The production cluster only used one index and one shard, so we didn’t actually make use of Elasticsearchs sharding feature at all, apparently leading to background jobs and queries requiring lots of RAM.
    • Even when we used Graylog and Kibana as example for using timeseries with ES, we didn’t actually look at their concrete usage.

    Our implementation for cleanups uses delete by query and required optimize with the only_expunge_deletes flag to rebuild the Lucene segments after each cleanup to reclaim disk space.

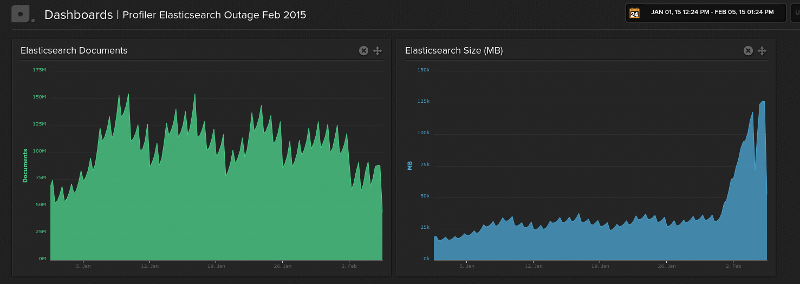
    Every day in January about 50-75 million new documents were put into the same index and then deleted by date range query after their retention time was over. I have prepared two graphs that show the total number of documents and disk space used by Elasticsearch showing this behavior:

    OutageOutage

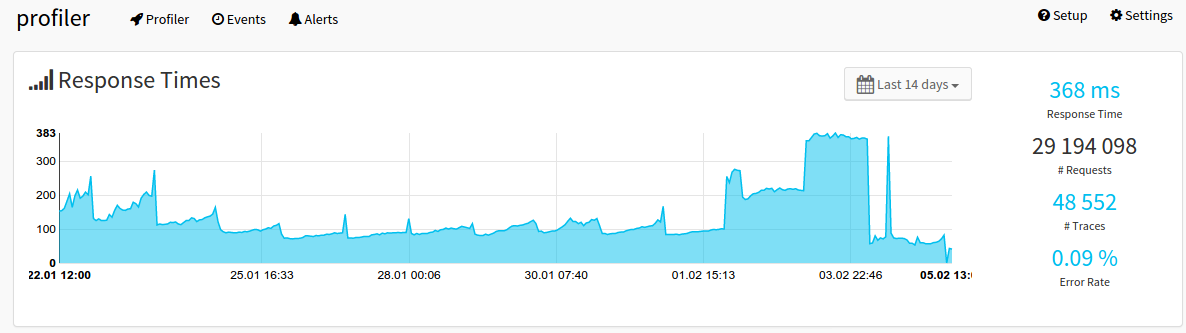
    The “delete+optimize+expunge” operations are so expensive in Elasticsearch that we had a system wide spike in response times during this one hour time every day. You can see this overall response time (95% percentile) of the Profiler in the last 14 days:

    OutageOutage

    The spikes on the left show the exact dates of the cleanup job running, each day at midnight. The massive increase on the right side of the graph shows the response times due to failures starting Saturday.

    The downside of our cleanup implementation was the memory requirements: With the steady increase of customers using the Profiler for big websites, we had to increase the RAM for Elasticsearch before from 4GB to 8GB and then 12GB . However, whenever the cleanup job failed due to out-of-memory, the problem increased. The next day when the job would run, documents of two days instead of one had to be optimized away.

    Incident Timeline

    Starting Saturday January 31st, we saw a massive increase in disk space used by Elasticsearch that we couldn’t account for in terms of documents. During January our cleanup job managed to keep the size of Elasticsearch at around 30-40GB, however during Saturday and Sunday it increased to 75GB of data.

    You can see this on the right graph above when the spiking suddenly stopped and the disk space started increasing massively.

    The “delete+optimize+expunge cleanup” started to fail on Sunday night at 01:30, because the process required too much disk space and the harddrive on one node went to 100% usage. The night shift of our hoster Syseleven reacted immediately, doubling the disk space of both nodes so that the Profiler could continue running uninterruptedly.

    I couldn’t find out why the Elasticsearch disk size grew so much, but assumed it must be some kind of fault caused by our massive delete and optimize usage. When the number of documents every day stays roughly the same, the disk space should roughly stay at 40GB as well.

    On Monday morning I removed the daily optimize+expunge from crontab and scheduled to work on a solution on when I had multiple consecutive days to work on the problem. I figured this timeframe would suffice with the increased disk space and no more OutOfMemory problems because of the halted job.

    From Monday to Wednesday the database grew further from 75GB to 126GB and I suppose having just one shard for this amount of data is not what Elasticsearch can easily handle.

    It was not a good idea to wait: On Wednesday 6:05 Europe/Berlin time our Elasticsearch cluster went down when it ran OutOfMemory and file descriptors. One node of the cluster did not recover from this error anymore and the other responded to queries with failure.

    The workers processing the performance and trace event log data with Beanstalk message queue stopped.

    The first immediate step was getting the system running again. Initially we couldn’t get the nodes to restart and queries were failing even after restarts. The cluster recovered at 9:50 after Syseleven increased the RAM of both nodes in the Elasticsearch cluster from 12GB to 32GB and the number of allowed file descriptors.

    At 13:00 we restarted all the workers, at around 13:15 all data was up-to-date again.

    Just increasing the RAM is obviously not the solution to the problem, which is why we worked on migrating the data in the last 24 hours to new indexes using more than one shard and making use of the Elasticsearch index alias and templating feature.

    We didn’t have much tooling for our elasticsearch setup, so most of the deployment and migration code had to be written from scratch, which took me the full Wednesday. At 20:00 we started migrating data into new indexes, which was completed around 10:00 this morning. We had to restart one job multiple times to adjust the Scroll API usage for the best possible import performance.

    Solution: Using Date-Based Indexes and Aliases

    Our solution for fixing our one index/shard/cleanup problem: Instead of DeleteByQuery and Optimize/Expunge we create a new index for each day, week or month (depending on retention) and write documents to the index where they occured. These date based indexes need mappings and settings, which you can define using templates.

    For example, our performance data is now saved in indexes with the naming schema measurements-$Year-$Month-$day. We have an index template that automatically adds mappings and settings to all indexes starting with measurements-*:

    $ curl http://es1.profiler.qafoo:9200/_templates/measurements {
         "template": "measurements-*",
         "settings": { ... },
         "mappings": { ... },
         "aliases": {"measurements": {}} 
    } 

    When a new index measurements-2015-02-05 gets created it will use that settings and mappings automatically. Important here is the definition for index aliasing.

    All reads on the Profiler will use the measurements alias instead of the date based indexes. This way the application doesn’t realize it is using multiple indexes in the background.

    Now cleanup is just deleting old indexes, which is a simple file-based delete operation and requires no expensive operation inside Elasticsearch.

    Another thing that we have started implementing with sharding in place is routing. We can easily partition all the data we have on a single profiled application into one shard. For big customers, their applications now fall onto different shards as well, which should hopefully lead to evenly distributed documents.

    During the migration we set the _routing key for all the migrated documents. We will test if we can filter by routing key in queries without problems in the next days.

    Be aware though that much of the conclusions we discussed here are applicable only when you use Elasticsearch as a time series database, not as a search database.

    Monitor all the things

    We are lucky to catch most of the issues directly, because of our own monitoring with Librato/Opsgenie and Syseleven Nagios Monitoring. However, with every incident, you find new ones for your tool belt:

    • For Elasticsearch it is important to monitor the number of used file descriptors as percentage of all the handles available.
    • The max size of a shard in Elasticsearch could be an indicator for required resharding. It depends a lot on each use case though, there is no hard rule here.

    Summary

    The take away from this outage is: Know your database. We have been using Elasticsearch naively for the last months and paid the price now having to redesign the whole persistence in 24 hours. What saved us from a failure with data loss is that we did not trust Elasticsearch with our data to begin with, saving event logs to disk and putting a queue in between.

    Histograms are back

    Histograms are available again to all customers starting today. The stability of this feature has been tested by several customers in the last weeks.

    We believe histograms are very important when monitoring response-times, so when we removed this feature temporarily in October we knew it would come back soon.

    In statistics, the calculation of the average assumes a normal distribution of all the recorded values, an assumption that is not true for response times. The average response time is a largely misleading metric. Benchmarks calculating this value should not be trusted.

    For this reason we use 95% percentile in our charts. The 95% percentile is calculated by sorting all response times in order and picking the highest value that is lower or equal to 95% of all requests. Picking the 95% percentile over 90% or 99% is rather arbitrary, we are working on better data structures that allow you to compare those values. Computing percentiles with a huge amount of data efficiently is not an easy task.

    Where do histograms fit in this picture? Code usually has different execution paths depending on input, influencing the response times heavily. This could be due to caching, invalid user-input leading to early exit or many other causes.

    Histograms take a different angle on data, removing the time dimension and counting the number of occurances that fall into a pre-defined interval such as 0-29ms, 30-59ms and so on.

    The following histogram extracted from the Profiler is an example of how helpful histograms are:

    Histogram with two PeaksHistogram with two Peaks

    There are two peaks in this histogram, suggesting there are two execution paths in the code that handle this transaction.

    Compare this to a more boring transaction that has only a single peak:

    Histogram with one PeakHistogram with one Peak

    Histograms complements charts with time and percentile values, allowing you to better understand how you need to optimize your code to achieve better performance for your users.

    Filtering Callgraphs

    After our holiday break in December we are happy to introduce the first new feature of 2015. We are starting small with the addition of filtering options for callgraphs.

    To improve the experience when looking at callgraphs it is necessary to adjust them to the current data you are looking at. After all even XHPRof’s original UI allowed configuring some filters if you knew the magic GET variables to pass.

    Before this change callgraphs were limited to a depth of 15 calls, unlimited children per call and a 1% threshold of total response time for calls to be included. Depending on the kind of project, these defaults either lead to very wide and deep graphs that are hard to navigate or to boring graphs that include even the most unimportant paths.

    When you now visit the callgraph of a trace you will see three new dropdowns to filter the callgraph:

    • Depth controls the number of calls that are displayed starting from the main node.
    • Children/Node controls the maximum number of children displayed for every call.
    • Call Threshold controls the minimum duration of a call to appear in the result as a percentage of the total response time.

    See this screenshot with a current trace of the Tideways Profiler itself:

    Callgraph FilteringCallgraph Filtering

    We have also changed the defaults of some options to improve the experience. Children/call now defaults to “2” instead of the previous “Unlimited” and the depth has been reduced from 15 to 10.

    Environments Revisited

    We have revisited the “Environments” feature of the Profiler and are stopping to collect performance data on non-production environments. With this change the user-experience becomes much better, because we can now always display the production data graphs. The environment switch dropdown was removed from the UI.

    Our customers so far haven’t used performance data from other environments and we came to the conclusion that the additional complexity in the user-interface is only causing confusion.

    Nothing has changed for regular profiling traces: They are still collected for every server and environment.

    If you do need performance data, for example during load-tests of staging environment, you can just add a second application to your account and use that for testing.

    New Extension Release: Auto-Start Profiler

    We released an important milestone with the Tideways Profiler extension today. The new version allows you to start profiling and monitoring your applications without any code modifications. Documentation and setup guides will be adjusted to reflect this much simpler installation in the next days.

    When you install the PECL extension in version 1.3.2 from the Debian/Ubuntu repository or the Tarball, the dependency to the PHP library is now bundled. During request startup the PHP library is loaded directly from the extension. The TidewaysProfiler class is available in every request as if it was a built in PHP class.

    The API Key, sampling rate and transaction function can then be configured from the php.ini:

    # php.ini tideways.api_key=abcdefg tideways.sample_rate=10 tideways.transaction_function=SymfonyBundleFrameworkBundleControllerControllerResolver::createController 

    Or alternatively by setting the values as environment values, for example in PHP-FPM Pool

    env[TIDEWAYS_APIKEY]=abcdefg env[TIDEWAYS_SAMPLERATE]=10 env[TIDEWAYS_TRANSACTION_NAME]=SymfonyBundleFrameworkBundleControllerControllerResolver::createController 

    or Apache2 Configuration:

    SetEnv TIDEWAYS_APIKEY abcdefg SetEnv TIDEWAYS_SAMPLERATE 10 SetEnv TIDEWAYS_TRANSACTION_NAME "SymfonyBundleFrameworkBundleControllerControllerResolver::createController" 

    In combination with the daemon installation, which already requires zero interaction, it is now possible for operations to fully automate the installation of the Profiler using orchestration tools like Puppet, Chef or Ansible.

    Please note that auto-starting the Profiler is entirely optional. If you prefer starting the Profiler explicitly from your application this is still possible.

    You can control the auto-start behavior of the extension with two additional php.ini variables:

    • tideways.load_library=0 will disable loading Tideways.php entirely.
    • tideways.auto_start=0 will only disable the autostarting functionality and you have to call TidewaysProfiler::start() yourself. Autostarting only works when the API Key is provided in the INI as well.

    With the introduction of the INI variables for api-key and sample-rate, passing them to the start() method becomes optional:

    <?php
    
    TidewaysProfiler::start(); 

    This will force the generation of a trace for this console script invocation.

    We have also updated the daemon to a new version 0.3.1, which contains improvements in error handling, error logging and data transfer encoding.

    You can find pre-compiled binaries for the PECL extension and the Daemon on our downloads page.

    Note: We found that loading PHP code from within an extension is not compatible with Xdebug yet. In case you use Xdebug, the auto-loading feature is automatically disabled and the TidewaysProfiler class will not be available to you. A fix for this problem is already merged to the current stable branch of Xdebug and should be part of the next Xdebug 2.2.7 release.

    Chrome Extension to Start Tracing

    We are releasing a Chrome extension for Tideways today. The extension allows you to force the collection of traces for all requests of your current browser session with the push of a button, instead of having to wait for a random trace to be sampled.

    The Profiler already shipped with multiple triggers to generate traces directly from your application before but the feature left a lot to be desired. For example it was nearly impossible to test POST- or Ajax-requests before.

    After installing the extension, start using it by clicking on the “Profiler” icon next to your URL location. You will see a list of all your applications like the one in the screenshot below.

    Chrome ExtensionChrome Extension

    Pick the application to profile and the tracing starts. This works by creating a cookie with a short lifetime of five minutes. Tideways will react to this cookie on the server side. If you picked the wrong application which is not connected to the site on the current URL, nothing will happen.

    On the Profiler UI you can list all the traces that were generated in the tracing session. Click on “Traces” in the application overview to see them.

    You can download the Chrome extension from the Google store to try this new feature.

    Using the Chrome extension requires at least Tideways PHP library version 0.11 on the server.

    A note on security: Triggering a trace is secured with HMAC based on your API-Key and a short expiration date. This prevents malicious users from generating traces on your production servers. The API key is never sent directly to the extension or your site, avoiding that anybody will accidentally get access to the key through logfiles, HTTP referers or by sending the cookie to the wrong site.

    Improving XHProf further

    Almost a month passed since our last blog post on the XHProf extension and we are happy to announce more improvements today that were necessary to improve the experience and performance of the Profiler. We released all this as v0.9.7 of XHProf.

    Skipping userland functions

    XHProf ships with a flag called XHPROF_FLAGS_NOBUILTIN which ignores all built-in functions during profiling by not overwriting the Zend Engine hook. This is a very efficient mechanism to save a lot of performance, however the other way around is much more interesting, skipping userland functions.

    We have introduced a new flag XHPROF_FLAGS_NOUSERLAND that does just that, ignoring all userland functions during profiling by not hooking into zend_execute.

    New “layer” profiling mode

    When using XHProf for permanent production profiling, a full trace for every request is just a waste of CPU cycles. To get an overview of the performance using the average response times of different layers such as I/O, database, cache and HTTP is just enough.

    With support for XHPROF_FLAGS_NOUSERLAND and the function whitelist we have added a third feature called layers that is both available in normal xhprof_enable() as an option but also with a dedicated call xhprof_layers_enable():

    <?php
    
    xhprof_layers_enable(array("mysql_connect" => "db", "mysql_query" => "db"));
    
    mysql_connect(); mysql_query("SELECT 'hello world'");
    
    $data = xhprof_disable();
    
    printf("%d calls with a total of %d ms", $data['db']['ct'], $data['db']['wt'] / 1000); 

    Fatal error traces

    For our error collecting feature we have missed traces for fatal errors from the beginning. Adding a new function xhprof_last_fatal_error() you are now able to access the trace inside a register shutdown handler.

    The output is the same as error_get_last() with a new key "trace". It also formats uncaught exception error fatals a little differently by using the exception class as “type”.

    This function only works when called after either xhprof_enable() or xhprof_layers_enable() and before xhprof_disable(), because it overwrites PHPs error callback only in this case.

    Stopping a trace unified

    In Facebooks xhprof you could call both xhprof_disable and xhprof_sample_disable to stop the profiling. Because internally xhprof uses a lot of global state, we had to unify this approach to work with a single function only, xhprof_disable, to avoid bugs when calling the wrong disable method.

    Testing the changes

    This time you can easily test everything as well, we have pre-compiled the extension for 64bit Linux for PHP 5.3, 5.4 and PHP 5.5. This is still considered beta and you should expect it to segfault in some cases. The code is provided AS IS with no warranty that it works on your machines, please don’t use it in production yet.

    If you want to compile it yourself, see the Github repository. Make sure to copy ext/curl/php_curl.h from the php-src to your PHP’s include directory; otherwise it won’t compile.

    Our first experiments with PHP 5.6.0 show that XHProf is not compatible out-of-the-box. We are working on fixing them as soon as possible.

    Outlook

    With this milestone we are working on stabilizing all our changes to XHProf and focussing on the Profiler UI again. The layer and argument functionality is already integrated, but there is still a lot of room for improvement.

    After this round of changes we will also be looking at activating new beta testers. In the current closed beta, our users have already created 56 applications that transmit a total of 2.5 million requests a day which has already required us to dedicate some time to scaling, which is why we haven’t added a lot more beta testers yet.

    Improving the XHProf Extension

    Note: This post is outdated. Please find more information about our current improvements to the XHProf extension on its Github page.

    We rely on the XHProf PHP extension to collect profiling data for your applications. XHProf was developed by Facebook during the times when they still used PHP. Since its release it remains largely unmaintained except the occasional bugfix to allow compilation with recent PHP versions. In the last month, the extension moved from the official Facebook repository to another organization and should be considered unmaintained by Facebook.

    To allow a stable integration of XHProf with the Tideways in the future, we have started to maintain our own fork of the project. At the moment the fork includes bugfixes and several improvements.

    We haven’t started an “offical” repository for the fork yet, instead you will find the code in several branches of our fork.

    Our mid-term goal is to release all these changes under an open-source license as a new extension.

    Compiling with PHP 5.5.8+

    Starting with PHP 5.5.8 XHProf would segfault because of a change in how the Zend Engine represents a function execution. There was an unmerged Pull Request on the XHProf repository which we merged into our fork.

    Function Whitelist

    Our first new feature is a whitelist of functions to profile as an opposite to ignore_functions that was already implemented using a new option called functions.

    With a whitelist of interesting functions such as PDOStatement::execute, curl_exec and file_get_contents you can already find the most critical performance bottlenecks that are I/O related without collecting data for all the other function calls. This improves the performance of XHProf massively allowing to collect data for non-PHP layers on every request.

    We have already turned this into a feature in the Tideways where you can see the performance of those layers over time:

    LayersLayers

    You can activate this functionality by invoking XHProf with the following options:

    xhprof_enable(0, array('functions' => array('PDOStatement::execute', 'PDO::commit', 'curl_exec'))); 

    Argument Summary

    One drawback of the current XHProf is its one-level hierarchy of tracing data, especially with respect to SQL queries or expensive HTTP/Filesystem calls.

    The information that PDOStatement::execute was called 100 times and took 2 seconds is interesting but not nearly as interesting as the information which of the 100 queries was actually slow.

    By default XHProf only collects the information about parent and child functions. For this simple script

    <?php
    
    xhprof_enable();
    
    for ($i = 0; $i < 3; $i++) {
         strlen(str_repeat("x", $i));
    }
    
    echo json_encode(xhprof_disable()); 

    the output would look like the JSON structure below:

    {
         "main()": {
             "ct": 1,
             "wt": 116
         },
         "main()==>str_repeat": {
             "ct": 3,
             "wt": 22
         },
         "main()==>strlen": {
             "ct": 3,
             "wt": 1
         },
         "main()==>xhprof_disable": {
             "ct": 1,
             "wt": 0
         } 
    } 

    If you wanted to know which of the three calls of strlen was slow, no luck.

    Our hosting partner Syseleven worked on solving this question before and came up with a partial improvement of the XHProf extension that allowed defining a whitelist of functions whose arguments should be included in the profiling. Changing the script:

    <?php
    
    xhprof_enable(0, array('argument_functions' => 'strlen'));
    
    for ($i = 0; $i < 3; $i++) {     strlen(str_repeat("x", $i)); }
    
    echo json_encode(xhprof_disable()); 

    Would yield:

    {
         "main()": {
             "ct": 1,
             "wt": 130
         },
         "main()==>str_repeat": {
             "ct": 3,
             "wt": 18
         },
         "main()==>strlen#": {
             "ct": 1,
             "wt": 1
         },
         "main()==>strlen#x": {
             "ct": 1,
             "wt": 0
         },
         "main()==>strlen#xx": {
             "ct": 1,
             "wt": 0
         },
         "main()==>xhprof_disable": {
             "ct": 1,
             "wt": 0
         } 
    } 

    This works for simple functions only, not for those that rely on data from previous function calls. That means curl_exec, PDOStatement::execute and almost any filesystem related call such as fgets would not show the arguments you are interested in. In addition SQL queries, filenames and URLs can be very long, but we are limiting the size of keys to 255 chars to avoid massive memory consumption of the profiling data structure.

    That is why we have improved the Syseleven patch to handle the following special cases:

    • fopen shows the opened file or url as well as the resource id. Query Strings are omitted.
    • fgets, fputs, fclose and many related functions show the passed resource id, allowing correlation with fopen calls.
    • curl_exec shows the requested url except the query string.
    • PDOStatement::execute shows the executed SQL query as a summary, which contains of the primary SQL keyword (select, update, delete, insert, other) and the affected main/first table found in the SQL statement.
    • Every PDO, ext/mysql and ext/mysqli query that executes a query shows a summary of the query.

    Let’s look at a simple example to understand how those special cases are handled:

    <?php
    
    $args = array('fopen', 'fgets', 'curl_exec', 'PDOStatement::execute'); xhprof_enable(0, array('argument_functions' => $args));
    
    $pdo = new PDO('sqlite:memory:'); $pdo->exec('CREATE TABLE foo (id INT)'); $stmt = $pdo->prepare('SELECT * FROM foo'); $stmt->execute();
    
    $fh = fopen(__FILE__, 'r'); while ($line = fgets($fh)) { }
    
    $ch = curl_init('http://qafoo.com'); curl_setopt($ch, CURLOPT_RETURNTRANSFER, true); curl_exec($ch);
    
    echo json_encode(xhprof_disable()); 

    And its related XHProf Output formatted as JSON:

    {
         "main()": {
             "ct": 1,
             "wt": 5730
         },
         "main()==>PDO::__construct": {
             "ct": 1,
             "wt": 277
         },
         "main()==>PDO::exec": {
             "ct": 1,
             "wt": 379
         },
         "main()==>PDO::prepare": {
             "ct": 1,
             "wt": 39
         },
         "main()==>PDOStatement::execute#select foo": {
             "ct": 1,         "wt": 44     },
         "main()==>curl_exec#http://qafoo.com#7": {
             "ct": 1,
             "wt": 4457
         },
         "main()==>curl_init": {
             "ct": 1,
             "wt": 73
         },
         "main()==>curl_setopt": {
             "ct": 1,
             "wt": 15
         },
         "main()==>fgets#5": {
             "ct": 21,
             "wt": 28
         },
         "main()==>fopen#/tmp/args.php#4": {
             "ct": 1,
             "wt": 28
         },
         "main()==>xhprof_disable": {
             "ct": 1,
             "wt": 1
         } 
    } 

    Argument summaries are still experimental and we are currently cleaning up the code before releasing another binary and integrating its output into the Tideways UI.

    If you want to experiment with it, the code is currently residing in the sql_summary branch on Github.

    Compiling it requires one additional manual step, copying the file ext/curl/php_curl.h from the php-src into the include folder, because it isn’t exposed to other extensions by default.

    We have plans for further improvements:

    • Support for profiling template engines such as Smarty and Twig
    • Grouping PDO and mysqli calls by Transaction-IDs to allow profiling commit operations and their related queries.
    • ext/MongoDB Support

    We are also open for suggestions to add other extensions or functions, maybe even framework/application related support if it makes sense.

    Asynchronous Calls

    PHP has limited support for asynchronous I/O, some extensions however provide such functionality for example curl_multi_exec, mysqli_async_query and stream_select.

    When profiling code with multiple execution paths running at the same time, XHProf would currently ignore all the asynchronouspaths and only report the wall time for the PHP request itself.

    We are currently planing to add a feature that will track the asynchronous paths as well. With this functionality you can see the duration of async queries and requests through the Tideways UI and get numbers on how efficiently you use async operations.

    Conclusion

    XHProf is very much alive and we are enjoying to work on all the improvements. We want to contribute all these changes back to the community as OpenSource patches so you can benefit even without using our Profiler offering.

    Improving XHProf Trace Analysis

    With several waves of beta testers using the Tideways, we already recieved a fair share of feedback, both positive and negative. One point of criticism was centered around the user interface, particularly unexpected page reloads and weird back-button behavior.

    Today we are happy to introduce the completely redesigend transaction and profiling traces view. You can now inspect several XHProf traces at the same time and never loose focus. We are using the javascript history API for navigation in traces, creating both a fast user experience and the possibility to share even the deepest bit of information with your colleagues by copying links.

    In addition we have improved the summary of a trace to highlight the most relevant information for you.

    New Graphical Tools

    We have also added more graphical analysis tools. For XHProf traces two different sets of graphs are useful given exlusive and inclusive wall times of function calls:

    1. For exclusive wall-times, that means the real performance impact of a function without all calls to child functions, we have introduced a treemap. The bigger the box of a function the more exclusive wall time it is using during the request.

      By clicking on a box you can directly open the call details page.

    2. For inclusive wall-times, own and child wall time, we added a so-called sunburst chart, starting in the middle with a circle for the main method of the analysed trace and adding layers of circles around it always proportionally to their share of the response time.

    Both graphs should be considered experimental and we already have a list of improvements, however even in this early state they are invaluable for spotting performance problems.

    Searching for Traces

    In the performance section of your application, searching for a particular XHProf trace was not easy. To allow you find traces we have added a new feature: Search. You can filter by transaction names, HTTP method, urls, servers and many other criteria to find traces you are interested in.

    Search will be improved in the next weeks to allow even more filtering and integrate more smoothly into the trace details view.

    We are looking forward to your feedback on these new features.

    Efficient collection of profiling data

    One of the first challenges when collecting profiling data from PHP requests regularly is the question of efficency. One central requirement we faced for the application performance monitoring is minimal overhead.

    There are two dimensions to this question, one is the aspect of transmitting and storing the other is about the optimal sampling rate. This blog post will discuss the first aspect and the second one is left for another blog post.

    With the requirement of minimal overhead in mind, directly transmitting profiling data to the profiler REST API disqualified immediately.

    Direct transmission without degrading user performance might work with UDP, however xhprof profile traces can easily amount to hundreds of kilobytes, way too big for UDP packages. Sending data to a remote server via UDP will also very likely lead to a significant amount of missing packages.

    Sending via HTTP (TCP) would degrade performance significantly. By default I/O is blocking in PHP. Sending several KB to another server around the world can easily translate into a poor performance for your end-users. Non-blocking I/O however is not trivial to use in PHP and in our case useless: sending the profiling data is done as the last operation in the request with no other work to parallelize.

    We needed a way to separate storing the profiling data before sending it to the central platform and decided to implement a daemon, acting as a proxy between all your application PHP requests and the Profiler REST API. It is written in Go to allow for very high concurrency and efficient asynchronous I/O.

    The daemon accepts data over two different network interfaces, UDP for the permanent request performance measurements and Unix Socket for profiling data. Given the daemon runs on a local machine, the socket timeouts can be set to very low numbers of milliseconds, avoiding to block PHP requests even more.

    Efficency when transmitting and storing data is also important. The daemon aggregates the performance data on a minute by minute basis, avoiding a constant stream of one dedicated http request for every request your application serves. It also discards profiles that don’t add value for your analysis, for example when collecting profile traces with average wall times for the high traffic frontpage in small second intervals.

    This serves two goals:

    1. Not transmitting huge amounts of traffic, potentially costing money.
    2. Preventing the daemons from accidently launching a distributed denial of service attack on the Profiler REST API when traffic starts to increase.

    The current process works, however, there is still a lot of room for improvement. It will be one of the tasks during the closed beta to add more logic with regard to filtering and aggregation. Our early access customers already provide us with very differentiated usage patterns to improve the situation. We are preparing to add more beta testers in a few days to get more feedback on the process.