Posts

Use timeouts to prevent long-running SELECT queries from taking down your MySQL

You may be wondering if your users can slow down or even DOS your MySQL database with an unlucky request. If it contains just the wrong number of conditions in your advanced search form triggering a full table scan on a dataset that is much larger than you have anticipated they probably can.

If you provide advanced search, aggregated statistics, reporting or data export functionality in your application, then the occasional long running query is part of the design. You may not have suffered database overload and slowdowns yet, only because your users aren’t constantly using these features.

Up until MySQL 5.7 you had no easy way to protect yourself from large amounts of users DDoSing your database with long running queries. In addition the PHP max_execution_time does not apply to waiting for network calls as shown in this previous blog post on max_execution_time. This means your PHP scripts and MySQL connections can be blocked as long as a query runs, worst case for several minutes or hours.

When you Google this problem, the recommended solution is running a daemon or cronjob that monitors the process list and just kills the long-running queries. This certainly works, but you don’t know who is running the query and why, which prevents you from applying more fine granular timeouts based on the context (web vs. background process for example).

With MySQL 5.7 you can now use a new optimizer query hint to configure the max execution time of SELECT queries in milliseconds.

SELECT /*+ MAX_EXECUTION_TIME(1000) */ status, count(*) FROM articles GROUP BY status ORDER BY status; 

Or you can set a session-wide or global timeout:

SET SESSION MAX_EXECUTION_TIME=2000; SET GLOBAL MAX_EXECUTION_TIME=2000; 

The timeouts only apply to read-only SELECT queries.

If your query takes too long, it fails with the following error:

ERROR 3024 (HY000): Query execution was interrupted, maximum statement execution time exceeded 

You can handle this error centrally in your application and display a message to users that the response took too long and was aborted.

Using an Exception Tracking software (such as Tideways) you can log which users, transactions or pages are causing these queries to get aborted, how often they happen and if the query performance can be improved.

New Integrations: PagerDuty and Generic Webhook

We have added two new integrations for Tideways in the last days that can receive notifications for Response Time Degradation, Error Rates, New Exceptions, weekly Reports and new releases.

The first one is for PagerDuty, an incident management platform. The support is similar to the one we have already for PagerDuty’s competitor OpsGenie.

The second one is a generic Webhook integration, where you can push the notification payload via HTTP POST to an URL of your choosing. The documentation page shows all the supported payloads with examples so that you can integrate Tideways with your own code as you see fit.

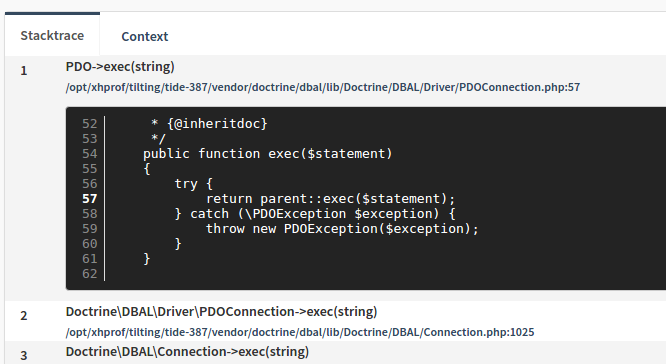
View the code context for the stack trace of exceptions/errors

We have released a new opt-in feature that allows the collection of code around every part of an error/exception stack trace. This feature is disabled by default. When enabled the Tideways daemon stores 10 lines of code around each step in the stack trace of an exception or fatal error.

You can enable this setting in the “Application Settings” screen for every application that supports Error/Exception tracking. It requires a tideways-daemon in version 1.5.4 or higher to take effect.

Sending code along to Tideways is tricky and for security reasons we strip the contents from single- and multiline string literals, herdocs and nowdocs directly on the daemon before sending them to us. Inconclusive blocks are completly ignored and never sent to our servers.

Introducing unlimited request plans

We are introducing new plans for Tideways and are retiring the request-based pricing on March 15th 2017. You can already visit the new pricing page with all the information.

New plans are billed per application and include unlimited monitored requests from unlimited servers. Tideways is primarily an “Always On” production profiler and tracing system and therefore pricing is now heavily influenced by how many traces we collect every minute and how long we store them for you. With the new plans, you decide on an upper limit of detailed traces collected from an application every minute, for example 25 traces/minute – which translates to roughly 1 million traces a month. Each new plan has a number of included traces/minute, but you can also increase the traces/minute limit in steps of 25. With this model, you have guaranteed fixed monthly prices you know in advance, based on your desired level of traces/minute, but independent of application size, architecture and host count.

If you are using Tideways as a traditional Profiler to manually generate Callgraph profiles, you will also be happy to hear that we increased the retention for manually triggered traces to 30 days, regardless of the plan. In the Lite plan this includes 10.000, in the Basic plan 25.000 and in the Standard plan 50.000 triggered callgraph traces per month. You can also purchase a dedicated upgrade to increase the retention to 60 days and add 250.000 additional callgraph traces/month.

For existing customers we are grandfathering all current plans and give you the choice to stay in your current plan or upgrade to the new plans if they suit you better.

What are the new prices? A Lite application with limited APM functionality and 24 hours retention costs 39€/application/month, the full APM functionality is available in either a Basic application with 3 days of retention starting at 89€/application/month or Standard application with 14 days of retention starting at 159€/application/month.

What is my benefit switching to the new unlimited request plans?

Our goal with these new plans is to make it simpler for you as a customer to calculate your Tideways costs up front and independent from month to month changes caused by server up- and down-scaling, seasonal business and application architecture. You decide on the level of visibility you want into your application and the duration we store this data for you and we optimize everything else. Instead of monitoring costs that directly scale with your application request volume, you can now decide yourself when and why to increase the amount of traces/minute because your application has grown in code-size and functionality, production traffic or both.

This is the next step away from the per-server pricing that many of our monitoring competitors sell. We think both servers and requests are a bad proxy for the value that you or your customers get from monitoring a particular application. Especially in this age of multi-cores, microservices, Docker and vertically scaled applications for increased reliability. You shouldn’t be punished for your choice of deployment technology, host topology or application architecture. With the new plans we can offer fair prices to customers that run on a single server and want to keep hundreds of traces every minute and customers that run on 10+ hosts but are fine with only a very limited visibility.

When you are upgrading to the new plans the minimal traces/minute configuration of 25 traces/minute for a basic plan is higher than the previous limit of 20 traces/minute that we built into the old plans.

I am not convinced, can I keep my old plan?

Yes, you can! We are grandfathering your current plan. You can continue to upgrade within tiers of the old per request model. You cannot subscribe to the old plans if you are not yet a customer. We do reserve the right to provide new features for the new plans only.

Remember that the new plans are designed to increase the visibility in your application, they store a higher amount of traces every minute than Tideways did before. Upgrading will give you access to more traces and better insights.

How does this affect Microservice/SoA architectures with multiple applications in Tideways?

We have released a new feature called “Services” last month, which allows you to collect data for a microservice/SOA-architecture into one application in Tideways and view performance statistics for each service individually. We suggest that you migrate your deployment to using services instead of multiple applications. Since this feature is only available to Medium (M) plans, if you have this problem and are subscribed to a Small (S) or Lite plan, please contact [email protected] and we activate the feature for you to prepare for a plan upgrade.

I have many tiny applications and the new pricing per application is bad for me

Unfortunately, if you have monitored dozens of tiny applications with a 3S or 10S plan before, then this pricing change will affect you the most. We realized in the last months, that for many features, continuous processing is necessary at the application level and unlimited applications is therefore not scalable for us with the current pricing. You will be able to support 4 applications (1 basic license + 3 staging licenses) for 69€/month if you are fine with just the bare minimum of monitoring visibility. Or you can just stay in the old pricing if it works better for you.

What about my staging, testing, QA and development environments? I have created additional applications in Tideways for them.

Both the Basic and Standard plan include 3 staging applications for free that you can use to collect this information without having to pay extra. This allows you to create applications for development, staging and testing environments. A staging application has 60 minutes retention, but has all the same features as a basic or standard application.

How is it possible to offer a fixed rate for unlimited monitoring on unlimited hosts?

The idea of unlimited request and server plans is in our minds for a while already, but it required a greater part of the backend engineering effort last year to support this offer. Our new data structures and processing pipeline is designed in such a way that a simple and lossless aggregation per minute is possible directly when collecting data on the daemon running on your server and again when we accept the data on our backend using an aggregation proxy. This is possible with the way we use HDRHistogram and several storage optimizations as explained in this previous post on our blog. Almost no aggregation or computations are necessary for data on our backend, we just store them on disk and index them in a database. We also automatically reduce the amount of monitoring detail for the long tail of transactions with very few requests. This way it doesn’t make much of a difference in terms of processing and storage if you have just one host, or hundreds of them. It does have the downside that monitoring data is only application-centric, not on the server-level, but we think that application-centric monitoring is much better suited to understand your the experience of your users anyways!

Improved time-range selection with the new preview-chart

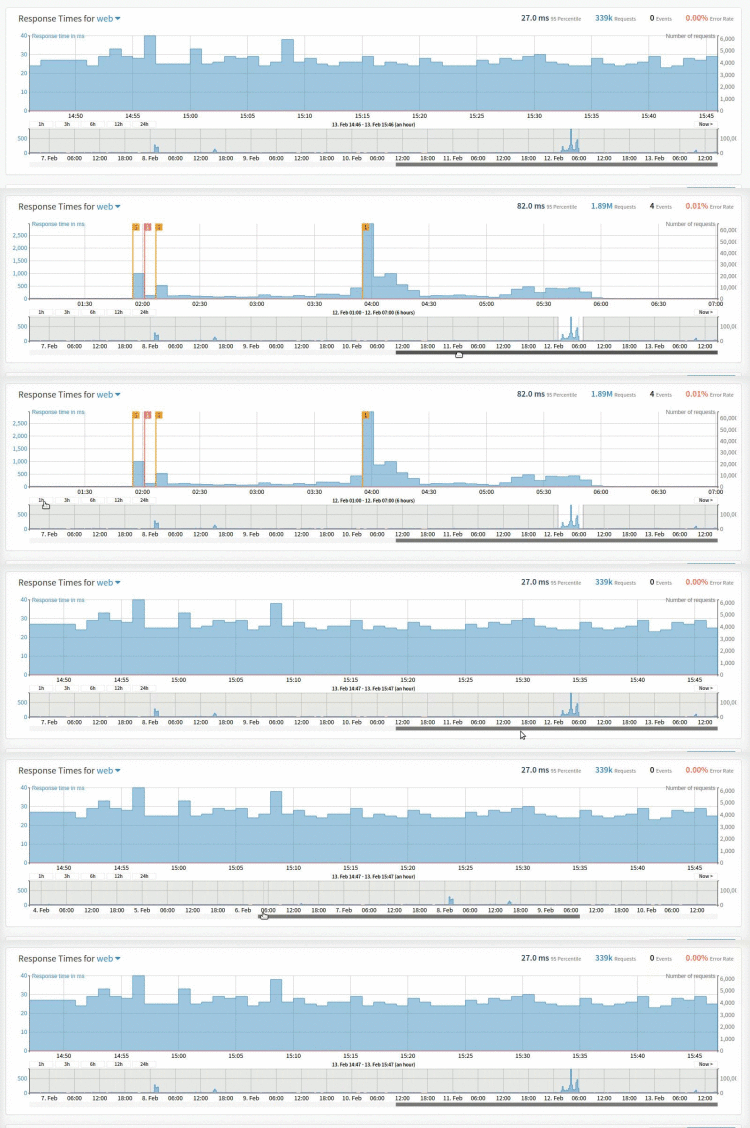
We are rolling out another new feature that has been high on our most wanted feature list for a while, a time-range selector using a small preview-chart with the response time trends of your application.

You can now select the time range you want to investigate directly from the preview-chart and all the other views with the detailed graph and transaction performance update automatically. Selections are a minimum of 60 minutes and a maximum of one day. You can use the scrollbar below the preview-chart to see the full timeline, which is important if you have a retention of 14 days. If you drag on the edges of the scrollbar, you can zoom-in or -out of the selection.

Kore and Sina jointly worked on this feature over the last 6 weeks as both frontend and backend required many changes and feedback loops to get the user experience and performance right for our existing scale.

As a boring technology company we had to make a difficult decision to introduce Redis as a new database into our stack, because its datastructures make it very suitable to store this the full data for each preview-chart as a list for very quick access.

For now to keep the operational risk low, we have set Redis up purely as a cache and the preview history can be re-created from our time series storage Elasticsearch all the time. The UI can also fallback to the old dropdown time selector when Redis is not available.

Slack, Hipchat and Flowdock notifications for new releases

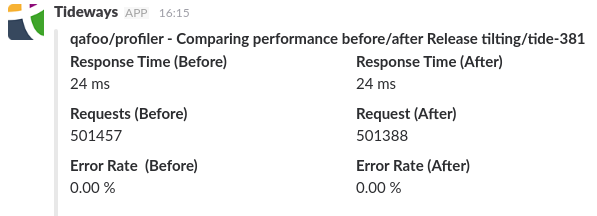
If you are using release events in Tideways to mark deployments of your application, then you will happy to hear that we have finally created notifications for them. Starting with Slack, Hipchat and Flowdock, you can now get a notification in two cases:

  • The release was just deployed (and a Tideways event was created for it)
  • Around 90 minutes after the release, when a before/after report is compiled.

You can see those events in action for our Slack integration in these screenshots:

To activate release notifications, go to “Application Settings”, then “Configure Notifications” and create a notification rule for “New Release”. You can decide if you want to get the 90 minute later report only if the performance dropped, but by default you will always see it.

Introducing Services: Monitoring micro-services, CLI scripts and workers separately

Your web applications usually runs in multiple contexts: the webserver, inside workers and as a cronjobs and it might even include calls to other micro- or SoA-services.

Today we introduce “Services” in Tideways, a feature that allows you to group transactions into multiple services that are part of a single application.

This feature is used through configuration on the PHP side by either setting an INI variable (or environment variable TIDEWAYS_SERVICE):

tideways.service=api 

Or programatically from within your code by calling:

TidewaysProfiler::setServiceName('api'); 

This will automatically start aggregating data on the new service called api and the data will be visible in the UI with no further configuration necessary. It will also show aggregated performance data for every transaction within a service. By default all requests are tracked in the service web and if you enable the tideways.monitor_cli=1 setting, then all CLI scripts are monitored in the service cli.

Before we introduced this feature, the “workaround” has been creating mutiple applications for each service, but since there is no way to connect data between multiple applications, you had to look in many places and connect information yourself.

By making different services within an application a first-class citizen in Tideways we can now work on connecting the dots and uncover this information automatically.

Please read the “Configuring Services” section in the documentation for more information on how this feature works.

“Services” are available to all customers with a medium plan (3M and up). You need to update the PHP extension to v4.1.1 and the daemon to v1.5.3 to make use of this feature.

Receive Weekly Report in Slack, Mattermost, Flowdock or HipChat channels

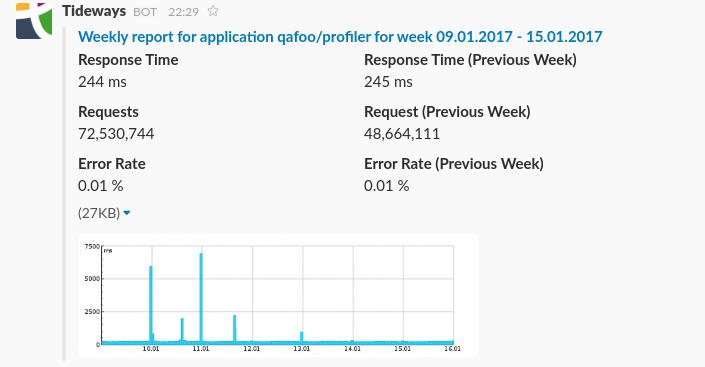
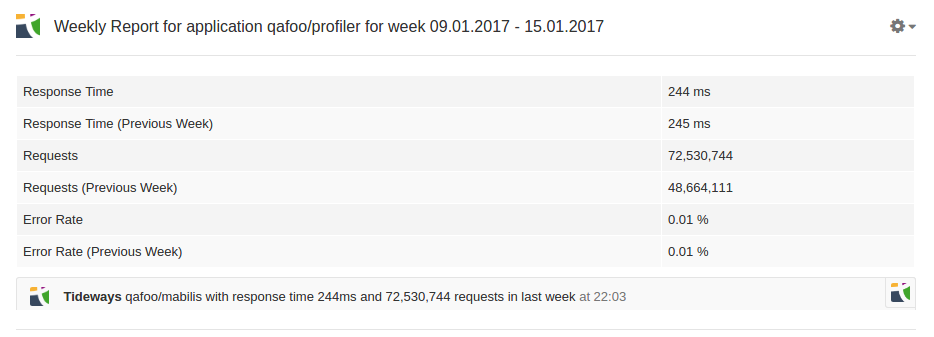
We are expanding our support for notifications about your applications performance with a Weekly Report notification that can be sent every Monday morning to Slack, Mattermost, Flowdock or HipChat.

Just go to your “Application Settings”, then “Configure Alerts” and then “Create Alert Condition”. You can select “Weekly Report” in the drop down and select your target notification channel.

We have prepared some example screenshots of the notifications.

In Slack:

In Flowdock:

Next Monday morning will be the first day these reports are sent, so set it up quickly to be one of the first users of this feature.

If you want to rely on the Chat Notifications entirely you can also disable e-mail based notifications for individual applications now.

Improved History View, Traces including Server Metrics

After a slow December of vacation and holidays we are slowly picking up steam again and are releasing the first new features of 2017 with an improved history and server metrics for traces.

History

The historical performance data that we collect for your application has been well hidden until now and was reached by clicking on links in the weekly report e-mail. Starting today, the history is more prominent and includes more features and data.

We have now enabled the “slim history” that is directly visible from the application overview and shows you the performance from Yesterday, Last Week and Last Month for comparison.

When you follow the links to the history view, then you can now see a more dynamic chart of the performance data and a new histogram that shows the full response distribution.

In addition to the weekly report you can now also view the historic data by day or month. Just use the select dropdown to toggle between the different views.

Server Metrics for Traces

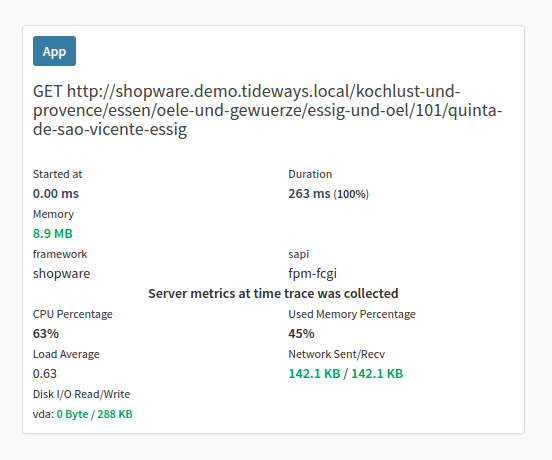
The latest version of the Tideways daemon now collects server metrics on CPU load, memory, I/O and disk usage during the execution of the trace. This information can be viewed directly from the trace details by looking at the main timespan details box on the right.

Using HTTP client timeouts in PHP

Timeouts are a rarely discussed topic and neglected in many applications, even though they can have a huge effect on your site during times of high load and when dependent services are slow. For microservice architectures timeouts are important to avoid cascading failures when a service is down.

The default socket timeout in PHP is 60 seconds. HTTP requests performed with for example file_get_contents, fopen, SOAPClient or DOMDocument::load are using this timeout INI setting to decide how long to wait for a response.

Since the socket/stream wait time is not included in PHPs max execution time you are in line for a surprise when requests take up to 30+60=90 seconds of your webservers precious processing queue before getting aborted.

Timeouts are scary, because you don’t know in what state you have left an operation when aborting. But in case of HTTP requests it is usually easy as a client to decide what to do:

  1. Abort my own request and show the user an error
  2. Ignore the timeout and just don’t display the data
  3. Retry (a maximum of 3-5 times for example)

And configuring timeouts has other upsides:

  • If the target server currently has load problems, then aborting with a timeout early could reduce the servers load enough to automatically recover at some point.
  • You can show users an error quickly and they don’t have to wait several seconds only to be taunted by an error page.

Setting the default timeout

Before doing anything else, you should decrease the default timeout early in your code to a value between 5 and 10 seconds:

<?php

ini_set("default_socket_timeout", 10); 

You should check your monitoring system (for example Tideways) for clues what a regular HTTP call duration is for calls to internal or third party systems.

If you have many different internal or third-party services in place, then it makes sense to configure individual timeouts based on their usual latency.

A thorough setup defines maximum limits for each internal and third party service and then encodes them in HTTP calls.

Configuring the timeout for individual file_get_contents/fopen calls

In stream based calls you can configure individual timeouts using stream contexts. This applies to for example file_get_contents and fopen:

<?php

// timeout of one second 
$context = stream_context_create(array('http' => array(
     'timeout' => 1.0,
     'ignore_errors' => true,
)));

$data = @file_get_contents("http://127.0.0.1/api", false, $context);

if ($data === false && count($http_response_header) === 0) {
     // request timed out, because $data is false even though we ignore
     // errors and we dont have response headers 
} 

Be aware that the timeout handling of streams seems not very accurate and requests can still take longer than you configured, especially when you go below 1 second.

Configuring the timeout for DOMDocument::load

In general you should not use the DOMDocument::load function to load remove XML or HTML. To allow for better error handling code it’s easier to use a HTTP client directly and then load with loadXML. But if you must use it or some library does, you can configure timeouts with stream contexts again in this way:

<?php

// timeout of one second
$context = stream_context_create(array('http' => array('timeout' => 1.0)));

libxml_set_streams_context($context);

$document = new DOMDocument();
$document->load('http://127.0.0.1/xml'); 

This affects all HTTP calls that PHP does through libxml.

Configuring the timeout for SOAPClient

The SOAPClient class does not use the PHP stream API for historical reasons. This means that timeout configuration works slightly different. Setting the timeout parameter in SOAPClients stream context does not work.

Instead you can either set the connection_timeout setting that handles timeouts before the connection was established or directly set default_socket_timeout in the code using ini_set. The only other way is to overwrite SoapClient::__doRequest method to use cURL.

<?php

ini_set('default_socket_timeout', 1);
$client = new SOAPClient($wsdl, array('connection_timeout' => 1));

try {
     $client->add(10, 10);
 } catch (SOAPFault $e) {
     if (strpos($e->getMessage(), 'Error Fetching http headers') !== false) {
         // this can be a timeout!
     } 
} 

Configuring the timeout for cURL extension

If you want to have more control about HTTP requests than with PHPs built in stream support there is no way around the cURL extension.

We have much better timeout control with cURL, with two settings: one for the connection timeout and one for the maximum execution time:

<?php

$ch = curl_init('http://127.0.0.1/api');
curl_setopt($ch, CURLOPT_TIMEOUT, 2); 
curl_setopt($ch, CURLOPT_CONNECTTIMEOUT, 1);

$response = curl_exec($ch);

if ($response === false) {
     $info = curl_getinfo($ch);

    if ($info['http_code'] === 0) {
         // timeout
     } 
} 

If you want to be more strict and abort on a millisecond level, then you can alternatively use CURLOPT_TIMEOUT_MS and CURLOPT_CONNECTTIMEOUT_MS constants, but the manual warns that this might still only be checked every full second depending on how cURL was compiled and setting a value below one second usually requires to ignore signals with curl_setopt($ch, CURLOPT_NOSIGNAL, 1); to avoid an immediate timeout error.

One important thing to remember is cURL has an indefinite timeout by default and does not obey the default_socket_timeout INI setting. This means that you have to configure the timeout in every cURL call in your code. With third party code this might even be complicated or impossible.

Seperate your slow backend from the important frontend traffic with PHP-FPM

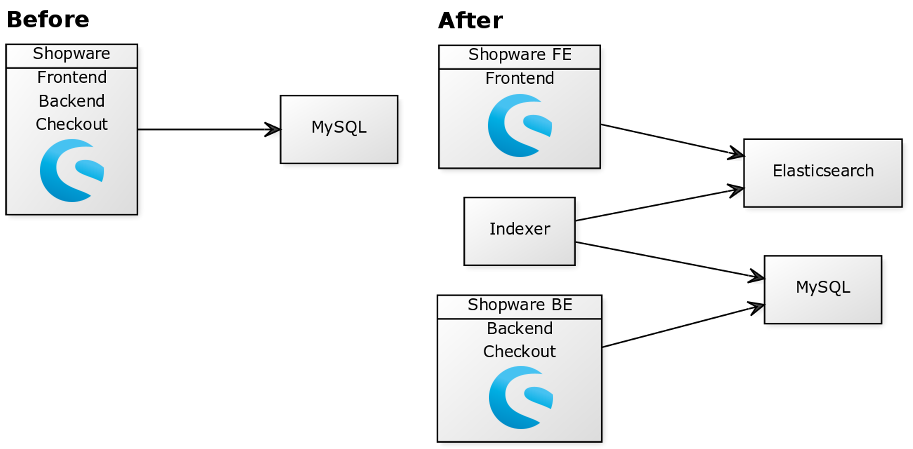
If you are using Magento, Shopware, Oxid, a CMS or any other off the shelf software, then usually they ship both the frontend and the backend in a single application. For self-developed applications with Symfony or other frameworks this is often the case as well.

The backend/admin may then include several slow reporting, administrative operations and data exports that can take a long time. This could congest the webservers processing queue by lowering the throughput for your customers that might just click on the checkout button and see a 502 Gateway error. We described this behaviour in the last blog post on What is the best value of PHPs max_execution_time?.

Putting frontend and backend on different servers is one solution, but this can be to costly for most use-cases.

A simple solution for this problem is using different PHP-FPM pools for the frontend and backend, each with their own configuration for the maximum number of allowed requests. This is also a solution for some of the problems discussed in the post on “What is the best value for max execution time?”.

Magento Admin and Frontend Example

How does this look like? Lets use Magento as an example, you can configure two pools in php-fpm.conf:

; php-fpm.conf [frontend] listen = /var/run/php-fpm-frontend.sock pm = static pm.max_children = 50

[backend] listen = /var/run/php-fpm-backend.sock pm = ondemand pm.max_children = 5 pm.process_idle_timeout = 5 

The frontend is configured for maximum of 50 simultaneous requests and the backend for a maximum of 5 simultaneous requests. The backend workers are created on demand and the frontend workers are static to avoid forking overhead. I will discuss the differences between PHP-FPM pool configurations in a future blog post.

You can then modify the Nginx vhost configuration for the Magento installation with the following switch:

server {     // ....

    set $fpm_socket "unix:/var/run/php-fpm-frontend.sock";

    if ($uri ~* "^/admin/") {
         set $fpm_socket "unix:/var/run/php-fpm-backend.sock";
     }

    location ~ .php$ {
         // ...

        fastcgi_pass $fpm_socket;
     } 
} 

Based on the ^/admin path in the request uri it will select the different PHP FPM pool now and frontend and backend will not compete and steal each other resources anymore.

Migrating users to new password hashing algorithms in Symfony

Along with the continous increase in computing power, the relative difficulty of breaking hashing algorithms decreases. It might occur that during the lifetime of a project, one algorithm becomes obsolete, or due to various reasons, the necessity of migrating to another algorithm becomes inevitable.

There are two major issues regarding such a migration. First, although the new users passwords can be easily encrypted using the new method, the plaintext form of already hashed passwords is not available for re-encryption. This can be overcome, by migrating those passwords gradually, when the respective users log in the next time. From the first solution, arises the need for the application to handle both the previous and the new hashing algorithms.

Following the official Symfony documentation, we can define dynamic password encoders in app/config/security.yml similar to below:

# app/config/security.yml

security:     encoders:         old:             algorithm: sha512             iterations: 5000         new:             algorithm: bcrypt             cost: 15 

The hashing algorithm which has been used to encrypt each user’s password, should be stored as well, and can be used to choose the encoder accordingly:

// src/Acme/UserBundle/Entity/User.php

use SymfonyComponentSecurityCoreEncoderEncoderAwareInterface;

class User implements EncoderAwareInterface {
     private $password;

    /** @ORMColumn(type="string") */
     private $encoder = 'new';

    //  Setters and Getters

    public function getEncoderName() {
         return $this->encoder;
     } } 

Up to this point, if newly registered users are configured to have new as their encoder, and through a database update, encoder is set to old for existing users, login functionality will work seamlessly for both groups.

ALTER TABLE user ADD encoder VARCHAR(255) NOT NULL; UPDATE user SET encoder = 'old'; 

However, to migrate the existing users passwords to the new algorithm, a listener which can capture successful login events, encapsulating the plaintext password, can be defined:

# src/Acme/UserBundle/Resources/config/services.yml

services:
     userBundle.userListener:
         class: AcmeUserBundleEventListenerUserListener
         arguments:
             - '@doctrine.orm.default_entity_manager'
             - '@security.password_encoder'
         tags:
             - name: kernel.event_listener
               event: security.interactive_login 

And implemented in the following way:

# src/Acme/UserBundle/EventListener/UserListener.php

use DoctrineORMEntityManager;

use SymfonySecurityHttpEventInteractiveLoginEvent;
use SymfonySecurityCoreEncoderUserPasswordEncoder;

class UserListener {
     private $entityManager;
     private $passwordEncoder;

    public function __construct(
         EntityManager $entityManager,
         UserPasswordEncoder $passwordEncoder
     )
     {
         $this->entityManager = $entityManager;
         $this->passwordEncoder = $passwordEncoder;
     }

    public function onSecurityInteractiveLogin(InteractiveLoginEvent $event)
     {
         $request = $event->getRequest();
         $user = $event->getAuthenticationToken()->getUser();

        if ($user->getEncoder() === 'old') {
             $user->setEncoder('new');
             $password = $request->request->get('_password') ;
             $user->setPassword(
                 $this->passwordEncoder->encodePassword($user, $password)
             );

            $this->entityManager->flush(); 
        }
     } 
 

Additionally, a second way to log into websites is usually the forgot password dialog. Depending on the implementation in Symfony this does not trigger the security.interactive_login event. In this case make sure to upgrade the password as well. If you are using FOSUserBundle, this can be done by upgrading the password algorithm to the most current whenever the setPlainPassword function is called.

class User extends BaseUser {     // ... other code

    const CURRENT_PASSWORD_ALGORITHM = 'bcrypt';

    public function setPlainPassword($password)
     {
         $this->encoder = self::CURRENT_PASSWORD_ALGORITHM;

        return parent::setPlainPassword($password);
     } } 

In this example, the current and the intented hashing algorithms are respectively sha512 and bcrypt. However, naturally, the choice of algorithms depends on the requirements of the project.

If the algorithm is already unsafe (md5, sha1, …) you should take more drastic steps and not slowly migrate the passwords to the new format, given that probably many users will rarely login or never at all if they are disabled. Again you can make use here of the security.interactive_login command and redirect users with a deleted password hash to the password reset page.

Finally, it is very important to note that since hashing algorithms are irreversible, one must take extreme care, and thoroughly test the migration functionality on test servers before deploying to production.

Slow Ajax requests in your Symfony application? Apply this simple fix

If you are using Sessions in PHP (the odds are very high) then you should know that write and read access to them is using pessimistic locking which means no two requests can run in parallel with the same session open.

Our blog post on Essential PHP Performance Optimizations mentioned blocking Sessions as one very common problem for performance in PHP applications. Multiple concurrent Ajax requests will wait for each other and make your application much slower than it must be.

The fix for this in pure PHP is to call session_write_close(), but in your Symfony 2 or 3 application this function is hidden below abstraction layers or might even be implemented differently.

First, because this problem is mainly present for Ajax requests we start with a generic solution that hooks into the Symfony Kernel Events to perform its job.

  1. Wait until all kernel.request events are processed, specifically those loading the session and the user object from it.
  2. Execute a listener as one of the last in kernel.request that checks if the Request is an Ajax request and if yes, calling to close the session.

EventListener that auto-closes Session on Ajax Requests

Here is a generic event listener that performs these steps:

<?php

namespace AcmeAppBundleEventListener;

class AjaxSessionCloseListener
{
public function onKernelRequest(GetResponseEvent $event)
{
$request = $event->getRequest();
if (!$request->isXmlHttpRequest()) {
return;
}
if (!$request->attributes->has('_route')) {
return;
}
$session = $request->getSession();
$session->save();
}
}

This listener must run after Symfony’s internal SessionListener and RouterListener so that the session object and current route name are available. The following XML service tag definition therefore includes a priority for the kernel.event_listener:

<service id="app.ajax_session_close_listener" class="AcmeAppBundleEventListenerAjaxSessionCloseListener"> <tag name="kernel.event_listener" event="kernel.request" priority="-255" />
</service>

Or if you prefer YAML:

services: app.ajax_session_close_listener: class: 'AcmeAppBundleEventListenerAjaxSessionCloseListener' tags: - { name: "kernel.event_listener", event: "kernel.request", priority: -255 }

And you are good to go!

Before you roll this out: Are you sure all your ajax requests never write to the session? CSRF protection in Symfony Forms for example writes to the Session. If you have one or two controllers that are called with Ajax and do write to the sesison, then you should implement a blacklisting mechanism based on route names or you could introduce special _ajax_write attribute in route defaults and check for it in the Listener.

Improved snapshots: Select and compare any time span, drill down

When the performance of your application changes you want to know the reasons why. In the last month we have kept relasing feature after feature that makes this easy and quick and Snapshots was one of them.

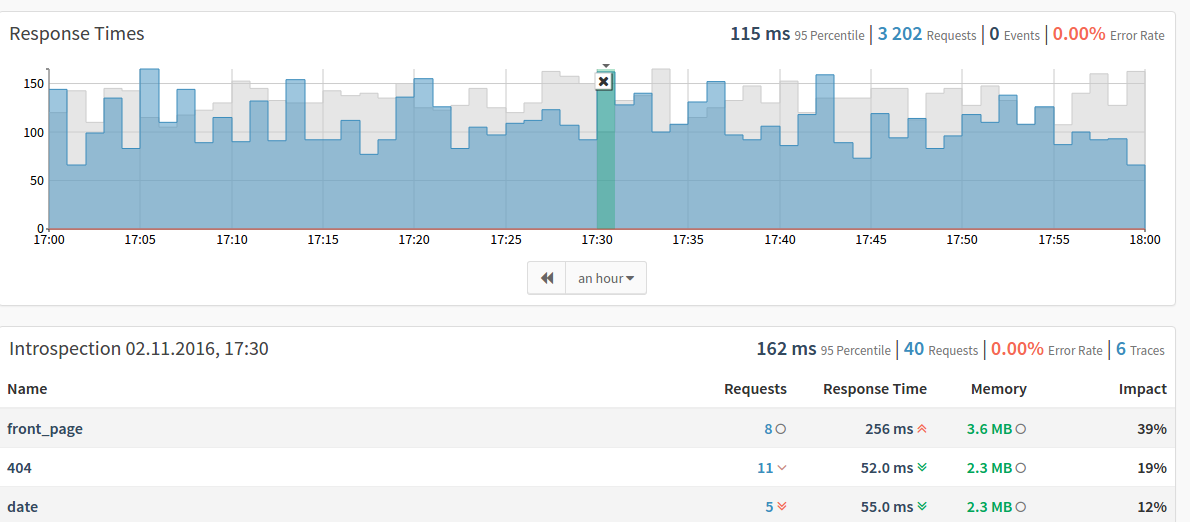
Clicking on any bucket in the application performance graph opens up a a view of the performance happening at the exact minute you selected.

Today we have significantly increased the value of this feature.

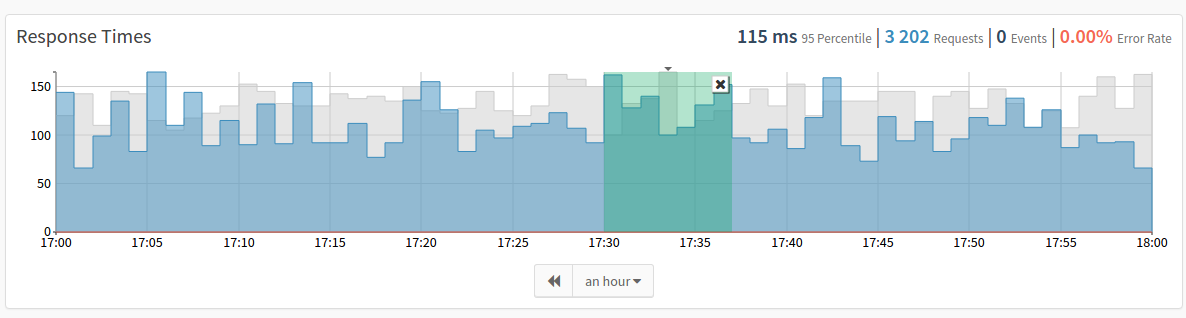
You can now select more than one minute in the application performance chart to view a performance snapshot of the entire selected time range. Keep the mouse pressed on the chart and start dragging it over all the time bucktes you are interested in.

The snapshot view then shows the response time, request amount, errors and details for each transaction in the selected time frame. Data from the snapshot is then compared to the values of the full time interval, which allows you to spot the outliers immediately.

If you then drill down into one of the transactions, you see the same time range immediately selected in the snapshot and the second box with the histogram shows performance data for just the requests happening in the selected time range.

This includes median, average, max and all percentile values for requests that happend during the selected time range.

How to implementing cache tagging with APC or Memcache without hurting performance

Cache tagging first appeared on my radar when I started working on Doctrine ORM in 2009 and the idea sounds extremely useful in theory. With cache tagging, cache entries can be grouped together under tag names, which then allows to simply invalidate all items with the same tag.

But When the Doctrine 1 team released cache tagging as a list of all members with a tag, suddenly users saw extreme slowdowns in their apps. For various reasons it is a mistake to introduce a cache key that is read and written to from essentially every request of the application, because it can cause massive performance problems when too many items are part of the same tag.

To guarantee consistency, caches use locks when they are being written to. If the same key is being written to at a very high rate, this can lead to considerable slow downs beause of locks. Another problem is the serialization overhead when cache tags contain a large amount of items.

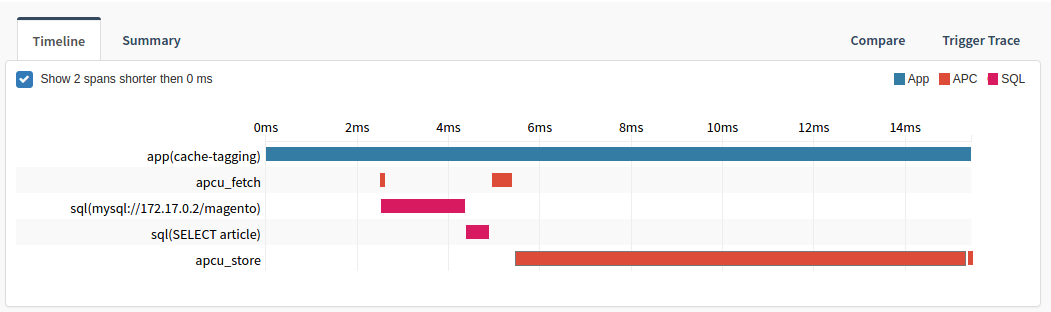
See this Tideways timeline with cache tagging using APC over 40.000 items with a shared key. The long apcu_store timespan of 10ms is the cache key being written.

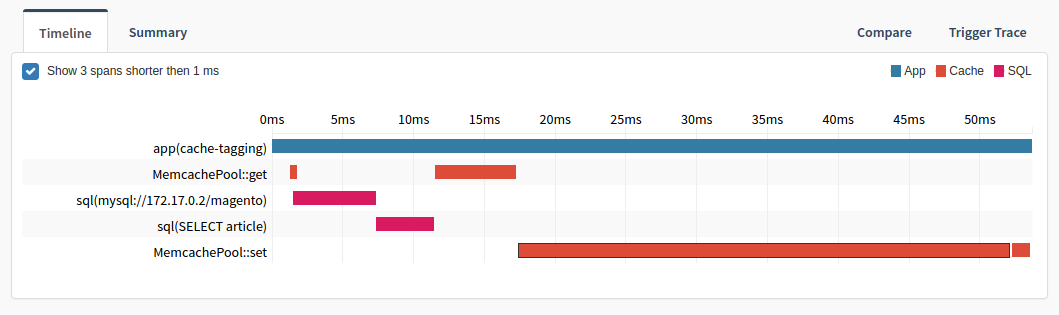
This effect is much worse when using Memcache, because it has to serialize the list of keys where APCu just copies the memory. in the same case of 40.000 items with a shared key it takes 5ms for MemcachePool::get and 34ms for MemcachePool::set to access and update the shared tagging cache key:

Naturally in Doctrine 1 the feature was immediately removed and we never reintroduced it back into Doctrine 2.

But even today many cache tagging implementations built on top of APCu or Memcache suffer from this problem and you should carefully evaluate them before use. Be wary about libraries that don’t explain how their cache tagging works internally. Only backends with second level indexes (Databases, Riak, Mongo) or sophisticated datastructures (Redis) are suitable for implementing efficient cache tagging.

So please remember, before using cache tagging as a quick fix for your cache invalidation problems: Without the right cache backend and a special purpose implementation for tagging you will quickly suffer from bad performance that you wanted to fix with caching in the first place..

There is one way to get it right, without heavy writes and serialization overhead. The Laravel cache implements this approach by storing a unique id for every cache tag and then prefixing the key of items in this tag with this unique id. To invalidate all items in a cache tag you must just regenerate the unique id and all the old cache keys are not accessed anymore. A simple reimplementation in APCu looks like this:

<?php

function apcu_tagged_store(array $tags, $key, $value, $ttl = 0) {
     return apcu_store(apcu_tags($tags, $key), $value, $ttl); 
}

function apcu_tagged_fetch(array $tags, $key, &$success) {
     return apcu_fetch(apcu_tags($tags, $key), $success); 
}

function apcu_tags(array $tags, $key) {
     $ids = [];

    foreach ($tags as $tag) {
         $ids[] = apcu_entry("tag_" . $tag, function ($key) {
             return uniqid('', true);
         });
     }

    $ids[] = $key;

    return implode('|', $ids); }

$article = ['id' => 100, 'category' => 20, 'text' => '...'];

apcu_tagged_store(['articles', 'category_20'], 100, $article); 
$article = apcu_tagged_fetch(['articles', 'category_20'], 100); 

Explaining the apcu_tags function: It generates a unique key for every tag and concatenates them all as a prefix for the actual cache key. Then if you invalidate one of the tags, all the cache entries with this tag get regenerated on the next access.

Introducing Trace Pinning

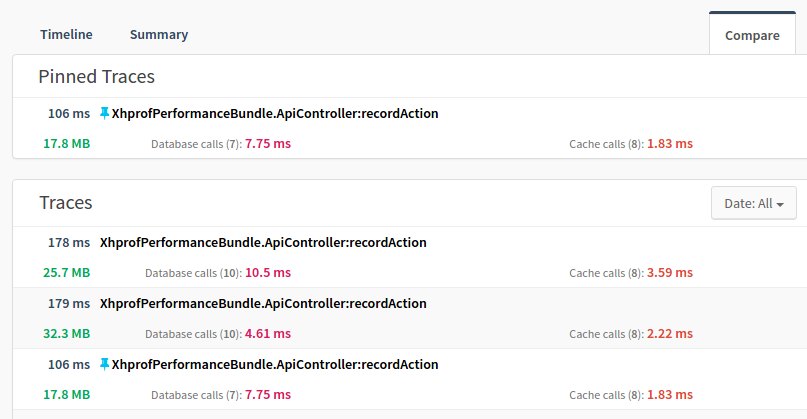
Today we are introducing a new feature called “trace pinning” which allows you to keep traces for future reference. This is a first step to improve the usability of Tideways for longer performance optimization sessions by simplyfing the steps to find traces that you have found interesting before.

A pinned trace is stored for a much longer time, 120 days for the Medium and Large plans and 7 days for the Small plans and is shared between all users in the application. The limit of pinned traces is currently set to a maximum of 50 traces per organization every day.

To pin a trace that you want to keep for reference, you just have to click the “Pin” button on the far right of the menu when looking at it:

Pinned traces are then highlighted in different places of Tideways:

  • When comparing traces you can pick the compare target from all the pinned traces for this transaction first. See the screenshot below for an example.
  • When looking at the transaction details the last pinned trace is always shown first before all the most recently collected ones.
  • When searching for traces you can add a filter to show only pinned traces.

Please let us know how this new feature works for you, at this stage we are open to suggestions for further improvements.

Developing a time-series “database” based on HdrHistogram

Over the last months we have developed, tested and rolled out a new backend for the time-series information that we collect in Tideways. In this blog post I want to explain some of the implementation details and the journey getting here and why we didn’t use one of the many existing time-series databases out there.

The past: Time-Series with Elasticsearch

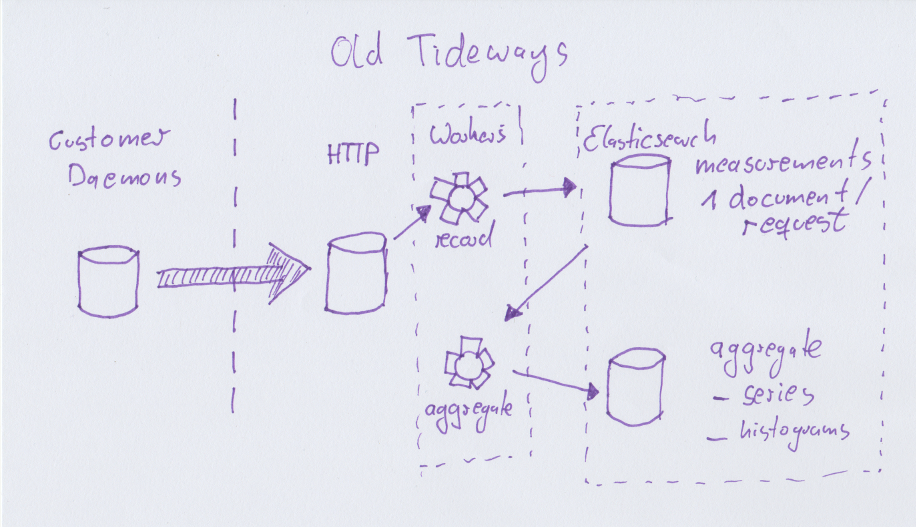
Since the first prototype of Tideways we have used Elasticsearch for storing latency measurements of monitored applications. The decision for Elasticsearch was heavily influenced by ease-of-use over everything else. When building the prototype in 2014, one requirement was that we wanted to calculate percentiles of the latency distribution and skip averages all together, because of their many flaws in performance analysis (topic for another blog post). At the time we already used ES for storing and searching trace data, so we made the naive decision to use it for time series data as well. To counter potential data loss with Elasticsearch we made the decision to keep an event log of all data written and implemented a replay mechanism which safed us from trouble several times.

As a single purpose tool for monitoring latency and profiling, we don’t need to collect thousands of time-series per server every minute, and Elasticsearch works quite well for us on this scale. We did encounter our share of problems and had to learn a lot before efficently operating Elasticsearch as a time-series database, but with a cluster size of never more than 300GB we are far from the “webscale” regions yet but we knew that the current backend implementation wouldn’t get us much further. We also felt some growing pains:

  • Using the percentile aggregations, for some of our customers with 18000 requests per minute, it means about 30 million data points for only one day and performing the calculations took in the range of several seconds, sometimes more than 30 seconds.

  • Storing one document for each request is extremely inefficient, even if Elasticsearch compresses storage effectively. Every day we collect in the range of 500 to 1 billion documents.

  • We can’t store this amount of data for longer than a few days (3 at the moment) so we need expensive aggregation workers that compute aggregations over all endpoints all the time, into different dimensions. If you know a little bit about statistics, once you start aggregating calculating with percentiles is not possible anymore, which forced us to do something very wrong: averaging of percentiles in some places. We also needed to aggregate into multiple different target formats, because our datastructures where naively implemented. Every minute up to 6000 aggregation tasks where performed, causing quite a bit of stress on our backend workers and Elasticsearch cluster.

  • Our daemon on each customers machine already aggregates data into 1 minute intervals, before we deaggregate this again on the backend to allow Elasticsearch to calculate percentiles on it. This felt very inefficient.

  • Due to the massive amount of unaggregated and aggregated data, we are still offering quite a short data-retention period of only up to 14 days. We want to increase this but not at the current data storage efficency.

Looking for a solution using Histogram datatypes

So our next solution needed to be better on several dimensions:

  • Fix the aggregation overhead
  • Avoid the use of wrong math when calculating percentiles
  • Store data more efficiently
  • Decrease query response times even for long periods of more than 24 hours.

So when I came across datatypes for histograms, especially HdrHistogram I know I was up to something. Histograms are the perfect datatype for storing latencies.

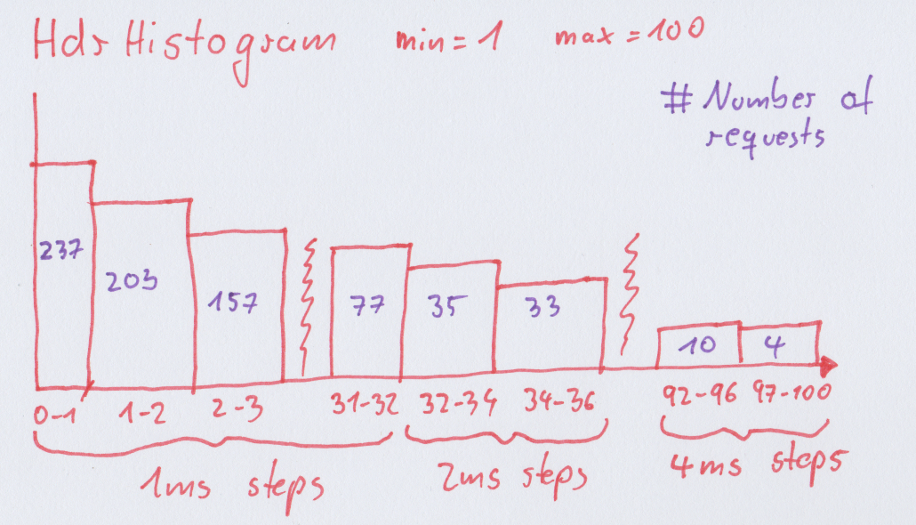
A histogram is an (almost) lossless datatype where we count the number of times a request takes in predefined buckets. For HdrHistogram this works by specifiying a fixed range (1 to 60000ms in our case) and a factor for preciseness that defines small buckets of 1ms steps in the beginning but the larger the range the larger the steps between buckets get.

The benefit of histograms is that you can add many of them together and still compute the exact value of any percentile.

The first step was to find an existing open-source timeseries database that supported storing histograms, but sadly only Prometheus (to my knowledge) does this and its pull metrics model is too different to our current push model that we could easily integrate this in our existing stack without a full rewrite.

Every other time series database stores each measurement individually. Which is completly useless for our latency numbers in pre-aggregated 1 minute intervals. It seems most time-series databases are not primarily written to store latency numbers but instead general purpose time series.

After about a year of contemplation about this problem (remember, we didn’t actually need to improve for scale yet) we decided to implement this ourselves on top of an existing database two months ago.

This was not a decision made lightly, but we figured implementing this for just our special purpose and stored using existing database technology, we would end up with a very small and maintainable codebase to implement this.

Our new timeseries backend

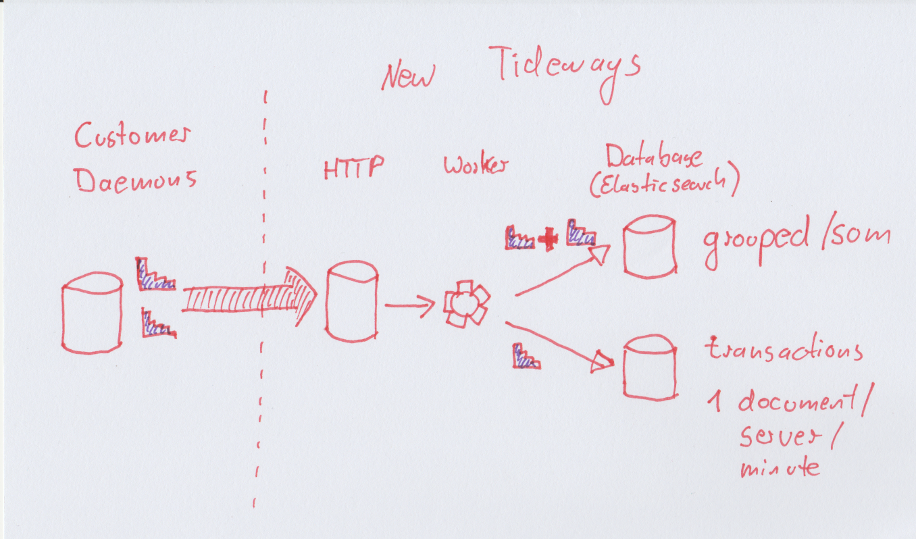
In my head, the ideal solution to combine HdrHistograms and a database looked like this:

  1. The daemon already collects latency data as histogram datatype on the customers servers.
  2. When passed onto our servers we would just store the histograms in a database on our end without having to process the data to make Elasticsearch percentile queries work.
  3. No aggregation workers are necessary anymore, because we already store aggregated data.
  4. As a downside, computations have do be done in code, because no database exist that can do histogram additions directly itself.

For the first prototype we took the C port of HdrHistogram by Michael Barker and wrapped it in a PHP extension since all our backend is in PHP. We then built a second implementation for the service storing and querying our monitoring data and came up with something just short of 600 lines of new code. Our daemon does not aggregate Histograms itself yet, this is a next optimization step for the future.

Our new backend now works this way:

  1. We store one serialized HDR histogram per observed transaction/server/minute. Some small optimizations reduce the required space for histograms with only a few observerations.

  2. For every group of transactions (web, backend, crons, …) we also store one histogram with all requests that is displayed on the main page of the application.

  3. For every server/minute we store a ranking of all transactions by “impact” (Sum of all response times as share of total) that can be added up again over arbitrary periods of time without having to use “wrong math”.

  4. Queries fetch all histograms in the selected date interval (several thousands if necessary) and adds them on the fly.

All this is still done in Elasticsearch, because it is readily available and we could just plugin our pre-existing abstractions to manage retentions, rotating indexes, clusting and everything else we didn’t want to implement ourselves for now. Technically we don’t need ES anymore, but we keep using it for now, because its easier to use something that already exists.

The solution is so small because we are literally standing on the shoulder of giants here and just plugging two different technologies (HdrHistogram and a database) together.

Results

Using a feature flag we were live with the new backend for a small number of test customers with amazing results:

  • We reduced the required storage space to at least 12% of the original amount.

  • We reduced query times for large periods to consistently under one second, no matter how big the customer is. This is a massive improvement over the really bad 30-45 seconds some of our customers had before for periods >1 day. Using a C-based PHP extension for summing up many histograms helps with the performance.

  • Aggregation workers are not necessary anymore, saving up to 6000 worker tasks per minute at the current workload.

  • Customers with high data retention can now still look at data in one minute intervals for their whole available dataset. No aggregation to one hour buckets anymore for everything older than 3 days.

On top of this we can improve some of the existing features by exposing more detailed information.

After a month of testing this in beta customers and ourselves, we are now slowly rolling it out to all customers.

Future

The next step for the backend is looking into optimizing storage even more. For example we could aggregate histograms into one per transaction/minute if there are more then one server. This could potentially save a lot of data for customers with lots of servers, which are usually the ones sending way more data anyways.

Another thing we want to look into is making the backend more available than Elasticsearch is by default. We will probably try this by using a different underlying database first or even implementing our own special purpose database. We only use Elasticsearch as dumb storage right now, so it should be easy to switch to MySQL/PostgreSQL or any NoSQL database that allows range queries. Building something our own is out of the question.

Ideally at some point we want to extract the code base into a small microservice, since its now entagled into our monolithic backend service.

Of course, I hope to inspire others reading this to jump into building an open source version or integrating HdrHistograms in one of the existing time-series databases 🙂

Adding CakePHP Support for CakeFest

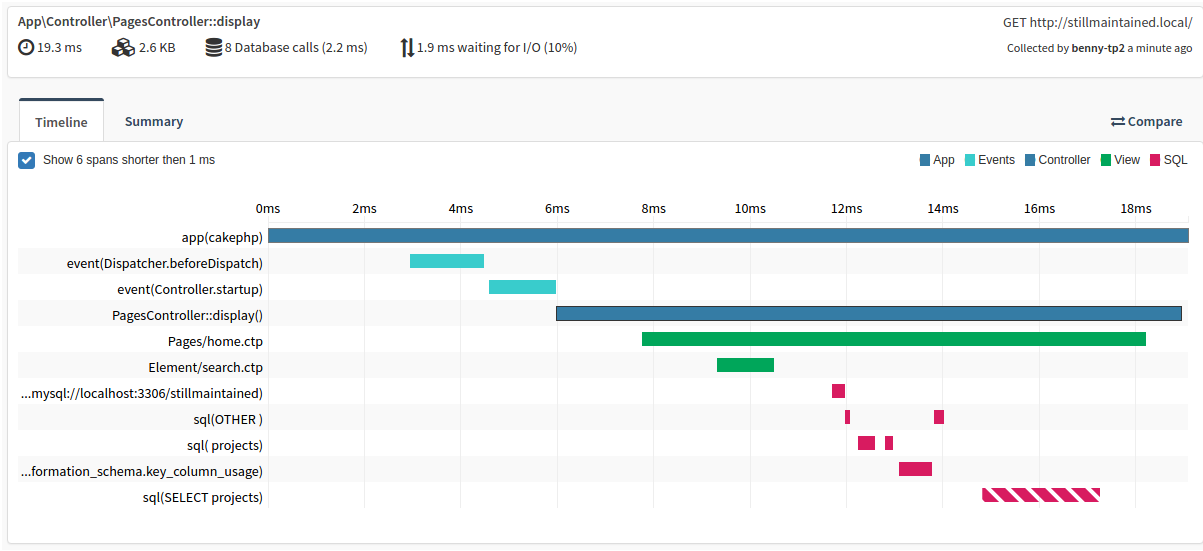
For this years CakeFest in Amsterdam we have finally finished native support for both CakePHP 2 and 3 in Tideways. First, we have added automatic transaction/endpoint detection based on Controller and Actions as you can see in this screenshot where we are viewing a trace for AppControllerPagesController::display of the open source project stillmaintained.

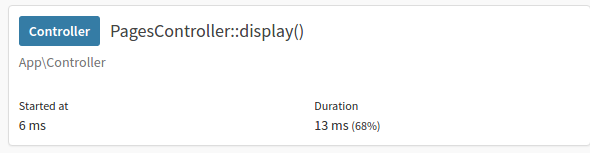
Furthermore Tideways automatically detects a span with the duration of each controller:

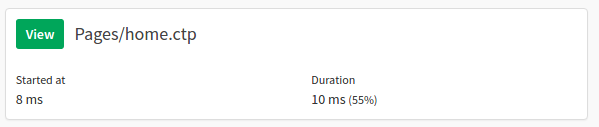
And it detects the duration of how long a CakePHP Template was rendered:

Finally, dispatched events happing inside CakePHP applications are detected and rendered into the timeline similar to event support for many other frameworks. You can see an example with Dispatcher.beforeDispatch and Controller.startup in the timeline above .

With support for PDO, MySQL(i) and PgSQL already baked into Tideways you now get a comprehensive view of how your CakePHP based applications are performing.

If you want to test CakePHP support drop us a note at [email protected] and we give you access to the beta version (v4.0.5) of the PHP extension. If you can wait a bit, the stable version will be released next week.

PHP Session Garbage Collection: The unknown performance bottleneck

Here is one performance setting in your PHP configuration you probably haven’t thought about much before: How often does PHP perform random garbage collection of outdated session data in your application? Did you know that because of the shared nothing architecture PHP randomly cleans old session data whenever session_start() is called? An operation that is not necessarily cheap.

By default this happens every 100th request, because of the following php.ini variables settings session.gc_probability=1 and session.gc_divisor=100. But you can not just look at the defaults of these settings in your application to see what is going on. Some distributions change the cleanup mechanism, for example Debian/Ubuntu flavored PHP versions set session.gc_probability=0 and use a cronjob to cleanup old session data. However, frameworks then usually overwrite everything anyways and force a reset of the INI settings themselves (Symfony) or implement their own session entirely (Laravel).

My general advice is to avoid PHPs random garbage collection altogether and offload the cleanup to either background jobs or the system used for storage. Be careful about this “general advice”, the implementation highly depends on the individual storage system and type of session save handler.

Example: Laravel Framework

Let’s look at the Laravel framework as an example, where I find a lot of performance advice is about changing the session driver. By default file based sessions are used in Laravel with a configured garbage collection ratio of every 50th request.

When Laravel triggers Session garbage collection the following code is called for the file-based session:

public function gc($lifetime) {
     $files = Finder::create()
                 ->in($this->path)
                 ->files()
                 ->ignoreDotFiles(true)
                 ->date('<= now - '.$lifetime.' seconds');
     foreach ($files as $file) {
         $this->files->delete($file->getRealPath());
     } 
} 

If you know a little about Symfony Finder component, then you know that it is comparatively slow operation instead of directly using Linux commands such as the special purpose bash script sessionclean that Debian/Ubuntu ship with.

The problem: With more active users and therefore more active sessions in your application session cleanup gets slower because it has to iterate over more files. And when you have this much traffic on your application, then cleaning every 50th request can happen multiple times every second. If you are measuring performance using percentiles (which you should), then the 99% percentile will always negatively affected by one or two requests that cleaned up the session.

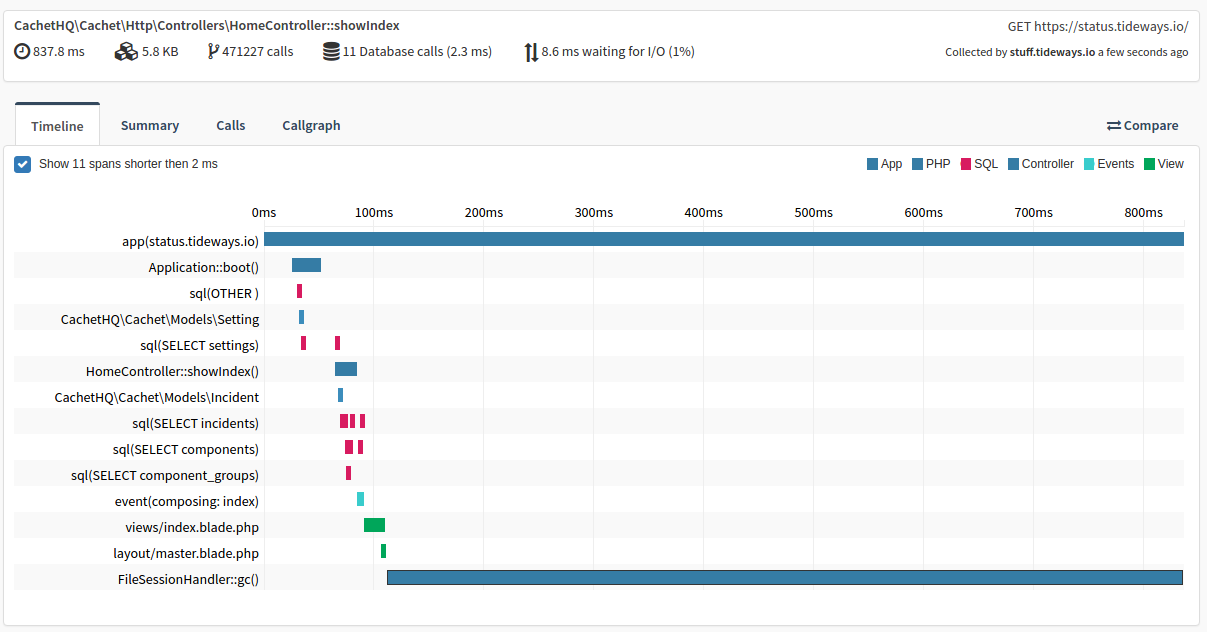
Take a look at this Tideways trace of our own status page (provided by Cachet) where the Laravel Garbage Collection is triggered to cleanup a folder of 10.000 file-based sessions:

As you can see this takes the majority of the whole request (a whooping 723ms of 837ms, 87%!). Even if you have less active session, this is still very high performance penalty given it happens every 50th request.

Offload Session Garbage Collection

Instead of slowing down a random sample of your users requests with session garbage collection, you should offload this to a cronjob that is called a single time in regular intervals.

For Laravel this means changing the lottery configuration in config/session.php to:

<?php

return [     // ...     'lottery' => [0, 100], ]; 

You then need a cronjob that calls ./artisan session:gc with the following command code:

<?php // app/Console/Commands/SessionGcCommand.php

namespace AppConsoleCommands;

use IlluminateConsoleCommand; use IlluminateSupportArr;

class SessionGcCommand extends Command 
{
    protected $signature = 'session:gc';

    public function handle()
     {
         $session = $this->getLaravel()->make('session');
         $lifetime = Arr::get($session->getSessionConfig(), 'lifetime') * 60;
         $session->getHandler()->gc($lifetime);
     } 
} 

Don’t forget to register this in app/Console/Kernel.php.

If you absolutely have to use PHP based cleanup, then adjust the probability based on your applications traffic to be triggered every 5-10 minutes by increasing the second number of the lottery. For example if you serve 1000 requests per minute, then the right setting could be 1 out of 1000 requests.

<?php

return [     // ...     'lottery' => [1, 1000], ]; 

The same logic applies to Symfony, where the native session is configured to cleanup every 100th request by default. You can disable random cleanup during PHP requests with the Native session handler by setting the following configuration:

framework:     session:         gc_probability: 0         gc_divisor: 100 

The Symfony garbage collection command to be called with ./app/console session:gc from a cronjob would look like this:

<?php

namespace AppBundleCommand;

use SymfonyComponentConsoleInputInputInterface; 
use SymfonyComponentConsoleOutputOutputInterface; 
use SymfonyBundleFrameworkBundleCommandContainerAwareCommand;

class SessionGcCommand extends ContainerAwareCommand {
     protected function configure()
     {
         $this->setName('session:gc');
     }

    protected function execute(InputInterface $input, OutputInterface $output)
     {
         $session = $this->getContainer()->get('session');
         $session->start();

        $storage = $this->getContainer()->get('session.storage');
         // if you configure "framework.sessions.gc_maxlifetime" it will set the ini var
         $storage->getSaveHandler()->gc(ini_get('session.gc_maxlifetime'));
     } 
} 

What about non file-based session storages?

If you store sessions in the database, then you still need the cleanup via cronjob as described in the previous section. The session tables in Laravel and Symfony, and probably in every other framework contain some form of lifetime timestamp that can be used to delete old sessions.

For cache based session handlers based on Memcache or Redis you can rely on the cache time-to-live (TTL) instead, which makes explicit garbage collection obsolte. Symfony and Laravels implementations of these caches have a no-op garbage collection method, calling it will do nothing.

This is the reason why even with a session.gc_probability set to a high value, the cache based drivers never cause any performance overhead in PHP requests and users might be mislead by this when performing benchmarks of different session configurations.

Conclusion

Take some time to learn about your frameworks approach to session garbage collection and if you don’t use a framework, see the PHP documentation on how native session GC works.

New: Profiling PrestaShop performance

We have included PrestaShop 1.6 and 1.7 support in the last release of the Tideways PHP extension. If you are using Tideways with your e-commerce site based on PrestaShop, then you now get better insights for monitoring and profiling data. No changes to your code-base are necessary to get started.

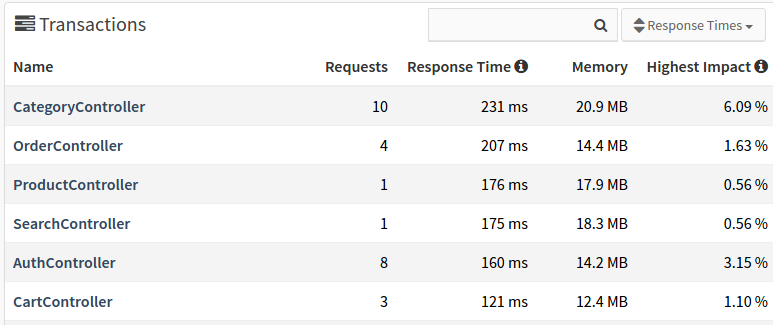
The PHP extension now automatically detects the name of transactions based on PrestaShop controller names, as you can see in this screenshot of our Presta demo shop:

You need to set the framework configuration in Tideways to PrestaShop (php.ini Example):

tideways.framework=presta16 

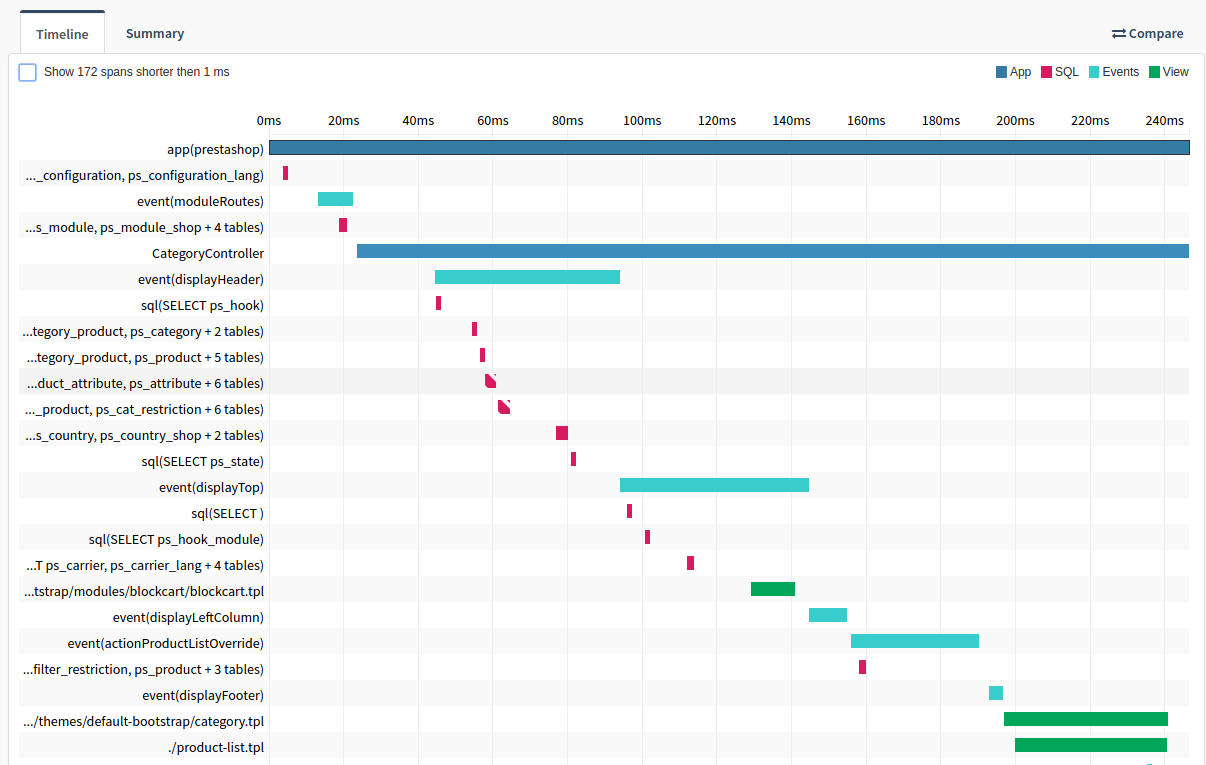
Additionally, we now detect PrestaShop events (HookCore::exec) and controllers in a timeline trace. See the dark blue CategoryController span or the light blue displayHeader event span in this screenshot to get a feeling how it works:

Support for tracing PDO with MySQL and Smarty was already in Tideways before and you can make use of them, when optimizing the performance of your PrestaShop.

P.S. Start a 30 day trial of Tideways to test PrestaShop support.

Introducing Teams and Synchronization of Members from Github

We are introducing “Teams” today, a new feature to improve access controls for your Tideways organization, after several weeks of testing with selected customers.

With Teams you can grant more fine-grained access to your applications, based on team membership of your users. Additionally this feature allows you to automatically synchronize teams and member accounts from your existing Github organizations and save a lot of work on user maintenance.

Until now Tideways had a very simple access control system that allowed admins to invite as many members as they want into their organizations and those members are able to see all applications. For big organizations this is usually not good enough and the manual invitation process is very time consuming and requires care when persons leave the organization.

The team feature is available for organizations with Medium plans (20M+). For our Tideways On-Premise solution, this feature will allow you to synchronize teams from LDAP. The Teams feature is entirely optional and you can still use the simple ACL model from before if you don’t need this much control.

Please see the documentation for more information about how to use it.

Improved Error and Exception Tracking

In the last weeks we rolled out several new features for Error and Exception Tracking in Tideways that we have been missing ourselves in the day to day work.

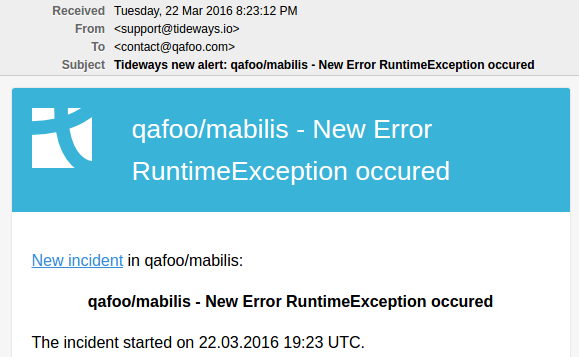
Tideways can now trigger alerts for you when a new type of Exception or Error occured in your application. This is extremely helpful to be up to date with new sources of problems surfacing in your application. Configure these alerts to notify you on Slack, OpsGenie, HipChat, IRC, Flowdock or the classic choice with E-Mail notifications, like this example:

New Exception E-Mail ExampleNew Exception E-Mail Example

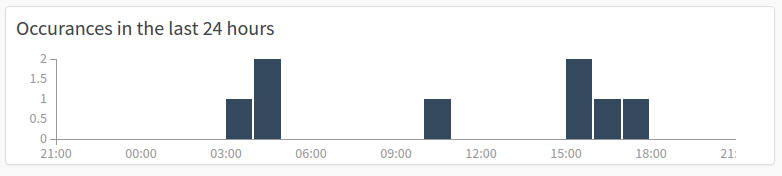
For errors that you do need to investigate further we have added new features as well. First, you will now see a chart of the occurances of this error in the last 24 hours. This can help you find out how frequently the error is happening.

Error Occurances ChartError Occurances Chart

Another new feature Context information about errors, a list of additional information available for debugging the problem. You can pass this information to Tideways from your application using the customization APIs. An example for useful context information are the URL, user id, current users items in a shopping basket, users activated feature flags or A/B testing groups.

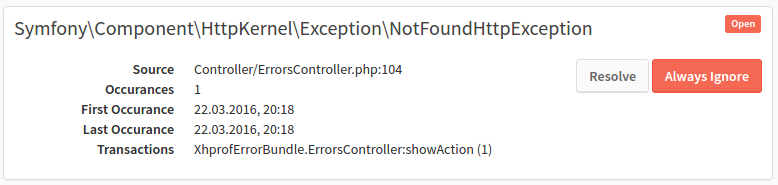
Sometimes Exceptions in your application are not exceptional, but just regular error conditions that don’t require further investigation. One such example is Symfony’s NotFoundHttpException which just indicates a 404. You can now ignore exception classes application-wide, when you think they don’t want to see them anymore.

To ignore an exception click “Not Error” first, then wait and click again when the button turns red and shows “Always Ignore”.

Always Ignore ExceptionAlways Ignore Exception

Once an exception is ignored it will never appear again in the list of errors, won’t trigger alerts when it re-occurs and doesn’t count towards the global application or transaction error rates.

At last, we have fixed a bug that could lead to stacktraces not being reported in exceptions and errors. You need the daemon in the latest version (v1.3.7) to see stacktraces again.

Looking for Heroku Addon testers

Are you a Heroku PHP user? Then this news will interest you: We are looking for alpha testers of the Tideways addon currently undergoing the process of becoming an official Heroku addon.

You haven’t heard of Tideways yet? Tideways combines Performance Monitoring, Profiling and Exception Tracking in one powerful tool, observing every aspect of your PHP application. See Features for more information. The Tideways addon is available for PHP 5.5, 5.6 and 7.0

As a potential participant you have a Heroku account and a testing/staging application to run Tideways on and you are using the official PHP buildpack with latest version 93 that was released this week.

Sign me up for Heroku Addon Alpha

Along with your signup request to [email protected], please send a short description which applications you want to participate with and the email address of your Heroku account so that we can activate the alpha addon for you. During the Heroku addon alpha and beta phase you can test the Tideways addon for free.

Flowdock integration is now available

Integration with Flowdock is now available in Tideways. If you are using Flowdock for chat ops in your business you can now send alerts for performance regressions and increased error rates to a Flowdock Stream. This allows you to have a discussion and response handling for every incident.

We are offering some context information for every incident directly in Flowdock and you can directly jump to the Tideways view of an incident by using the context menu inside Flowdock.

For more information about the Flowdock integration see the corresponding Guide.

PHP 7 Release of Tideways

We are happy to finally release the first PHP 7 compatible version of Tideways after several months of beta testing with customers and open-source users. A new version of the extension has been released with the major version 4.0.3 that works on Linux for now. We are still working on publishing releases for Mac and Windows platforms in the next days. You can find binary downloads as Tarball, Debian, RedHat and Homebrew packages or the source code in the master branch of our repository on Github.

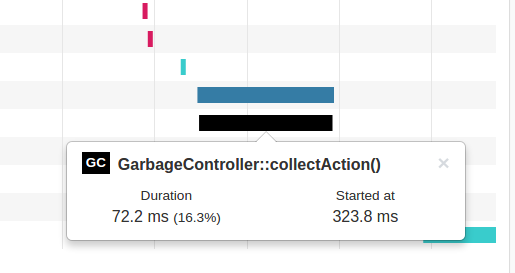
On top of the work we did porting the extension for PHP 7, there is also a new feature that we could implement, based on the Turn gc_collect_cycles into function pointer RFC that I have successfully proposed into PHP 7 together with Adam Harvey. Our Timeline Profiler now shows timespans for Garbage Collection and the function context they occur in, like the black span in this timeline trace:

The Tideways extension also serves as a replacement for XHProf callgraph profiling and has a compatible API and output format, you can use this extension outside our product to profile your PHP 7 applications with one of the many open-source UIs.

With this release, we are happy to finally support you monitoring, tracing and profiling your PHP 7 applications and are looking forward to users putting this into production. Happy tracing!

OpsGenie integration now available

We are thrilled to announce that our OpsGenie integration is now officially available for everyone to use. Tideways can now send Response Time Regression and Error/Exception alerts to OpsGenie and you can benefit from routing alerts through their service to avoid alert fatigue.

OpsGenie allows you to define on-call-schedules and escalation policies so that only the right persons are notified of ongoing problems. Notifications are sent through an iOS or Android mobile app, SMS or phone calls with increasing urgency. As a result, OpsGenie successfully reduces alert fatigue and inbox-spamming of alert emails.

To get the integration running, OpsGenie has published a documentation how to integrate with Tideways and we have provided a similar document with information.

As a happy OpsGenie customer ourselves it feels especially great to see this integration in use every day.

Tideways Windows Beta and PHP 7 Update

zomg! Tideways for Windows is in Beta. We didn’t expect this to happen ourselves, so imagine our suprise when all tests just passed and that DLL fell out of the build process after just one day of tinkering.

While we had a persistent number of questions for Windows support over the last year, but with nobody on the team using Windows the effort of full integration into our deployment process seemed far away.

Using the amazing AppVeyor Continuous Integration service, adding Windows support proved to be a piece of cake. The code required only some small adjustments to compile on Windows, so that most of the work was focussed on the actual build scripts and process on AppVeyor.

The Windows support is far from stable yet, but we are looking forward to gathering feedback from you about the functionality as a XHProf replacement or using Tideways Profiler. If you are interested in beta testing Tideways on Windows please drop a mail to [email protected] to get access to the binary and setup instructions.

New PHP 7 Beta for Linux

More work happened on the PHP 7 version of Tideways, including some critical bugfixes and Debian and RPM packages.

We are extremely happy now to compile both the PHP 5 and 7 extensions from the same codebase, which frees up a significant amount of our development resources as a result. Prepare to see an increase in new features, improvements and other surprises after the PHP 7 extension is stabilized in the next days and weeks.

You can directly download the Tarball, DEB or RPM packages with Version 4.0.1 Beta2 of Tideways. If you are running into trouble or bugs please send an email to [email protected].

Tideways and Xhprof on PHP 7: Beta Testers Wanted

This Thursday the long awaited stable PHP 7 version will be released and it’s hard to hide our excitement about this important day in PHP history. For us the most important change is the performance increase and we have written about two- to threefold improvements across different kinds of applications before.

In August I watched PHPs creator Rasmus Lerdorf at the Free- and Open-Source Conference mentioning just how impressive this PHP 7 achievement is: A completely rewritten engine at the core and yet almost no breaking changes that affect PHP developers.

Just hours away from the release, it shouldn’t suprise you, that we have been working on a Tideways extension with PHP 7 compatibility over the last four months.

We are now ready for additional feedback and release a beta version of the Tideways extension for PHP 7. You can help us test the extension on PHP 7

  • if you are a Tideways customer or trial user
  • if you are in need of a PHP 7 compatible XHProf replacement.

To get started either compile the extension yourself from the Git Repository using the “php7-only” branch or send us an e-mail to get access to Tarball, Debian or RPMs packages with pre-compiled binaries and installers.

All tests for the extension are passing. Until we can release a productive release we are still trying to compile the extension for both PHP 5 and PHP 7 using the same code basis. Due to the severe changes in the core of Zend Engine this is a tough problem.

If you find bugs please open an issue on the Extension’s issue tracker and we will be working to fix them.

Profiling SQL, MongoDB and more

We are excited to announce a new version of Tideways PHP extension. The release is available to all our users since last Friday.

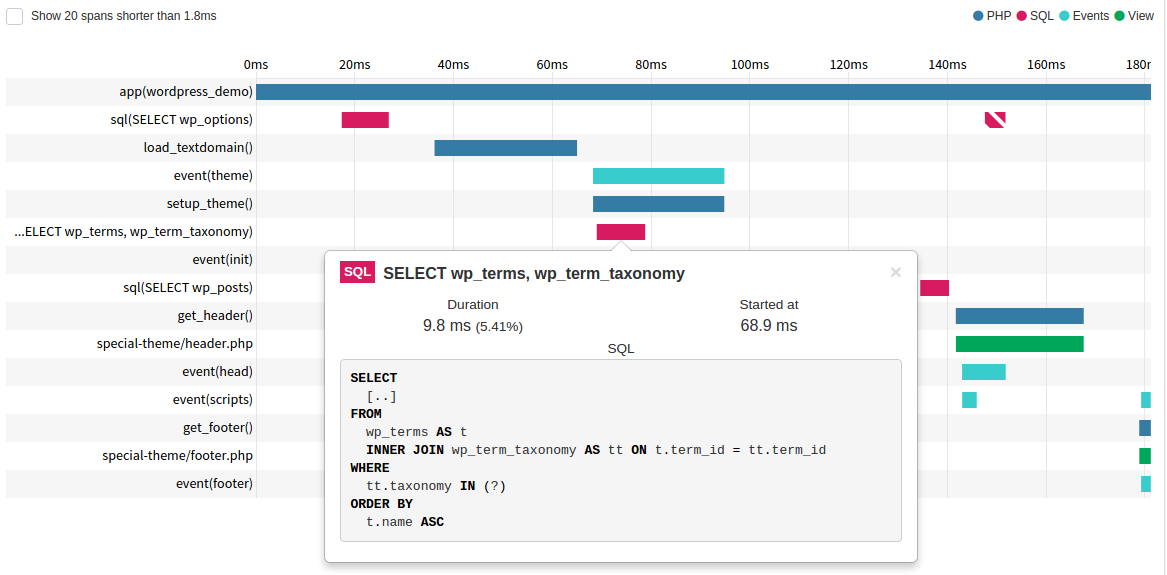
With detailed SQL query profiling it contains one of the most wanted features. A timeline trace now shows anonymized queries when you hover over a pink SQL span:

This WordPress example request with a query on tables wp_terms and wp_taxonomy shows why the timeline traces are so valuable. They allow first class support for calls to databases, webservices and other external services mixed with PHP profiling insights.

About the implementation: The profiler extension sends all queries to your local daemon, where they get anonymized and then sent to our servers: Any potentially private data inside the queries never leaves your servers. Furthermore you have to activate the detailed analysis explicitly, giving you full control over how much details you want to send to us.

We are super happy this feature finally shipped, after a very long design, feasibility and testing phase. When we started out with Tideways last year, we were sure that SQL query profiling will be high in demand. Our first customer requested this feature in June 2014 and in the last weeks we had an increasing amount of conversations with users where you asked about SQL query profiling.

You can sign up for our demos to see SQL support at work.

N+1 Bottleneck Detection

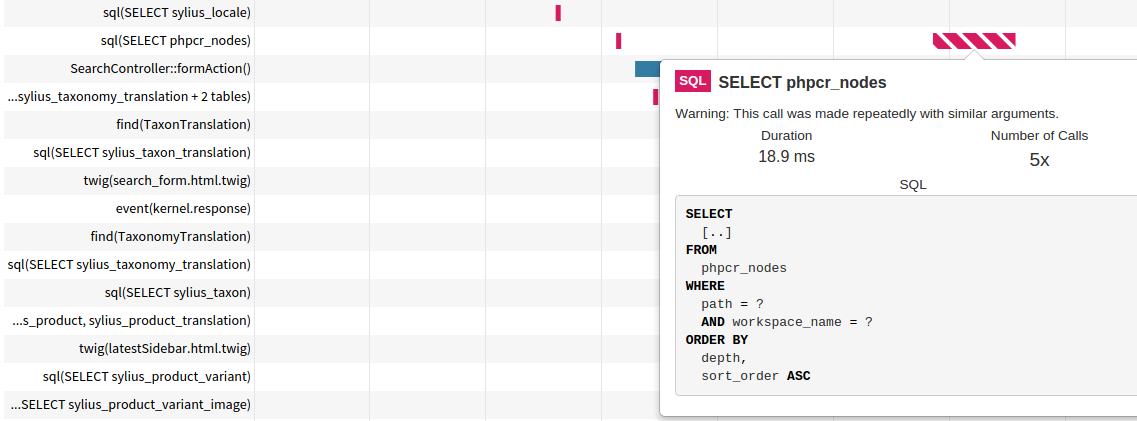
On top of the SQL queries support we are now able to detect queries that are called repeatedly right after each other with different parameters. When this occurs there is often a huge performance drain. The solution is to refactor the code to only execute one query instead. We show this directly in the timeline by highlighting the affected span and showing details in the hover:

N+1 detection is performed on SQL queries and HTTP calls at the moment.

MongoDB Support

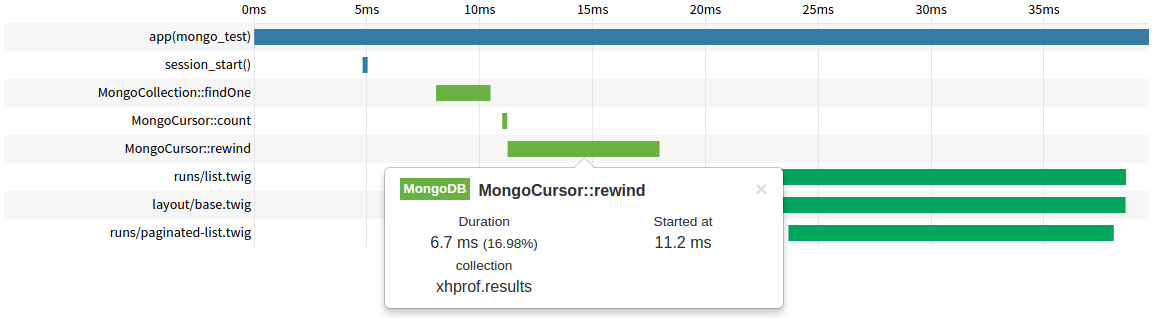
Next, we have included support for the Mongo PHP extension. Several of our customers have only used the custom instrumentation API for this and we are grateful to have worked with them together to bring Mongo support to core.

In this first version we display the operation and the collection it was performed on. The next Tideways version adds support for the new PHP driver that was released last week.

Magento Framework support

Magento is now on the list of supported PHP frameworks and applications. We are very happy about the amazing help from Daniel Fahlke and from Maxcluster. Their research will allow us to improve Magento support even further in the next versions.

To use Magento support just configure Tideways framework setting to specify:

tideways.framework=magento 

Predis, Pheanstalk and PhpAmqLib Support

Last but not least, there is now support for libraries that a number of our customers and we ourselves use:

  • Redis support when you use Predis PHP library
  • BeanstalkD Queue support when you use Pheanstalk library
  • RabbitMQ support when you use PhpAmqLib

As usual we will be adding more libraries in each version, depending on demand and our own roadmap.

Upgrading

We provide a documentation page with detailed notes about upgrading your version of Tideways to the current versions of PHP extension 3.0.3 and daemon 1.3.1.

As usual if you have questions or need help, please send an email to [email protected].

Profiling Overhead and PHP 7

In this blog post we will discuss the overhead of Profilers and how their results are biased, which can ultimately affect optimization decisions of programmers. The following simple program will help us understand the problem:

<?php 
function array_string_length(array $strings) {
    $len = 0;
    foreach ($strings as $string) {
        $len += strlen($string);
    }
    return $len;
}

This program contains a tight loop that executes the same function strlen over and over again. For an array with 100 elements, strlen is called 100 times.

A profiler for this PHP program will hook into the Zend Engine to get notified of every userland and internal function, here array_string_length and strlen. When writing a profiler you can use the zend_execute and zend_execute_internal callbacks in your PHP C extension to achieve this.

Usually the Profiler itself requires a constant amount of time to profile each PHP function. If a fast function such as strlen is now called thousands of times in a rapid succesion, then the profiling overhead of this function call will put a much higher weight on this particular function call, compared to a slow function that performs I/O and is only a small number of times.

You can ignore this problem when the profiling overhead of a Profiler is extremely small. But that is not the case with callgraph profilers in PHP, they can cause significant overhead.

Now if all your function calls get 2-5 times faster due to an upgrade to PHP 7, then the profiling overhead is still the same in absolute numbers. But relative to the full request, profiling is now responsible for a much bigger share of the response time, as you can see in the following picture:
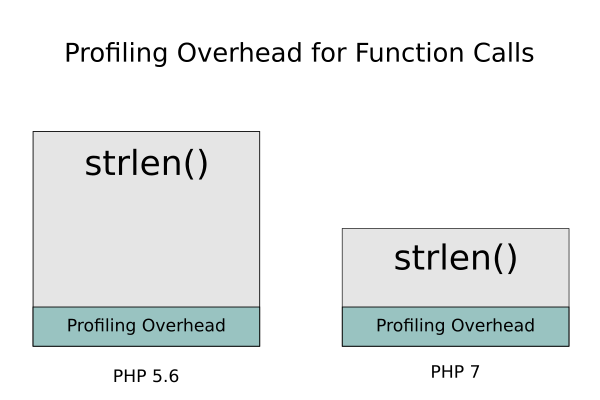
Profilers overemphasize frequently called functions

What does this mean for us as developers? Because fast, frequently called functions get overemphasized due to the profiling overhead, we must be careful when interpreting the results. The performance of the program changes because it is being profiled.

If your profiler suggests standard functions such as strlen, substr, in_array are slow then you should always look at how often this function is called. If the number is very high and you can reduce the amount of calls, then a comparison of old and new traces always overestimates the gain, it will be much smaller when the Profiler is deactivated.

Profilers with a high overhead will push you into the direction of micro-optimizations through this bias. I don’t recommend micro-optimizating code, but when you are micro-optimizing with a Profiler this bias could even drive you towards changes that will actually make the code slower.

Attempting to measure the profiling overhead

We cannot easily measure the overhead of a single function call being profiled, so instead we run a benchmark against WordPress while the Profiler is activated to find out the overall overhead. We can then see how throughput and response times are affected by the activation and measure the slowdown as the approximate profiling overhead.

We have used Facebook OSS-Performance repository by the HHVM team as a starting point. It is an excellently designed tool and makes sure benchmarks are correctly setup and repeatable. We test PHP 5.6 and 7 using no Profiler, XHProf or Tideways extensions. You can find the raw numbers in this Gist, but in this post we are interested in the relative comparison.
The first table shows the oss-performance benchmark against WordPress on PHP 5.6 with 200 concurrent requests, configured with a 10% or 100% sampling rate (Profiler activated every n% requests). We use no profiler as baseline and compute the profiling overhead as percentage loss in performance from the baseline.

Disclaimer: The test pushes PHP to its limit and utilizes all cores at the maximum, for actual applications the overhead is smaller, because they usually run on under-utlized CPUs. The overhead also changes based on the code itself, this is just representive of WordPress.

Profiler Requests Average Response 90% Percentile 95% Percentile 99% Percentile
No Profiler 0.00% 0.00% 0.00% 0.00% 0.00%
Tideways Timeline 10% 5.61% 4.93% 7.56% 12.04% 3.00%
Tideways XHProf 10% 14.70% 13.41% 17.34% 26.21% 14.81%
XHProf 10% 14.52% 13.50% 12.80% 26.99% 18.41%
Tideways Timeline 100% 24.88% 22.93% 24.19% 27.17% 25.65%
Tideways XHProf 100% 42.79% 39.28% 44.13% 47.04% 40.70%
XHProf 100% 46.00% 42.22% 52.43% 54.00% 48.81%
XHProf CPU+Memory 100% 62.73% 57.46% 62.65% 69.36% 67.55%
Xdebug (*) 42.88% 39.42% 44.42% 49.22% 40.61%

You can see, timeline tracing is at least two times faster than the classic hierachical Xhprof based profiling in every category. That is because we only instrument a small number of functions using a whitelist. As a consequence, the profiling overhead is much smaller.

Our fork “Tideways Xhprof” using modern linux timing APIs is a bit faster than the original Xhprof, which uses timing APIs from 2008 when the extension was first developed. Both hierachical profilers cause a significant overhead though and when enabling both CPU and Memory profiling it gets even worse.

You can reduce the problem by reducing the sampling rate to even lower numbers such as 1%, but this comes at the high cost of loosing insights into your application, especially on pages that are not visited frequently.

Since Xdebug is not a production profiler and you should never activate it on production, we have only measured the overhead of enabling the extension. This already makes your application as slow as profiling all requests with Tideways XHProf fork.

Profiling with PHP 7

Lets take a look at the same results using PHP 7 instead of 5.6. We use the Tideways PHP 7 Beta, but there exists no XHProf for PHP 7 yet.

Profiler Requests Average Response 90% Percentile 95% Percentile 99% Percentile
No Profiler 0.00% 0.00% 0.00% 0.00% 0.00%
Tideways Timeline 10% 17.61% 17.11% 18.67% 19.85% 28.27%
Tideways XHProf 10% 24.47% 23.86% 28.41% 35.81% 47.04%
Tideways Timeline 100% 33.82% 32.86% 36.44% 35.99% 35.73%
Tideways XHProf 100% 61.34% 59.42% 61.25% 61.30% 61.34%
Tideways XHProf Cpu+Memory 100% 77.29% 75.16% 77.94% 77.93% 77.97%
PHP 5.6 No Profiler 65.03% 63.12% 63.12% 62.50% 68.62%
Xdebug (*) 63.65% 61.81% 63.36% 62.68% 61.98%

WordPress is almost 3 times faster on PHP 7 than on 5.6 and we can see how the profiling overhead is much larger, because the Profiler itself did not get 3 times faster.

Where XHProf was actually a pretty reliable Profiler for PHP 5, because it was very fast, we have to be much more careful trusting its results when used with PHP 7. In fact, XHProf hierarchical is actually reducing the performance of a PHP 7 request to the level of PHP 5.6.

The Timeline Profiler is much faster, but even at the 10% sampling rate level its overhead is slightly too high. We are planning several improvements in the coming months to get this overhead to below 10% again for PHP 7.

In PHP 7 Xdebug still has a higher overhead than XHProf due to its different nature being a development profiler.

Conclusion

With PHP 7 we have to be more careful to interpret results from callgraph Profilers such as XHProf and their various forks. Unless your PHP code is an obvious bottleneck and uses very inefficient algorithms, micro-optimizations are becoming less relevant with PHP 7.

Where in PHP 5, it was often the case that PHP code in a request was slower than all the I/O combined, with PHP 7 it will more important to improve I/O and macro-performance again.

(*) Xdebug was just enabled as a zend extension for this test to provide a lower bound of its overhead. The actual overhead when using the Xdebug Profiler for a single request is higher. That also means that you have to be very careful with the profiling overhead bias.