Posts

New Feature: Support for GraphQL Queries in Timeline Profiler

We have just released the PHP Extension version 5.0.62 which includes a new feature, instrumentation for GraphQL queries made using the webonyx/graphql-php package, the most widespread GraphQL server package for PHP, for example by Magento 2.

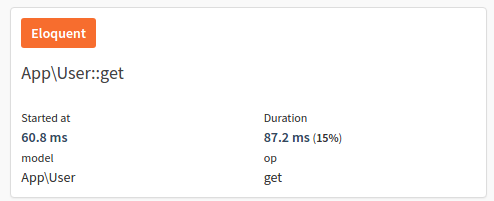
The following screenshot shows how GraphQL spans are rendered in the Tidways Timeline Profiler, here using a Magento 2 GraphQL endpoint responding to a query for the cart:

GraphQL queries are parsed and anonymized in the tideways-daemon running on your machines in a similar way to how SQL queries are anonymized.

Each resolver has its own sub-span under the GraphQL query, so that you can see what part of the query took how long. This allows you to see exactly what SQL and Redis calls are made in resolvers due to the GraphQL query and can help pinpointing performance problems in certain GraphQL queries.

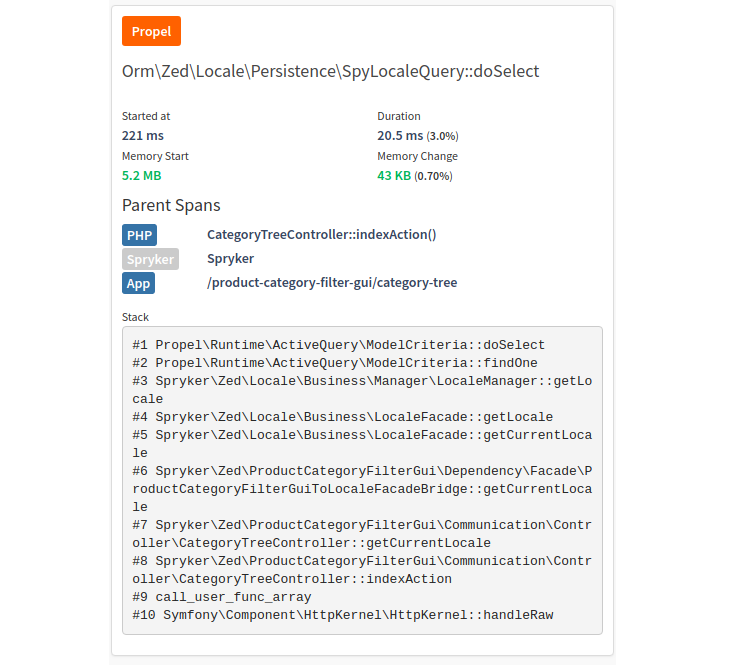
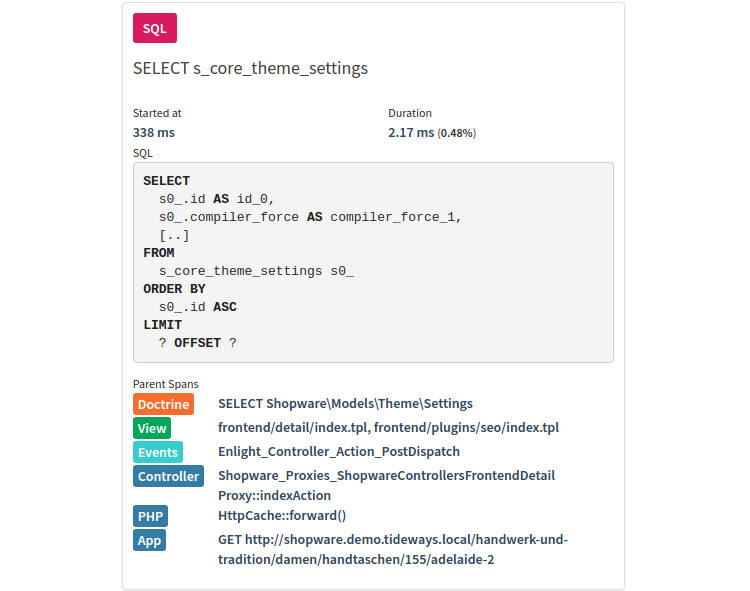
For this SQL query we can see the list of parent spans containing the “Cart” resolver inside the “Cart” GraphQL query.

Check out the 5.0.62 release (changelog), which contains a few other improvements to Magento 2 instrumentation that greatly increase the monitoring and profiling insights into this e-commerce platform.

New Feature: Max Memory Monitoring

The PHP INI setting memory_limit is important to configure right for two reasons:

  • Set too low and an increasing number of requests fail due to memory limit reached errors.
  • Set too high reduces the theoretical number of PHP processes that can run on a single server.

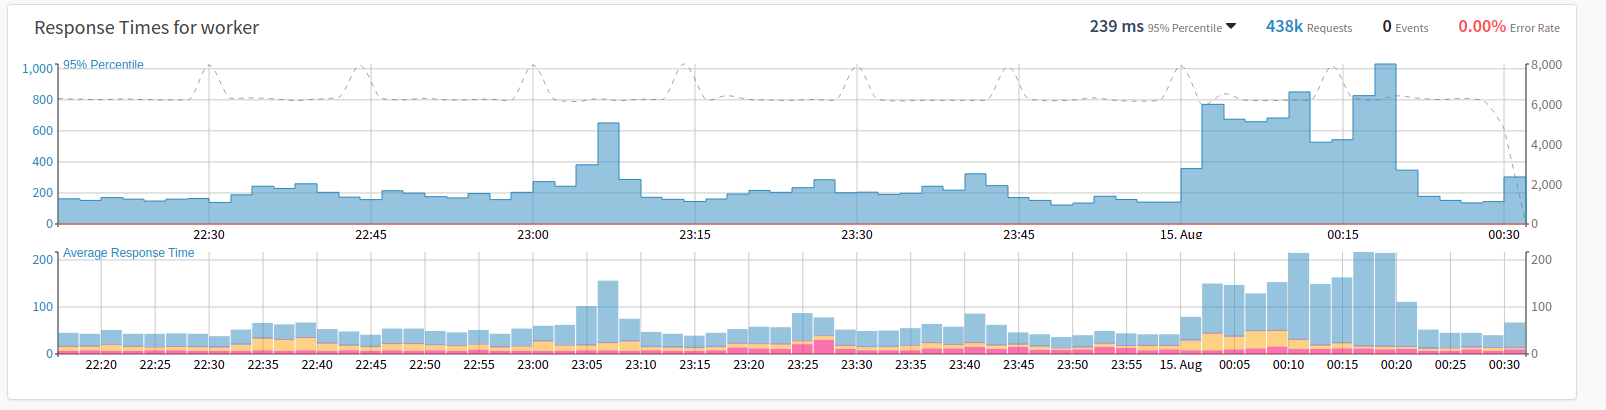
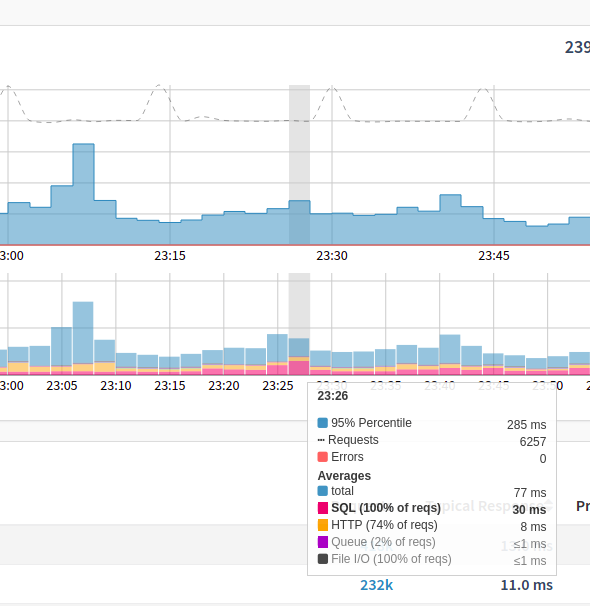
To help you finding the right memory_limit setting Tideways now offers two additional ways to see the maximum memory in use:

  1. on the service level for the currently selected time period
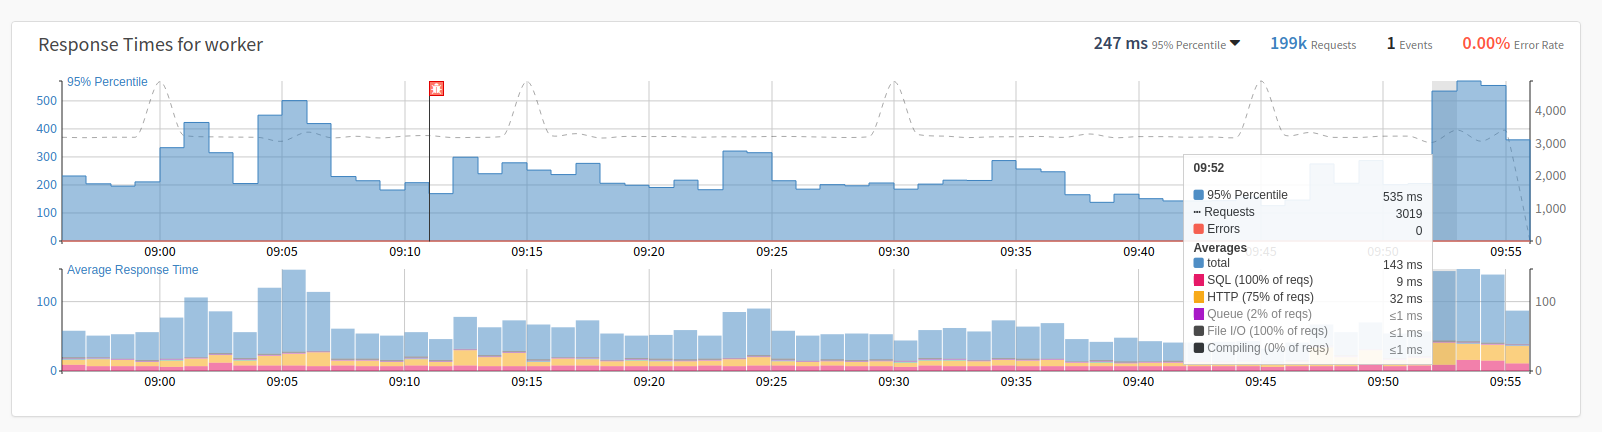
  2. for every bucket in the performance graph, visible via the tooltip when hovering.

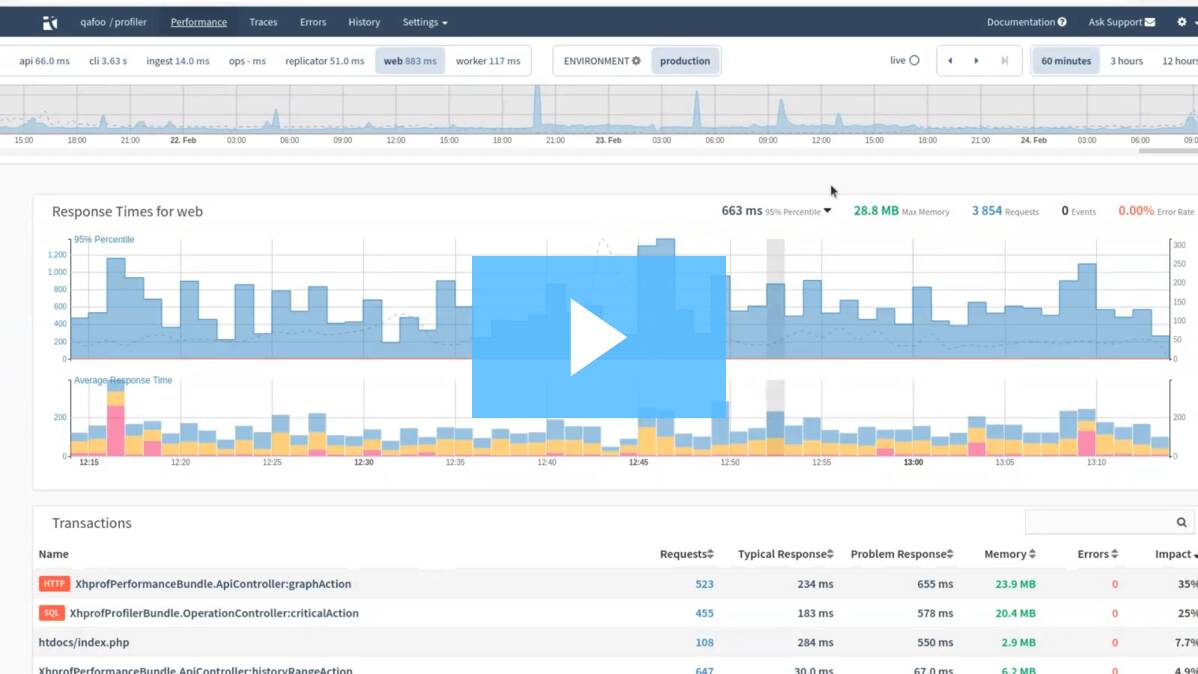
I have recorded a short three minute video demonstrating this feature:

Max Memory Monitoring If you want to know more, setting the right memory limit was also a topic Matt and I interviewed our guest Arne Blankerts about in episode 8 of the Undercover ElePHPant podcast about PHP-FPM tuning and we wrote a blog post on PHP-FPM tuning with more details.

An Introduction to PHP-FPM Tuning

BONUS: We have discussed this topic with an expert in the PHP community in our podcast:

PHP-FPM (or Fast Process Manager) offers several advantages over mod_php, with two of the most notable being that it is more flexible to configure and currently the preferred mode of running PHP by many in the community. However, if you’re using your package manager’s default configuration settings, then you’re likely not getting the most out of it.

In this post, I’m going to give a brief overview on how to improve PHP-FPM’s performance, by discussing PHP-FPM’s three process manager types, and which one is best to use under which circumstance.

PHP-FPM can use one of three process management types:

  • static
  • dynamic; and
  • ondemand

Let’s look at what each one is in a little bit of detail.

Static

Static ensures a fixed number of child processes are always available to handle user requests. This is set with pm.max_children. In this mode requests don’t need to wait for new processes to startup, which makes it the fastest approach.

Assuming that you wanted to use static configuration with 10 child processes always available, you would configure it in /etc/php/8.3/fpm/pool.d/www.conf (assuming you’re using Debian/Ubunut’s PHP-FPM’s default configuration file) as follows:

pm = static
pm.max_children = 10

To see if the configuration change has been effective, after restarting PHP-FPM, run pstree -c -H <PHP-FPM process id> -S <PHP-FPM process id>. This will show that there are ten processes available, as in the example below.

php-fpm8.3-+-php-fpm8.3
           |-php-fpm8.3
           |-php-fpm8.3 
           |-php-fpm8.3 
           |-php-fpm8.3 
           |-php-fpm8.3 
           |-php-fpm8.3 
           |-php-fpm8.3 
           |-php-fpm8.3 
           |-php-fpm8.3 
           |-php-fpm8.3

Dynamic

In this mode, PHP-FPM dynamically manages the number of available child processes and ensures that at least one child process is always available.

This configuration uses five configuration options; these are:

  • pm.max_children: The maximum number of child processes allowed to be spawned.
  • pm.start_servers: The number of child processes to start when PHP-FPM starts.
  • pm.min_spare_servers: The minimum number of idle child processes PHP-FPM will create. More are created if fewer than this number are available.
  • pm.max_spare_servers: The maximum number of idle child processes PHP-FPM will create. If there are more child processes available than this value, then some will be killed off.
  • pm.process_idle_timeout: The idle time, in seconds, after which a child process will be killed.

Now the fun part comes; how do you calculate the values for each setting? Sebastian Buckpesch offers the following formula:

Setting Value
max_children (Total RAM – Memory used for Linux, DB, etc.) / process size
start_servers Number of CPU cores x 4
min_spare_servers Number of CPU cores x 2
max_spare_servers Same as start_servers

We also need to set pm.process_idle_timeout, which is the number of seconds after which an idle process will be killed. If you don’t want to calculate this from scratch, we wrapped all this into a simple to use calculator tool to get the optimal FPM configuration settings.

Let’s say that our server has two CPUs, each with four cores, and 8GB RAM. If we assume that Linux and related daemons are using around 2GB (use free -hl to get a more specific value), that leaves us with around 6192MB.

Now, how much memory is each process using? As a rule of thumb, you need to look at the memory_limit configured in PHP. To calculate a more accurate number, there’s a Python script called ps_mem.py. After running it, using sudo python ps_mem.py | grep php-fpm, you’ll get output similar to the following:

28.4 MiB +  33.8 MiB =  62.2 MiB    php-fpm8.3 (11) 

The first column is private memory. The second column is shared memory. The third column is the total RAM used. The fourth column is the process name.

From the above, you can see that the process size is 62.2MiB. So, feeding all of that information into our formula, we arrive at the following:

# Round the result up. (8192 - 2000) / 62.2 

Based on that, we come to the following settings values:

Setting Value
max_children 100
start_servers 32
min_spare_servers 16
max_spare_servers 32

We’ll leave the pm.process_idle_timeout to the default of 10s. Assuming that we’re happy with these settings, then we’d configure it as follows:

pm = dynamic
pm.max_children = 100
pm.start_servers = 32
pm.min_spare_servers = 16
pm.max_spare_servers = 32 pm.max_requests = 200

You can also use memory monitoring tools such as Tideways on a regular basis to monitor how much memory your application is using.

ondemand

ondemand has PHP-FPM fork processes when requests are received. To configure PHP-FPM to use it, we need to set pm to dynamic, and provide values for:

  • max_children
  • process_idle_timeout
  • max_requests

max_requests sets the number of requests each child process should execute before respawning. The documentation suggests that this setting is helpful for working around memory leaks.

Assuming that we take the same settings as for dynamic, we’d configure it as follows:

pm = ondemand
pm.max_children = 100
pm.process_idle_timeout = 10s
pm.max_requests = 200

Which Configuration Is Right For You?

Honestly? The answer is: “it depends“, as it always depends on the type of applications that you are running. However, here are some suggestions as to which configuration to choose. To nail the right secondary configuration values for your FPM configuration, we recommend you to look into our simple calculator.

Low Traffic Site

If you have a low traffic site, such as one hosting a backend control panel, such as cPanel, then use ondemand. Memory will be saved as child processes will only be spawned when they’re needed and killed off when they’re no longer required. As it’s a backend, users can wait a moment or two longer while a thread spawns to handle their request.

High Traffic Site

If you have a high traffic website, then use static and adjust the settings based on your needs over time and your available hardware resources. It might seem like overkill to have a large number of child processes always ready to receive requests.

However, high-traffic sites need to respond as quickly as possible. Therefore, it’s essential to use static so that a sufficient number of child processes are ready to do so.

By using ondemand, child processes will likely consume too much memory being spawned and killed, and the startup delay will have a performance hit.

Using dynamic likely won’t be as bad, depending on the configuration. However, you may end up with a configuration that effectively mirrors static.

Using Multiple Pools for Frontend/Backend

Now for one final recommendation: serve the frontend and backend of your website using different pools. Say you have an e-commerce site, perhaps powered by Magento. You can look at the application as being composed of two parts:

  • A frontend where customers can browse and make purchases
  • A backend, where admin staff manage the shop (such as adding/removing products, categories, and tags, and reviewing ratings)

When viewed this way, it makes sense to have one pool that serves the frontend and another that serves the backend and to configure each appropriately.

For what it’s worth, you could split up any application into multiple parts using this strategy, if it makes sense to do so. Here’s how to do so.

In /etc/php/8.3/fpm/pool.d/www.conf, add the following configuration:

; frontend
[frontend]
listen = /var/run/php-fpm-frontend.sock
user = www-data
group = www-data
listen.owner = www-data
listen.group = www-data
pm = static
pm.max_children = 5;
 
; backend
[backend]
listen = /var/run/php-fpm-backend.sock
user = www-data
group = www-data
listen.owner = www-data
listen.group = www-data
pm = ondemand
pm.max_children = 5
pm.process_idle_timeout = 10s

This creates two pools, one for the frontend, and one for the backend. Both have the same user and group, but have different process manager configurations and are connected to via different sockets.

The frontend pool uses a static configuration with a small maximum number of child processes. The backend pool uses the ondemand configuration, also with a small number of configurations. These numbers are arbitrary, as they’re for the purposes of an example.

With that saved, for your NGINX vhost file, use the following configuration:

server {
    listen 80;
    server_name test-site.localdomain;
    
    root /var/www/test-site/public;
    
    access_log /var/log/nginx/test-site.access.log;
    error_log /var/log/nginx/test-site.error.log error;
    
    index index.php;
    
    set $fpm_socket "unix:/var/run/php-fpm-frontend.sock";
    
    if ($uri ~* "^/api/") { 
        set $fpm_socket "unix:/var/run/php-fpm-backend.sock";
    }
     
    location / {
        try_files $uri $uri/ /index.php;
        
        location ~ .php$ {
            fastcgi_split_path_info ^(.+.php)(/.+)$;
            fastcgi_pass $fpm_socket;
            fastcgi_index index.php;
            include fastcgi.conf;
            fastcgi_param SCRIPT_FILENAME $document_root$fastcgi_script_name;
        }
    }
}

This creates a virtual host configuration that sends requests either to the frontend or backend pool, based on the location requested. Any requests to /api are sent to the backend pool, and all other requests are routed to the frontend.

In Conclusion

That’s been a rapid introduction to tuning PHP-FPM for better performance. We’ve looked at the three different process manager configurations, their related settings, and discussed when each configuration makes sense. We then finished up by looking at worker pools.

Four Logging Best Practices for Production Applications

BONUS: We have discussed this topic with an expert in the PHP community in our podcast:

Logging is an essential part of just about any PHP-based application; whether in a script or a larger application. However, how little is too little and how much is too much to log?

If we don’t log enough information, when something goes wrong, as it invariably does, then we won’t have enough information available to determine what went wrong so that we can fix the problem. However, if we have too much information, then we’ll be unable to filter out the white noise.

In this post, I’m going to step through four best practices for logging in production, practices that you can apply to ensure you have the right amount of information as and when you need it.

Know The Right Log Level to Use

If you’ve spent any amount of time around logging libraries, you’ll know that they support several different logging levels. Most of them follow, to one extent or another, RFC 5424. And, if you’ve had a chance to review PSR-3: Logger Interface, then you’ll know that there are eight levels.

However, you may not know when to use each level. If so, here’s a broad overview of when to use each level.

  • Emergency: This level is for when the system is unusable.
  • Alert: This level is for when action must be taken immediately.
  • Critical: This level is for reporting conditions that critically affect the application.
  • Error: This level is for problems that prevent your application from continuing normally. These types of problems can include the database being down or inaccessible.
  • Warning: Use this level for alerts about something going wrong, but the application can continue functioning. This might include socket timeouts or retries, and invalid logins attempts.
  • Notice: Use this level for alerts about issues that start to indicate something is going wrong with your application, yet which aren’t too significant.
  • Info: Use this level for general messages, but not for debugging information.
  • Debug: Use this level for tracing information.

Know What To Write In a Log Message

The previous section gave a broad overview of when to use each log level. However, what do you write in a log message?

You don’t want the message to be too extensive. You don’t want to be too brief, either.

Splunk has an excellent set of suggestions. Of those suggestions, I’ve found the following five to be the most pertinent:

  • Create events that humans can read: Make sure that whatever it is that you’re logging, that it’s intelligible. If the information needs to be stored in a binary format, because it’s too extensive, then ensure that tools are available that can decode that format.
  • Use timestamps: It’s essential to know when an event occurred, especially as you’re going to be reading many log entries at a time to track down the source of the error. Make sure that log messages can be read in the correct order so that they don’t exacerbate the problem.
  • Use unique identifiers (IDs): Unique identifiers can help information be filtered better than timestamps alone. They can help users filter by an application component, node, section, or other attributes.
  • Use developer-friendly formats: There are a plethora of formats that developers are commonly familiar with, that they know how to parse, and are well suited to storing information in a structured way.
  • Identify the source: Where did the error originate? Ensure that you identify the source of the error, such as the class, function, and file.

Centralize Logging

No matter the size of your application, logs should be stored in a centrally available location. If not, then you run the risk of not having all the relevant information at hand when something goes wrong.

If this seems strange, consider the following scenario. Your application is quite successful so has been scaled horizontally, with multiple nodes available to handle requests which sit behind a load balancer.

If the code is written such that log entries are written to the node that the request is handled by, what happens when one or nodes become unavailable or inaccessible? Alternatively, when an error occurs:

  • How long will it take to retrieve all of the log information from each node in the cluster?
  • How will you know on which node the error occurred?

To avoid situations such as these, I strongly advocate for centralized logging. You can use a dedicated, internal, logging server or a commercial logging solution, such as Loggly, Papertrail, or Amazon Elasticsearch Service.

It should be relatively trivial to either log to a centralized location, or to the operating system’s log service and configure it to forward the log messages out to a central location. This should happen regardless of the logging solution, the logging library (such as Monolog), and whether you’re deploying to a Linux or Windows server.

For example, you could log to Rsyslog on Linux which forwards those log messages to a central log server. On Windows, you could configure it to forward log messages to a central collector service.

Regardless of whether the central server is using an open-source tool such as ELK or a commercial service such as Loggly, the application’s logs can be centrally accessed and backed up, in case of some form of a natural disaster.

Understand the Difference Between Domain Messages and Framework Messages

When you’re logging, make sure that you distinguish between these two types of messages. Domain messages relate to the events within the business logic of your application. Framework (and library) messages are those that relate to libraries, frameworks, and other low-level code which your application uses.

Here’s an example of a domain message. It shows a domain “event” that was triggered within the application.

$logger->info("User $userId with $email registered for newsletter $name"); 

And here’s an example of a framework message. It shows the matched route when the given URL was requested, and which controller was dispatched to handle it.

$logger->info("Route $foo matched URL $url: Executing controller $controllerClass"); 

With that said, in production it might make most sense to have two logger services:

  • One for domain messages and one for framework messages, which would log up to INFO level; and
  • One for framework/library messages, which would log up to either WARNING or ERROR.

Here’s a small, for example purposes only, snippet on how to configure two different Monolog logger instances, one for domain messages, and one for framework messages.

// Create the logger for domain messages $domainLogger = new Logger('domain_logger');

// Create the logger for framework messages $frameworkLogger = new Logger('framework_logger');

// Now add some handlers, which log up to a certain log-level $domainLogger->pushHandler(new StreamHandler(__DIR__.'/domain.log', Logger::INFO)); $frameworkLogger->pushHandler(new StreamHandler(__DIR__.'/framework.log', Logger::ERROR)); 

Conclusion

And that’s four logging best practices that you can use when developing your PHP applications. From the right log level to use to centralizing logging, each should help you store more meaningful information in the right way.

PHP & Shared Nothing Architecture: The Benefits and Downsides

BONUS: We have discussed this topic with an expert in the PHP community in our podcast:

There are several ways (architectures) in which applications can work, with the most notable being:

  • Shared-Nothing
  • Shared-Disk
  • Shared-Memory
  • Shared-Everything

In this post, we’re going to look at what Shared-Nothing Architecture is, along with its benefits and downsides, concerning PHP and its impact on performance.

Several different languages can be used for web-based application development, most of which you are likely already familiar. The most popular of these are JavaScript, Ruby, Python, Java, Go, R, and, of course, PHP. Of these languages, however, only PHP uses a Shared-Nothing Architecture by default.

If these terms are new to you, let’s briefly step through them.

A Shared-Nothing Architecture

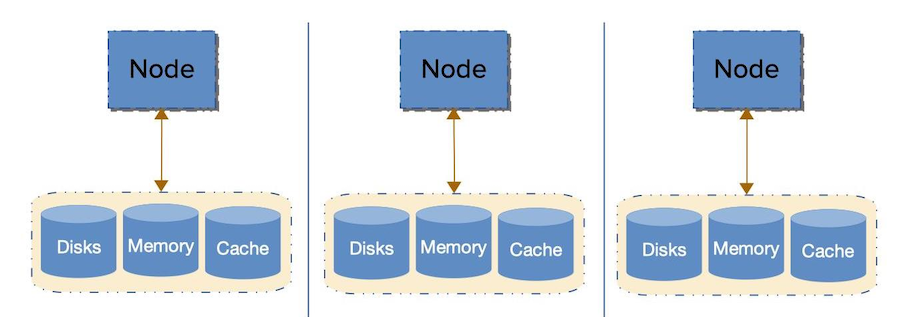
A Shared-Nothing Architecture is a distributed-computing architecture in which nodes do not share (independently access) memory or storage with any other. The intent is to eliminate contention among nodes.

Shared-Nothing ArchitectureShared-Nothing Architecture

A Shared-Disk Architecture

A Shared-Disk Architecture is quite similar to shared-nothing, except that every node interacts with a shared disk, typically a database (such as MySQL, PostgreSQL, and Oracle), or a shared filesystem typically provided by a storage area network (SAN) or network-attached storage (NAS).

A Shared-Memory Architecture

Similar to shared-disk, the Shared-Memory Architecture, as the name implies, is where each node makes use of a shared-memory resource. This could be a cache provided by Redis, Memcache or APCu.

A Shared-Everything Architecture

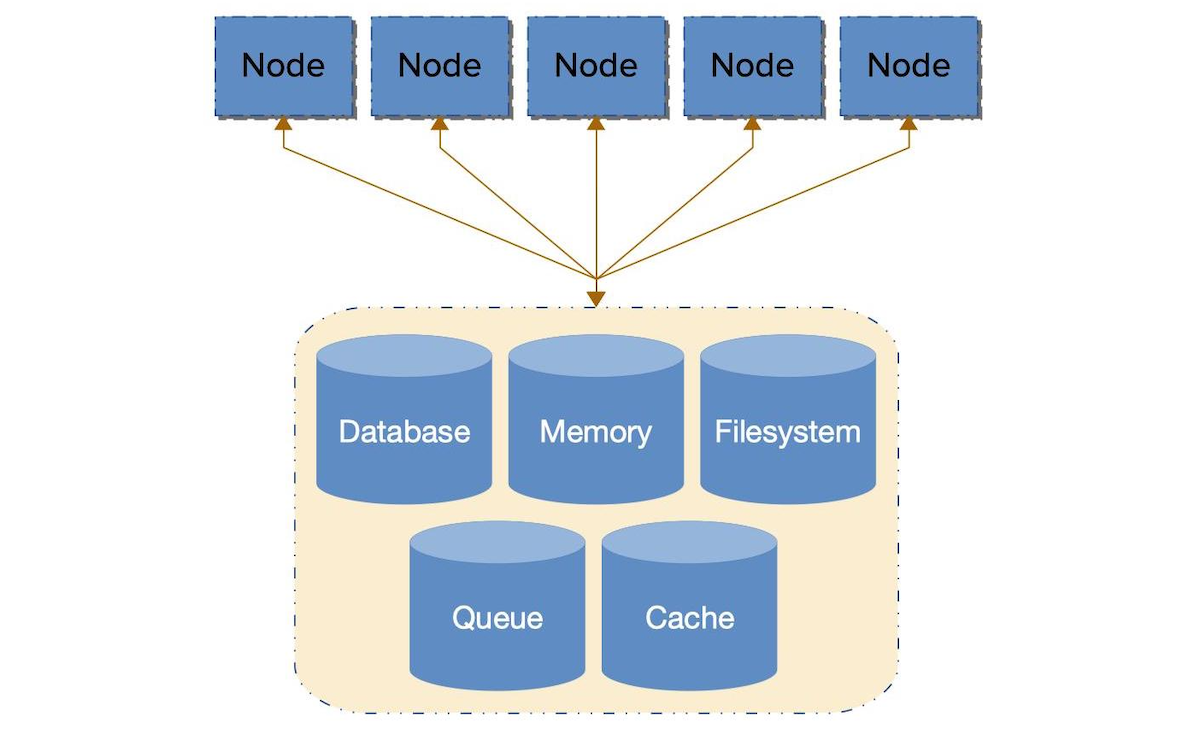
As the name implies, this is where each node shares all resources with every other node.

Shared-Everything ArchitectureShared-Everything Architecture

Shared Nothing = PHP By Default

If you’ve ever considered how PHP works, by default, then you’ll know that it is based around a shared-nothing model. This is because, for every request a node starts from scratch — with no memory shared from the prior request of the same node. It brings all the required objects into memory, performs the required processing, and then releases all the resources when the request has been fulfilled. This approach lies in stark contrast to languages such as Java, which persist objects across multiple requests.

The Benefits

However, why is this model a good one? Let’s consider the benefits. A Shared Nothing architecture has several key benefits; these are:

  • It Eliminates Single Points of Failure
  • Its Simpler to Scale
  • It Makes Upgrades Simpler
  • It’s a Drastically Simpler Programming Model

It Eliminates Single Points of Failure

As nodes don’t share any resources, applications can continue functioning even if one or more nodes fail. Yes, application performance drops with each node that fails, but the application can continue to function, as nodes don’t share any resources between themselves.

Its Simpler to Scale

As each node can serve requests to the application without having to deal with resource contention, then as many additional nodes as are required can be added, as and when necessary, to scale the application to provide sufficient capacity.

It Makes Upgrades Simpler

As with the previous point, individual nodes can be upgraded, or replaced, without shutting down the entire application. No node is aware of any other, so it doesn’t matter if one is removed, upgraded, or improved.

It’s a Drastically Simpler Programming Model

PHP developers don’t, often, have to think about memory too much. In most PHP applications, memory is used within a single, often very short-lived, request. Objects are initialized, used, and dropped. Consequently, developers, generally, don’t have to deal with the implications of objects that persist for a long time; such as with worker processes, or across multiple requests.

Is it A Practical Model?

Like many questions, the answer is: “it depends”, and is based on many factors. The prime among them is: “How is your application is designed and/or developed?” That design (or legacy development) may necessitate not strictly adhering to a shared-nothing architecture, but rather a combination of one or more of the others.

If it helps, cast your mind back to the earlier versions of PHP. In those days, PHP was, virtually, wedded at the proverbial hip with MySQL. Countless articles and tutorials detailed PHP apps storing all their data in a MySQL database.

Then, over the years as applications became larger and more complex, a greater emphasis was given to sessions and caching as well. Sessions were often stored on a shared filesystem or in a database and application objects, and its data were often cached in a high-performance, in-memory data store, such as Redis or Memcached. And let’s not forget the use of queueing servers, such as RabbitMQ, Beanstalkd, ActiveMQ, and Redis.

As a result of these, and other, changes, it’s very easy for PHP applications to more likely be a blend of shared-memory, shared-disk, or shared-everything.

However, if care’s given, each node can still, more or less, operate in a shared-nothing manner.

Is Shared-Nothing The Right Approach?

Before you seek out alternatives, it’s worth asking if you the benefits of not using PHP with Shared Nothing are worth it

As we’ve seen so far, shared-nothing offers a significant number of benefits. Additionally, PHP’s shared nothing design provides a significant performance advantage, and larger frameworks are built around this approach.

That said, there are individual use-cases that work better with sharing memory across requests, such as Websockets. What’s more, if you build an application based around shared-nothing, it’s not a trivial endeavor to move away from it. You can’t just flip the proverbial switch at a time of your choosing. So, I’d strongly encourage to you carefully consider if not using it truly is what you want to do.

Running PHP Without Shared Nothing

If you’re keen to build applications in PHP which don’t fully implement a shared-nothing architecture, then you may be interested in knowing that there are some frameworks available to help out. These are:

  • Roadrunner: a high-performance PHP application server, load-balancer, and process manager written in Golang.
  • Swoole: Enables PHP developers to write high-performance, scalable, concurrent TCP, UDP, Unix socket, HTTP, Websocket services in PHP programming language without too much knowledge about non-blocking I/O programming and low-level Linux kernel.
  • ReactPHP: a low-level library for event-driven programming in PHP. At its core is an event loop, on top of which it provides low-level utilities, such as Streams abstraction, async DNS resolver, network client/server, HTTP client/server and interaction with processes.

In Conclusion

In this article, we’ve taken a (brief) look at four of the most common application architectures, but given particular emphasis to one: shared-nothing. We’ve learned about its key benefits and their impact on application performance. We also got an overview of three of PHP’s most common shared-nothing frameworks, those being Roadrunner, Swoole, and ReactPHP.

I hope that this article’s helped give you a clearer picture of the architectural models available, and why PHP’s default is such a powerful one.

Reliable Integration with Third-Party APIs in PHP

BONUS: We have discussed this topic with an expert in the PHP community in our podcast:

It’s a fact of modern software development that aspects of our applications interact with third-party APIs. This could be for any number of reasons, with some common ones being payment processing, telecommunications, logging, and data analysis.

So, since our applications rely upon third-party APIs so much, we need to ensure that we integrate with them as effectively — and defensively — as we can. Otherwise, when the APIs break, so too will our application — and its reputation with our users.

To help avoid a loss of reputation, I’m going to cover five ways in which you can integrate with third-party APIs and ensure a minimum of downtime and stress.

Implement API Monitoring

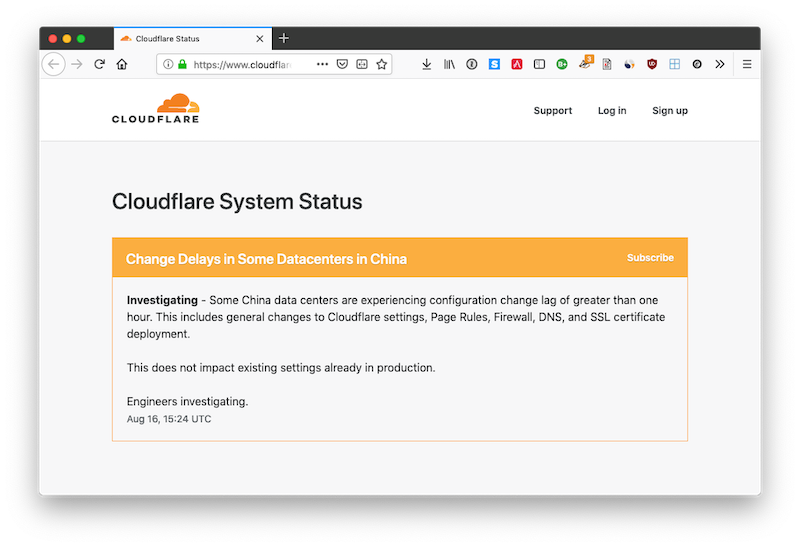
Cloudflare status pageCloudflare status page

Let’s start with monitoring. Even though third-party APIs aren’t part of your infrastructure, you still have to know whether they’re working or not. This is especially important when you consider that some of the most notable internet platforms have had outages in recent years.

Here are some of the most notable:

  • Facebook has had two outages in 2019 so far, one in March and another in April. These outages, as you would expect, had a knock-on effect on Facebook’s most well-known services, WhatsApp, and Instagram.
  • Google, Amazon, and Reddit experienced outages on Jun 24, this year. These impacted a significant number of other services and businesses which rely upon Google and Amazons extensive service offerings. Did you do any meaningful work that day?
  • Twitter had an outage in April 2018.

To monitor effectively, you need to integrate monitoring services into your infrastructure and make them a standard part of your development processes. Like any aspect of software development, there are many sites and vendors on the market that provide monitoring services.

A number of the more well-known ones are:

Alternatively, several third-party APIs provide a status endpoint, such as the one below from Cloudflare, which are easy enough to integrate against. They may offer SDKs which make the process relatively trivial. Alternatively, you could roll a homegrown solution, such as the one-liner below, which checks if Cloudflare is currently online, using Selenium with Python.

from selenium import webdriver

executable_path = "path/to/geckodriver" domain = "https://www.cloudflarestatus.com/" xpath = "//div/span[starts-with(@class,'status')]"

options = webdriver.FirefoxOptions() options.headless = True driver = webdriver.Firefox(options=options, executable_path=executable_path) driver.get(domain)

element = driver.find_element_by_xpath(xpath) print(element.text) driver.quit() 

Respect the APIs Rate Limits

Most APIs — especially when using guest accounts or introductory free tiers — limit the number of requests, by using rate limits. Rate limits restrict clients’ ability to make more than a fixed number of requests to an API within a given time frame.

The time frame can range from requests per minute to requests per day. When rate limits are reached, subsequent requests are either temporarily blocked or throttled, until the time frame expires. One example is [Git Hub’s API], which rate limits requests to 5,000 requests per hour.

There are many reasons why APIs implement rate-limiting. One of the most common is to avoid a malicious script hogging all of an APIs resources.

There are several ways in which APIs communicate this information. Using Git Hub’s API as our working example; the API sends three response headers, these are:

Header Description
X-RateLimit-Limit The maximum number of requests you’re permitted to make per hour.
X-RateLimit-Remaining The number of requests remaining in the current rate limit window.
X-RateLimit-Reset The time at which the current rate limit window resets in UTC epoch seconds.

Here’s an example, taken from their API documentation:

HTTP/1.1 200 OK Date: Mon, 01 Jul 2013 17:27:06 GMT Status: 200 OK X-RateLimit-Limit: 60 X-RateLimit-Remaining: 56 X-RateLimit-Reset: 1372700873 

From this information, you can see that:

  • Requests are rate limited to a maximum of 60 requests per hour.
  • 56 requests remain within the current time frame.
  • The rate limit window resets on Mon Jul 1 19:47:53 CEST 2013 (date -d @1372700873).

Ensure that this information is used in your application’s integration code, to respond appropriately when the rate limit draws near and when it is exceeded.

Applications should also check if servers are overwhelmed by checking a response’s HTTP status code. If an HTTP 429 (Too Many Requests) is returned, you know that the server’s under high load and can’t currently respond.

For an amusing introduction to rate limiting, check out What is API Rate Limiting All About?.

Implement Retries

There are several ways in which code can handle rate limits (and API request failures). The application could choose to ignore exceptions thrown when rate limits are reached, but doing so isn’t altogether helpful. The application could instead be coded to back off when approaching the rate limit.

Alternatively, a third approach is to implement retries. In short, retries attempt to complete a failed API request a set number of times within a set interval.

If one of the requests completes successfully, then the job is removed. If not, then the failed request is logged for later analysis. Retries could likely be handled by a combination of a queueing server and a background process.

If rate limits are regularly being exceeded, it may be time to either revisit your application’s architecture or to consider increasing your rate plan. That said, use monitoring to stay abreast of request volume and rate limit overruns.

Always Have Tests

It should go without saying, but tests are essential for code that integrates against third-party APIs, as well as everything else. I was all too glad that I had them in place some years ago when I was integrating against a third-party API.

While the vendor’s documentation was, for the most part, quite good, the stability of the API wasn’t! As a result, requests to the vendor’s API would intermittently fail. By having tests in place, however, along with the code under version control, we could verify that our code:

  1. Hadn’t changed
  2. Still integrated correctly, based on the latest available version of the vendor’s API documentation.

Knowing this was particularly important. This was because the vendor’s first resort was often to say that there must be some mistake or change in our code because the relevant section of their API had not changed. Having tests showed me that our code was unchanged and gave me the confidence to pursue the fact that a recent release on their end was responsible for the outage.

Read the Documentation

Stripe documentation home pageStripe documentation home page

A well-written API has well written and feature-complete documentation, containing the details of, but not limited to:

  • Client errors
  • Every endpoint
  • Example requests
  • How to authenticate
  • Pagination
  • Request parameters (which document every field, its type, and a short description)
  • Response headers
  • Response objects (which document every field, its type, as well as a short description).

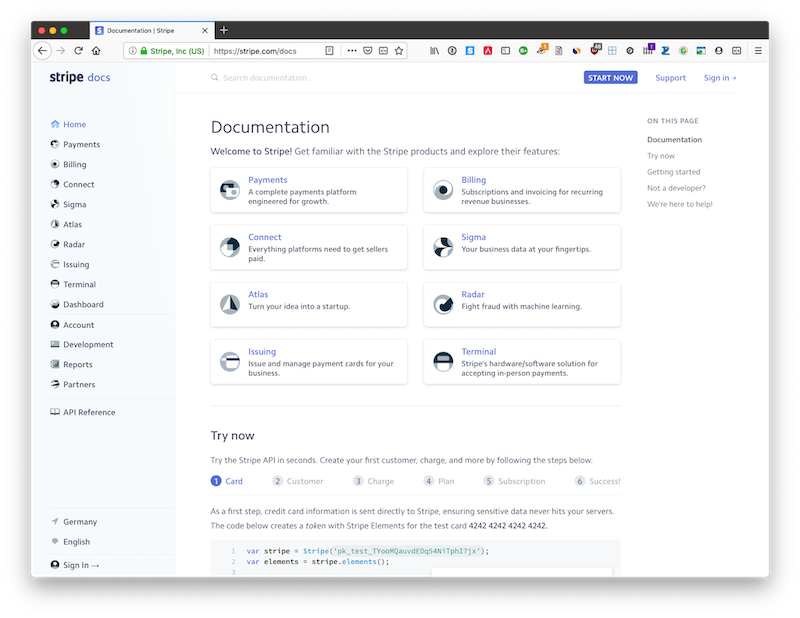
In addition to this, the API documentation is laid out in a well-structured, intuitive, and easy-to-read format. An excellent example of this is Stripe’s API documentation. I’ve used it on several occasions and have found it to be a great example.

Assuming that the API documentation is updated with each API release, you can refer to it with confidence. If you’re looking to integrate with a third-party API and its API is either poorly documented — or worse, not documented — I strongly suggest choosing an alternative vendor.

In Conclusion

Those are five ways that help ensure reliable communication when integrating against third-party APIs. I hope they help make the process simpler, more reliable, and more efficient.

PHP Timeouts, Retries and Limits

BONUS: We have discussed this topic with an expert in the PHP community in our podcast:

We have blogged about timeouts, retries and limits before in these three blog posts:

We discussed all these topics with Bastian Hoffmann from our partner SysEleven in this podcast episode.

Four Key Considerations When Running PHP Applications On Multiple Servers

BONUS: We have discussed this topic with an expert in the PHP community in our podcast:

Building and deploying PHP applications on one server is a, relatively, straightforward process. However, what about deploying a PHP application across multiple servers? In this article, I’m going to discuss four key considerations to bear in mind when deploying PHP applications when doing so.

Load Balancing

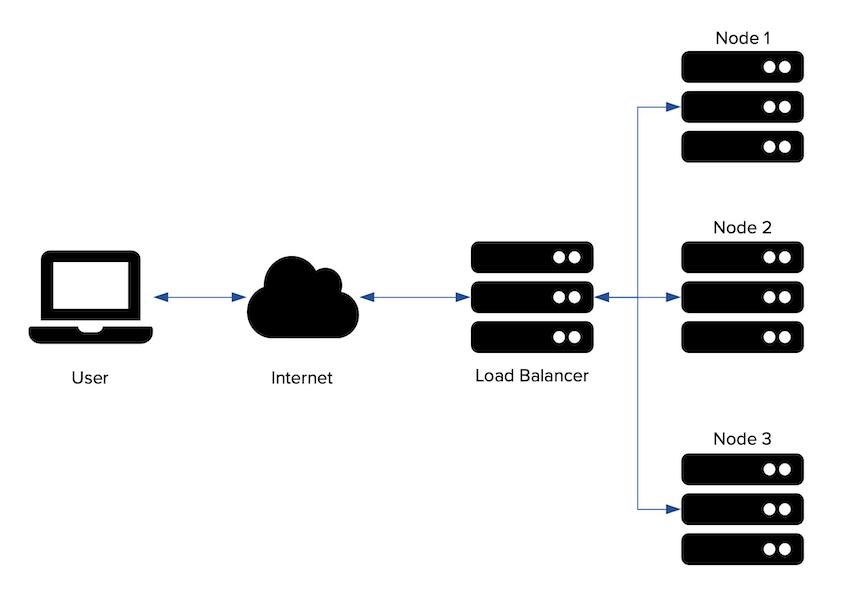
Load balancing is where requests are distributed uniformly across servers in a server pool. Load balancers receive user requests and determine which server in a server pool to forward the request for final processing. They can either be hardware- (e.g., F5 Big-IP, and Cisco ACE) or software-based (e.g., HAProxy, Traefik, and Nginx).

Simple load balancer diagramSimple load balancer diagram

Using them increases network efficiency, and application reliability and capacity, by adding servers on a planned basis or to meet short-term demand. In applications that use them, users never know that the same server isn’t handling their requests every time. All they know is that their requests are handled.

Load balancers typically use one of six methods for determining the server to pass a given request. These are:

  • Round Robin: Requests are distributed evenly across all servers in the pool.
  • Least Connections: Requests are sent to the server with the least number of currently active requests.
  • IP Hash: Requests are routed based on the client’s IP Address.
  • Generic Hash: Requests are routed based on a user-defined key.
  • Least Time: Requests are sent to the server with the lowest latency.
  • Random: Requests are distributed randomly across all servers in the pool.

While the benefits are many, migrating a load balanced-architecture requires a number of factors to be considered, which include:

  • Does each server in the cluster have the same physical capacity?
  • How Are Nodes Upgraded?
  • What Happens if a Node Is Unreachable or Fails?
  • What Kind of Monitoring Is Required?

These, and other questions, need answering before choosing and implementing the correct load balancer. That said, if you’re going to setup load balancing yourself, I strongly encourage you to use NGINX, as it’s likely the most used option. You can find out how to get started with NGINX’s load balancing documentation.

Sessions

Now that we’ve considered load balancing, the next logical consideration is: how are sessions handled? Sessions allow applications to get around HTTP’s stateless nature and preserve information across multiple requests (e.g., login status and shopping cart items).

By default, PHP stores sessions on the filesystem of the server which handles the user’s request. For example, if User A makes a request to Server B, then User A’s session is created and stored on Server B.

However, when requests are shared across multiple servers, this configuration likely results in broken functionality. For example:

  • Users may be part-way through a shopping cart and find that their cart is unexpectedly empty
  • Users may be randomly redirected to the login form
  • Users may be part-way through a survey only to see that all their answers have been lost

There are two options to prevent this:

  • Centrally-stored sessions; and
  • Sticky sessions

Centrally Stored Sessions

Sessions can be centrally stored by using a caching server (e.g., Redis or Memcached), a database (e.g., MySQL or PostgreSQL), or a shared filesystem (e.g., NFS or [Glusterfs]). Of these options, the best is a caching server. This is for two reasons:

  1. They’re a key-value, in-memory storage solution, which gives them greater responsiveness than an SQL database.
  2. As sessions are always written when a request ends, SQL databases must write to the database on every request. This requirement can easily can lead to table locking and slow writes.

When storing sessions centrally, you need to be careful that the session store doesn’t become a single point of failure. This can be avoided by setting up the store in a clustered configuration. That way, if one server in the cluster goes down, it’s not the end of the world, as another can be added to replace it.

Sticky Sessions

An alternative to session caching is Session Stickiness (or Session Persistence). This is where user requests are directed to the same server for the lifetime of their session. It may sound like an excellent idea at first, but there several potential drawbacks, including:

  • Will cold and hot spots develop within the cluster?
  • What happens when a server isn’t available, is over-burdened, or has to be upgraded?

For these reasons, and others, I don’t recommend this approach.

Shared Files

How will shared files be updated? To make things just that much trickier, there are, effectively, two types of shared files:

  1. User-provided files and one-off items, such as PDF invoices.
  2. Code files and templates.

These need to be handled in different ways. Let’s start with code files and templates.

These types of shared files need to be deployed to all servers when a new release or patch is made available. Failing to do this will see any number of unexpected functionality breaks.

The question is: what’s the best approach to deploy them? You can’t take down and update nodes individually. Why? What happens if users are directed to a server with new code on one request and directed to a server with the old code on a subsequent request? Answer: broken functionality.

One solution is to change the load balancer method to stop directing requests to nodes during updates. After nodes are updated, they’re allowed to accept new session requests.

This could then be repeated until all nodes within the cluster have been upgraded or patched. It’s workable, but it’s also, potentially, quite complicated and time-consuming.

Now let’s look at user provided and one-off files. These types of files, include images, such as a profile image PDF invoices, and company/organizational reports. These types of files need a shared filesystem, whether local or remote (such as S3).

Some potential solutions are a clustered filesystem such as Glusterfs, or a SaaS solution, such as Amazon S3, or Google Cloud Storage.

A shared (clustered) filesystem simplifies deployment processes, as new releases and patches, only need to update files in one location. The deployment process likely doesn’t need to handle file replication to each node within the filesystem cluster, as the service should provide that.

However, like centrally stored sessions, the filesystem has the potential to become a single point of failure, if it goes down or becomes inaccessible. So, this needs to be considered and planned for as well.

Implementing one of these solutions allow files to be centrally located, where each node can directly access it, as and when required. Many of PHP’s major frameworks (including Laravel, Symfony, and Zend Expressive) natively support this approach. Alternatively, packages such as Flysystem can help you implement this functionality in your application.

Job Automation

It’s quite common in modern applications — especially in PHP — to use Cron to automate regular tasks. These can be for any number of reasons, including file cleanup, cleanup abandoned shopping carts, email processing, and user account maintenance.

However, if the application is composed of multiple nodes, there are several questions to consider. For example:

  • Which server does Cron run on?
  • Does the Cron service run on a separate server from the web application?
  • If one server is dedicated to running Cron tasks:
    • What happens when it goes down, say because of a hardware failure?
    • What happens when it’s taken down for maintenance?
    • What happens when it’s not accessible?

You could roll your own solution, or you could use one of several existing solutions, such as Dkron or Apache Mesos and Airbnb Chronos. Each of these has its pros and cons.

If you roll your own solution, it may be a lot of work in addition to your existing application. It may lead you to experience the same multi-server considerations that we’re currently discussing. Alternatively, if you use one of the above solutions, you will need to plan out the implementation and maintenance of that server and how to best integrate it with your application.

All of these are viable approaches. It’s just important to consider this in advance.

In Conclusion

Those are four key considerations to keep in mind when transitioning from a single to a multi-server setup. There are others in addition to these four.

However, these are four of the most important. I hope that they provide a sound foundation for helping you to understand the potential changes and pitfalls involved.

5 Ways to Increase PHP Performance

BONUS: We have discussed this topic with an expert in the PHP community in our podcast:

Out of the proverbial, box, PHP provides a decent performance. However, there are several things that we, as PHP developers and systems administrators, can do to increase its performance even further; sometimes with almost no effort.

In this post, I’m going to step through five of those ways. By the time you’re finished reading, you should see at least a notable increase in the performance of your PHP application. Let’s begin.

Use PHP 8 (or at least 7)

One of the best ways to improve PHP’s performance is to run the latest version (PHP 8). Or if you are struggling with old legacy code, at least a version of PHP 7. They offer a significant speed improvement over any previous PHP 5 version. Now, results will always vary, as no two applications are ever the same. However, based on reports by a range of different developers and notable hosting companies, the performance improvements are significant.

Here’s a small sample:

If that’s not enough for you, check your benchmarks and see what they say.

Additionally, PHP 7.0.0 was released on December 3rd, 2015, which is already almost a decade ago.

What’s more, the final release of PHP 5, 5.6, went EOL (End of Life) on Dec 31, 2018. So, if you haven’t already, it’s about time you made the transition to PHP 7. Make the upgrade and, as Rasmus said at phpCE 2018, go green(er) by reducing your hosting costs.

Uninstall Xdebug

The next thing to check is that Xdebug is not installed on your production servers. Sure, Xdebug is one of the most sophisticated and comprehensive profilers and debuggers for PHP, but it should never be enabled (even installed) on a production server.

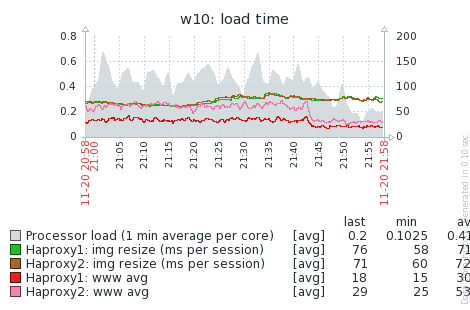
While the performance benchmarks vary (they always do), one report on Stack Overflow showed a 50% performance boost by completely removing Xdebug. Though for some modes in Xdebug 3, the overhead is lower. What’s more, it’s important to note that even though Xdebug was installed on the server — it wasn’t even enabled!
Xdebug performance benchmarkXdebug performance benchmark

To check if it’s installed, run php -m | grep -i xdebug or check your hosting provider’s administration panel. And if you’d like to know more about how Xdebug works, check out the Xdebug documentation.

Use Composer Optimize Autoloader

While we’re all likely very familiar with using Composer to handle package management for us, if we don’t consider optimizing the configuration it generates, our applications aren’t going to perform as well as possible.

Here’s a quote from the composer documentation which explains why:

due to the way PSR-4 and PSR-0 autoloading rules are set up, it Composer needs to check the filesystem before resolving a class name conclusively. This slows things down quite a bit, but it is convenient in development environments because when you add a new class, it can immediately be discovered/used without having to rebuild the autoloader configuration.

To improve performance, Composer offers three optimization levels; these are:

  • Class map generation
  • Authoritative class maps
  • APCu cache

1: Class map generation

This strategy converts PSR-4/PSR-0 rules into classmap rules. This strategy is quicker because the classmap can instantly return the full path to known files and avoids a filesystem stat operation.

To enable this optimization level, run the following command:

composer dump-autoload --optimize 

2/A: Authoritative class maps

In addition to automatically enabling Level 1, when using this level, if a class is not found in the generated classmap, the autoloader will not attempt to look on the filesystem according to PSR-4 rules. To enable this optimization level, run the following command:

composer dump-autoload --classmap-authoritative 

2/B: APCu cache

This level adds an APCu cache as a fallback for the class map. However, it does not generate the classmap. Given that, level one would need to be enabled manually. To enable this optimization level, run the following command:

composer dump-autoload --apcu 

There are Trade-Offs

While each of these levels can improve application performance, they each have trade-offs which need to be understood before they’re used. Make sure you consult the Composer documentation before using them.

Use OPcache

Since PHP is an interpreted, not a compiled, language, the PHP runtime needs to convert source code to executable byte code, before it can be executed. And as PHP is a shared-nothing architecture, this process needs to happen on each request.

However, with Opcode cache (OPcache), this step only needs to happen once for each file, as the generated Opcodes can be cached in shared memory and referenced there instead.

So, as you can imagine, OPcache is one of the least intensive ways to improve the performance of a PHP application, because no code needs to change. Some reports show up to a 70% speed improvement.

There have been several Opcode caches for PHP over the years. OPCache (formerly Zend Cache) has been bundled with PHP since version 5.5 — and is enabled by default in PHP 7.

To know more about it, check out the OPcache documentation. To know more about performance tweaking OPcache, check out Tideway’s post on tuning it.

Use Preloading

If you’ve not heard of PHP 7.4’s new preloading feature, yet, it’s very cool! In a nutshell, the feature takes OPcache functionality further than it has ever gone before.

To quickly recap, the first time that a PHP source file is encountered, it has to be parsed, then compiled into machine-dependent bytecode, before the Zend Engine can execute it. OPcache significantly reduces the overhead of this process, as after the first time that source code is parsed and compiled down the bytecodes are then stored in an Opcode cache in shared memory.

The next time a request for that file is encountered, PHP checks to see if the Opcode cache has bytecodes for the file. If it does, they’re returned and used. If not (or if the source file has changed since the bytecodes were compiled), the source file is parsed, compiled, and cached. This gives a notable performance boost to PHP.

Now, let’s look at how preloading works. To quote the implementing RFC:

On server startup – before any application code is run – we may load a certain set of PHP files into memory – and make their contents “permanently available” to all subsequent requests that will be served by that server. All the functions and classes defined in these files will be available to requests out of the box, exactly like internal entities. Preloading ensures that:

  • All functions and most classes, defined in these files will be permanently loaded into PHP’s function and class tables and become permanently available in the context of any future request.
  • PHP resolves class dependencies and links with parent, interfaces, and traits (something that doesn’t happen with Opcode caching).
  • PHP removes unnecessary includes and performs other optimizations.

By having the code for an entire application, including its framework (such as Zend Expressive, Symfony, and Laravel) preloaded into memory, code that only changed on server restart, most applications will perform significantly better.

That said, preloading has a few, potential, drawbacks that you should know about:

  • A server restart is required when source files change.
  • Preloading won’t work in shared hosting environments.
  • Preloading won’t work when there are multiple versions of the same application.

Preloading isn’t magical. Both your code and deployment processes will have to be refactored to take advantage of it. For example, someone will have to develop a custom loader script to determine which files to load on server startup, and that script will have to be run at server startup. Regardless, it’s a significant improvement, one worth investing in!

Use a Profiler

Now for an option that will take a little more work than any of the previous five. Often we jump in and attempt to guess where the performance bottlenecks in our applications are, using intuition and educated guesses.

While these can work, they’re not the most efficient approaches. Instead, we can use code profilers to analyze our code and show where the bottlenecks are. Specifically, they help answer questions such as the following:

  • How many times was each method called?
  • What was the maximum execution time of each method?
  • What was the average execution time of each method?
  • How many times was a file included?
  • What path did a request take through an application (from the first to the last code file)?

By drilling down into a profiler’s results, you can often be pleasantly surprised, though more likely shocked, to find that your application is executing code paths and classes that you never expected.

Based on the information in the profiler report, you and your team can then begin to understand better what your application is doing and make informed refactorings to change it, as and where required.

If you’re just getting started with profiling, there are several options available for PHP. The most commonly used are:

In Conclusion

And those are five ways to improve the quality of your PHP applications notably. Any one of them on their own will deliver you a notable performance improvement. However, when used together, you should expect to see a significant performance, not to mention quality, improvement.

August 2023: Updated to reflect current version of PHP (8) and other references.

New Feature: Multiple Production Environments in Pro License

All Tideways applications with a Pro license can now create additional production Environments in addition to the one that is available by default.

Configuring a second or more environments as “production” effects the retention and the traces/minute collected for these environments. By default non-production environments have just 1 day of retention and 1 trace/minute.

Using multiple production environments is often useful if your application is run on multiple clusters for geographical reasons, for example one in Europe, one in the US and one in Asia.

It can also help to temporarily increase the retention and traces/minute for staging environments or environments built for intensive load-testing.

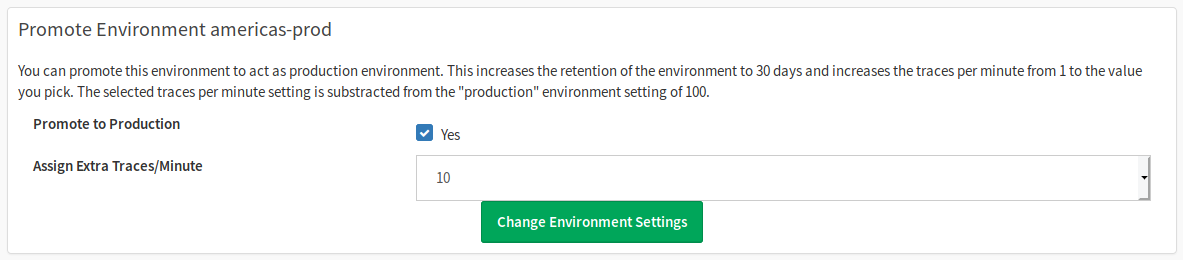
To configure an environment as production go to your “Application Settings” and “Server & Environments” screen.

A new column “Production” indicates which environment has production behavior, which by default is always only the environment by the same name. Click on the Edit link next to a “No” to get to the settings screen and click the checkbox and assign a traces/minute limit to this environment.

The traces/minute limit assigned is substracted from existing production environments. All of them together have 100 traces / minute in the Pro plan.

What Is Garbage Collection in PHP And How Do You Make The Most Of It?

BONUS: We have discussed this topic with an expert in the PHP community in our podcast:

Thanks to PHP being an interpreted language and the fact that it has a garbage collector, PHP developers don’t often have to think about memory management. Unlike developers in compiled languages, such as C/C++, we don’t have to give that much thought to memory allocation and deallocation.

However, it’s helpful to have a broad understanding of how garbage collection works in PHP, along with how you can interact with it so that you can create high performing applications.

In this article, we’ll cover two things:

  • The basics of how garbage collection works in PHP
  • About some of the functions available for interacting with it

By the end of the article, you will be better able to understand how garbage collection affects your application.

How Does Garbage Collection Work In PHP?

PHP’s garbage collection works in three ways:

  • Variables Fall Out Of Scope
  • Reference Counting
  • Garbage Collection

Variable Falls Out Of Scope

If a variable falls out of scope and is not used anywhere else, then it is automatically garbage collected. However, this process can be invoked manually by using unset(). In the example below:

  • $foo will be automatically garbage collected as soon as display_var() finishes executing; and
  • $user will be garbage collected because it was removed via unset().
<?php

function display_var()
{
     $foo = "bar";
     echo $foo; 
}

$user = "Matthew";
unset($user); 

Reference Counting

Similar to other languages, such as Python, Perl, and Tcl (version 8), PHP uses reference counting to help determine when variables are eligible to be garbage collected.

Reference counting is where PHP internally keeps track of how many symbols point to a given variable. When the number of symbols pointing to a variable drops to zero, then the variable is a candidate for being garbage collected at the end of the current request.

In the example below, $A is initialized to “value“, and then $B is initialized pointing to $A.

<?php

$A = "value";
$B = $A; 

When $A is first initialized, it has one reference, the current scope. When $B is initialized to point to $A, then there are two references to $A. If at some point, $B is removed, then $A is then eligible to be garbage collected.

To see how many references are stored for $A, in the code above, you can call xdebug_debug_zval(), assuming that you have Xdebug installed. Using the example above, you will see the following output:

a: (refcount=1, is_ref=0)='value' 

Garbage Collection

If a variable is part of a cyclic reference, e.g., where $A points to $B and $B back to $A, then the variable can only be cleaned up by PHP’s garbage collector. The garbage collector is triggered whenever 10,000 possible cyclic objects or arrays are currently in memory, and one of them falls out of scope.

The collector is enabled by default in every request. In general, this is a good thing. However, as it’s a process that runs, it requires cycles and computational resources, which can’t be devoted to your application. So, if your application is highly time-sensitive, it may be necessary to disable it, if only briefly.

It can be disabled in two ways:

  1. By calling gc_disable
  2. By setting zend.enable_gc boolean to false.

Additionally, if you call the function gc_collect_cycles, then garbage collection is triggered even if you don’t have 10,000 of them in memory yet.

Garbage Collection Has Improved in PHP 7.3

Garbage collection has improved notably in the 7.3 release of PHP, after the merge of a PR by Dmitry Stogov and Nikita Popov. The changes, as the benchmarks below attest, show a marked improvement in the performance of PHP’s garbage collector — especially for an application with a large number of objects.

// Very, very, very many objects 
GC       |    OLD |   NEW disabled |  1.32s | 1.50s enabled  | 12.75s | 2.32s

// Very many objects 
GC       |    OLD |   NEW disabled |  0.87s | 0.87s enabled  |  1.48s | 0.94s

// Less many objects 
GC       |    OLD |   NEW disabled |  1.65s | 1.62s enabled  |  1.75s | 1.62s 

You can see that the garbage collector’s execution time drops notably, in all but when an application only has a small number of objects; which is understandable.

Garbage Collection Statistics

Now we have a basic understanding of what garbage collection is, how it’s implemented in PHP, and when it’s triggered. However, we need more information to be able to use it effectively. Specifically, when it is triggered and how efficient each garbage collection run is.

As of PHP 7.3, PHP provides basic garbage collection information in user land PHP, via gc_status. The function returns:

  • The number of garbage collection runs
  • The number of objects collected
  • The current garbage collection threshold
  • The number of garbage collection roots

For greater detail, however, Xdebug is required. It supports writing far more comprehensive garbage collection statistics in a human-readable, tabular format to a configurable file and directory. Below, you can see what the file would look like:

Garbage Collection Report version: 1 creator: xdebug 2.6.0 (PHP 7.2.0)

Collected | Efficiency% | Duration | Memory Before | Memory After | Reduction% | Function 
----------+-------------+----------+---------------+--------------+------------+---------     
    10000 |    100.00 % |  0.00 ms |       5539880 |       579880 |    79.53 % | bar     
    10000 |    100.00 % |  0.00 ms |       5540040 |       580040 |    79.53 % | Garbage::produce      
     4001 |     40.01 % |  0.00 ms |       2563048 |       578968 |    77.41 % | gc_collect_cycles 

Here is what each table column means:

ColumnDescription
CollectedThe number of items that the garbage collector cleaned up.
Efficiency%The garbage collection efficiency percentage.
DurationThe time taken for garbage collection to complete.
Memory BeforeThe amount of memory available before garbage collection.
Memory AfterThe amount of memory available after garbage collection.
Reduction%The percentage of memory saved by the garbage collection run.
FunctionThe name of the function which garbage collection was run on.
Class (not shown in this example)The name of the class which garbage collection was run on.

Available Settings

The extension adds three new Xdebug settings; these are:

  • xdebug.gc_stats_enable: This enables the collection of garbage collection statistics, which is disabled by default. The file name and directory where the statistics are written are configurable by xdebug.gc_stats_output_name and xdebug.gc_stats_output_dir respectively.
  • xdebug.gc_stats_output_dir: This sets the directory where the statistics file is written to. Note, this setting can not be set with ini_set().
  • xdebug.gc_stats_output_name: This sets the name of the file that the statistics are written to.

In Conclusion

While not something that PHP developers have to give much consideration to, as a routine matter of course, Garbage collection is still something that can be essential to know, if we are to ensure that our applications perform as optimally as possible.

If you want to know more about it, make sure you refer to the PHP manual and the other links in the further reading section below.

Further Reading

Improving Magento 2 Performance

This summer we worked together with David on the performance of a Magento 2 project and found some general improvements that the whole Magento community will benefit from.

Plugins querying the current Magento Version

Many plugins support multiple minor versions of Magento (2.0, 2.1, 2.2 or 2.3) and may need to check the version of core, to invoke slightly different behavior that changed over the different versions.

As a plugin developer, this is possible by calling ProductMetadata::getVersion() inside your code or plugin. However, this method is not just a “getter” like its name suggests, but it actually performs a quite expensive operation.

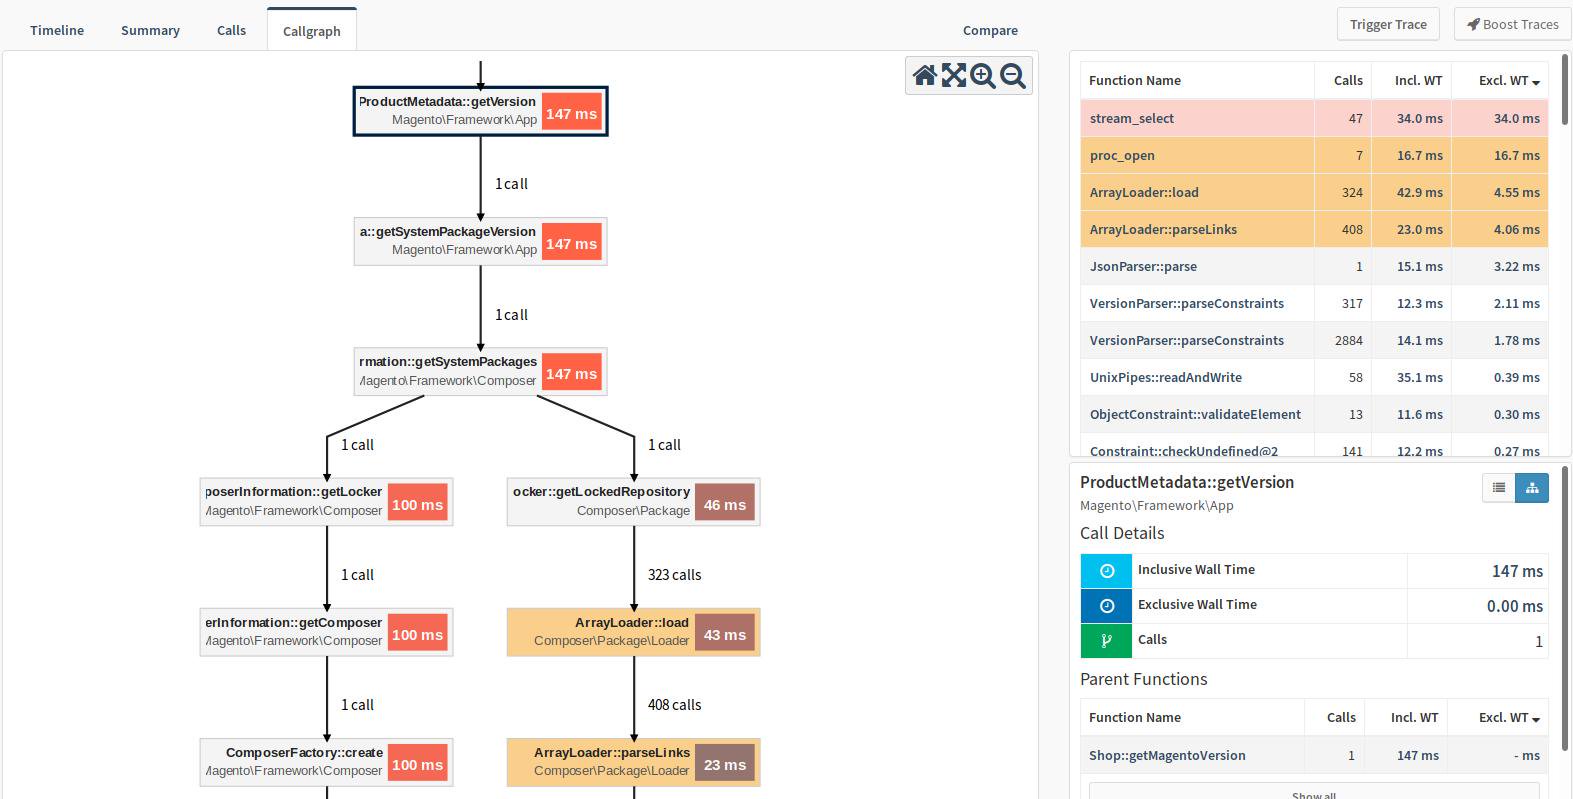
See in this Tideways callgraph, that the call takes 174ms for the request of our customers shop:

The reason is here that the method actually uses the Composer API to query the version of Magento, instead of returning a fixed constant. The Composer API used loads all package versions, this can include packages that get their version set by Git branch, which causes Composer to do a shell call to git to retrieve the version.

Again naming strikes as a hard problem of software engineering here. Especially for public APIs of frameworks that are used by different developers than the authors, it is important to set expectations about the performance by naming methods well. If the name would have been extractVersionFromComposer(), then plugin developers would maybe have realized the negative performance implications much earlier.

Now, thanks to David’s Pull Request to Magento, the return value of this method will be cached indefinitely across requests since version 2.3.4, fixing the bottleneck after 4 years in a stable Magento releases.

If you still run lower minor versions of Magento, you can fix that problem by overwriting getVersion() to return a harcoded value, for example 2.2.2.

Implicitly Resetting Magento Compile Step

What we realized looking at the callgraphs was that a lot of code was using development-environment factories, even though the container was built with the command setup:di:compile and should be in production environment.

This was caused by the command module:enable -all executed after the compile step and resetting the cache partially. In hindsight it makes sense that the compile step generates the config cache for the current configuration, and when you enable modules then the compile step needs to be re-executed.

As for the specific shop we worked on, response times dropped as much as 700ms from 1 second to 300ms by caching the call to getVersion() and fixing the DI cache.

A New and Improved Application History

Tideways history functionality is still mostly based on the features available 4 years ago, before we introduced Services and Environments, Downstream Layers and many others.

Time for a redesign of the history to include support for all the features and data that are available now. By using the UI elements from the performance overview we also introduce a familiar look and feel, where the previous history screen used its own widgets.

New Tideways History screenNew Tideways History screen

What’s new?

Next to the production environment and the default service data, we now save history data for all services and for all environments that the application contains.

See history for all Environments and ServicesSee history for all Environments and Services

We also introduce the familiar time explorer component to allow navigation in the history. This helps provide a good visual overview of the performance in the last weeks and months.

In addition to the regular 95% percentile performance data, the history now also stores the downstream performance data in the history on an hourly basis. This way you can compare how the performance of different layers changed over longer periods of time. For the Pro plan, this includes downstream data for every transaction.

Lastly, Exception data is finally part to the history. You can now see Exceptions and their number of occurrences in each service on a daily basis in the history.

See list of all Exceptions in HistorySee list of all Exceptions in History

Transaction History

Several users kept asking us to provide more historical information on individual transactions, currently only a few with the highest impact are stored.

Transaction History for Standard and Pro plansTransaction History for Standard and Pro plans

For the Standard and Pro Plan we now also store hourly data for every single transaction in your application. This is paired with a new dedicated history screen for each transaction where you can compare the long time performance.

Timezone Aware History

Previously, the history was always anchored to UTC to determine when a day begins and ends. With the new history, we now support selecting the timezone that the application is primarily served from or the timezone that your team is based in. You can switch the timezone for all the applications that have been created before this feature from the “Application Settings” screen.

Change Timezone of Application for Daily and Weekly ReportsChange Timezone of Application for Daily and Weekly Reports

When changing, beware that the hourly data cannot be converted from old to new timezone that means midnight will always stay 0:00 UTC for the historical days before you changed the timezone.

Use Tideways for applications of all sizes with the new Flex plan

The PHP community is large and diverse in their approach to build and run PHP applications. We have seen hundreds of small applications running on a handful of servers and one product running on multiple clusters and hundreds of servers across the globe. Still, we believe all PHP applications regardless of size benefit from monitoring, profiling and exception tracking functionality.

That is why we introduce a new Flex plan today starting at 69€ / month, to complement our existing pricing, and offer a high level of flexibility for everyone that wants to use Tideways.

As usual nothing changes for our existing customers and you can keep your current plans. Pricing per application is also still available for new customers.

Why we are adding Flex plans

For the last two years Tideways has been using a pricing based on the number of applications (or projects), with three different flavors “Basic”, “Standard” and “Pro” that are different in data retention, traces/minute limits and features. This works nicely for our customers with medium to large applications and provides a fair and predictable month over month price.

However, we quickly realized that medium to large applications don’t run in isolation.

There are a lot of small applications out there too, for example internal tools that support your product, WordPress blogs, CMS sites, playground projects. Agencies usually operate tens, if not hundreds of small applications for their many customers.

All of them need monitoring, profiling and exception tracking as well, but pricing individually at 89€+/month for each application turned out to be unrealistic value proposition.

Flex Plan with Request-Based Pricing

The new “Flex” Tideways plan includes unlimited applications, and is limited by a monthly PHP request limit across all Flex applications in your Tideways account. Flex includes the core functionality of Tideways suited for small applications, lower data retention and a small amount of slow traces/minute.

See the pricing page for a feature comparison between Flex (Request) and Application based pricing.

The Flex plan starts at 69€ / month for up to 5 million PHP requests across all applications combined. If you want to have a higher monthly PHP request limit, you can also upgrade to a Flex plan with 20 million PHP requests for 129€, or even 75 million PHP requests for 299€ / month.

Accounts with Mixed Request- and Application-based Pricing

Should your applications with the Flex plan grow larger and cause the monthly limit to be reached, you can always convert the ones with a high monthly PHP request volume to application based pricing with the existing Basic, Standard or Pro licenses. All Tideways accounts allow a mix of applications with Flex (Request) and application based pricing.

We have thought a while about this mixed pricing model, because offering two completely different approaches introduces some obvious complexity. Our previous plans offered just request-based or application based pricing and neither of them alone allows us to serve the diversity of companies in the PHP community well. This new model now offers the flexibility for small and larger companies and for agencies, e-commerce and product companies.

Do you have questions about our pricing? Please don’t hesitate to write us at [email protected] and we get back to you.

Trigger Trace 2.0 Preview: What’s New

Last year we asked all our customers what they think we should work on and “Triggering Traces” came out on top. We started planning a prototype in Winter last year and are ready to share the current state and a few ideas ideas as we launch the beta program. The general release date is planned for late February/March.

The Problem to Solve

To allow you investigating performance problems, Tideways collects traces from users, sampled to a limited number every minute and allows developers to trigger traces manually using the Chrome Extension or a CLI command.

But sometimes it is not that easy to trigger a trace, and there isn’t exactly the right one available from randomly sampled application requests.

We want the triggering of traces to be as simple as clicking a button or calling one command and you get a trace a few seconds to minutes later when any user of your site triggered the endpoint you are investigating.

So we want Breakpoints, but for Profiling, also commonly known as tracepoints.

Boost Traces of Selected Endpoints

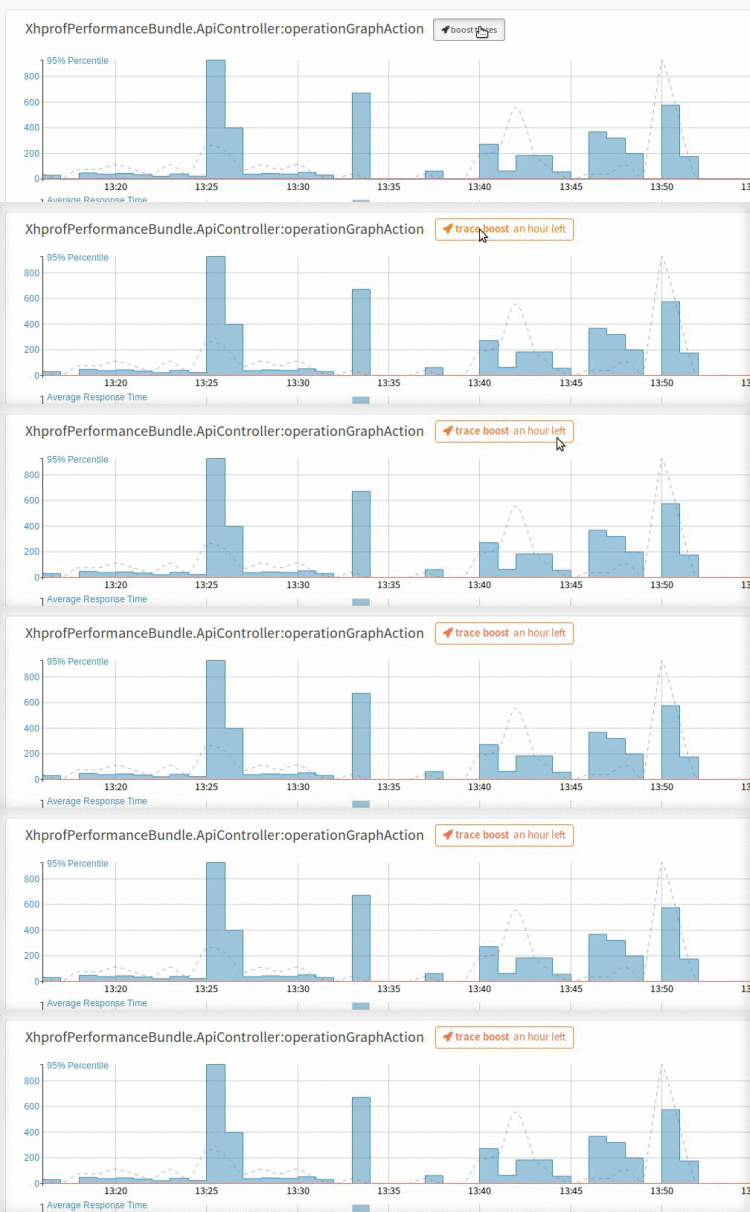
The first pillar of our quest for better trace triggering is what we call “Trace Boosting”. When inside a transaction/endpoint, you will see a button to “Boost Traces”, which massively prioritizes traces of this endpoint being sent from a daemon to Tideways.

Boost a TraceBoost a Trace

You will be able to configure additional criteria when a trace should be boosted, for example only when slower than 500ms, when on specific hosts, urls or when any custom variable matches, for example userId equals 123.

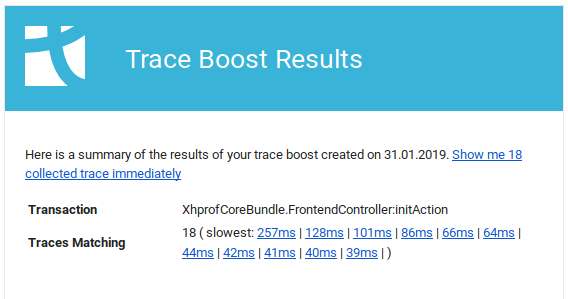
These boosts run for an hour by default and will send you notification e-mails when the first matching trace is collected and a summary when the boosting period is over.

Trace Boost Report after 60 minutes via e-mailTrace Boost Report after 60 minutes via e-mail

This will give you access to timeline traces in a much more controlled way. But it still relies on traces being randomly sampled by the PHP Extension. If you set a sample rate of 20%, this means only 20% of the requests are evaluated against the trace boosting criteria, and maybe more importantly they only contain timeline profiling data, not function/callgraph level data.

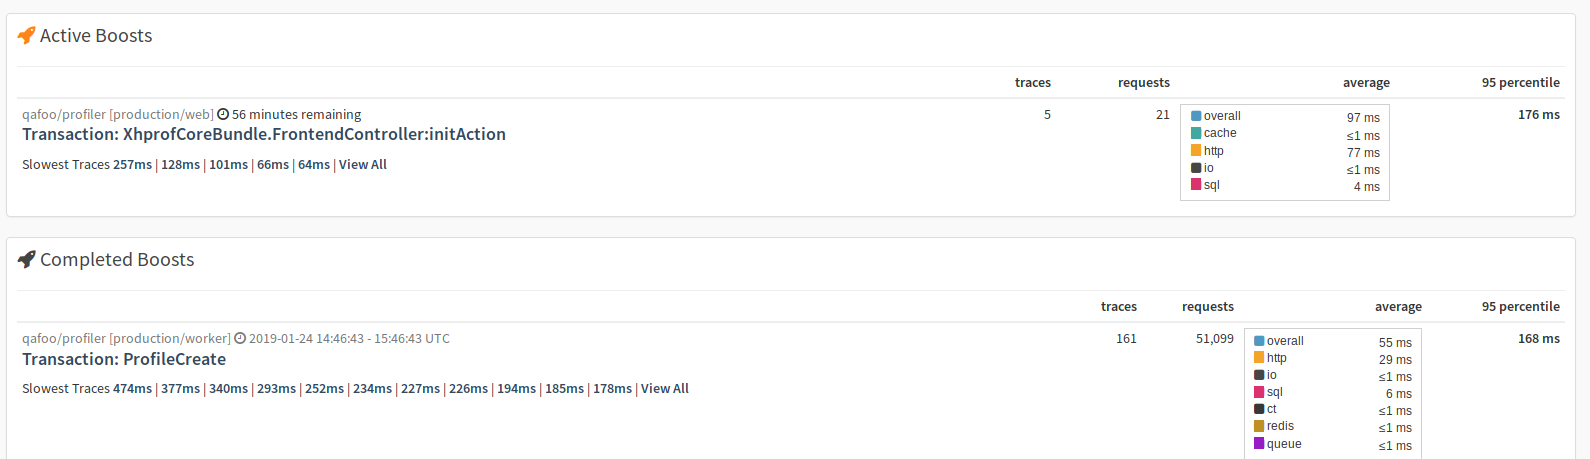
For the first time we will also have a screen that is specific to your user, listing all active and past trace boosts to let you get back to your specific profiling session.

List of active and completed trace boostsList of active and completed trace boosts

This screen is actually very exciting to ship, because we realized how a user-centric view of traces could massively improve the profiling workflow in general.

Tracepoints

The second pillar is a way to dynamically increase sampling and callgraph profiler activation in selected requests. For this functionality we are working on a feature we call “Tracepoints” that can be used standalone or in combination with “Trace Boosting”.

For a tracepoint you specify an entry point (script name or request uri), a new sample rate and optionally a function name that starts the Callgraph Profiler when called, for example main() or for example a controller name AppDefaultController::indexAction.

Tracepoints are synchronized back to the PHP extension in regular intervals.

Control via REST API and CLI

With trace boosts and tracepoints you get much more control over profiling with Tideways and to make it even more powerful, you can also trigger these features either directly using a REST API or with the “tideways” cli:

$ tideways trace:boost acme/demo-app "AppDefaultController::indexAction" 

Which is the same as clicking the boost trace button in the UI for this endpoint. Or for a tracepoint:

$ tideways trace:tracepoint acme/demo-app "/foo/bar" --sample-rate=100 --callgraph=AppDefaultController::indexAction 

Which triggers a callgraph on page /foo/bar with a sample rate of 100%.

Want to see it in action?

We are just finishing the internal alpha of this feature and are looking to roll out a beta version of some functionality to testers. If you want to get into the first batch, send us a ping to [email protected]. We will then activate this feature for more and more customers and incorporate their feedback for the final release sometime in March.

Adding Spryker Commerce Support

We are happy to announce that our latest version of the Tideways extension (v5.0.22) includes support for the Spryker E-Commerce Platform through fully automated instrumentation and hooks into the core of Spryker.

With the complexity of a large E-Commerce project, different channels, multiple language stores and landingpages for campaigns it is especially difficult to get a full view of the performance and errors from within your software as a project manager, developer or system administrator.

Tideways instrumentation automatically groups requests for either Zed (backend) and Yves (frontend) services and separatly tracks the performance for each Spryker Store so that you can excatly find out which store and page is slow.

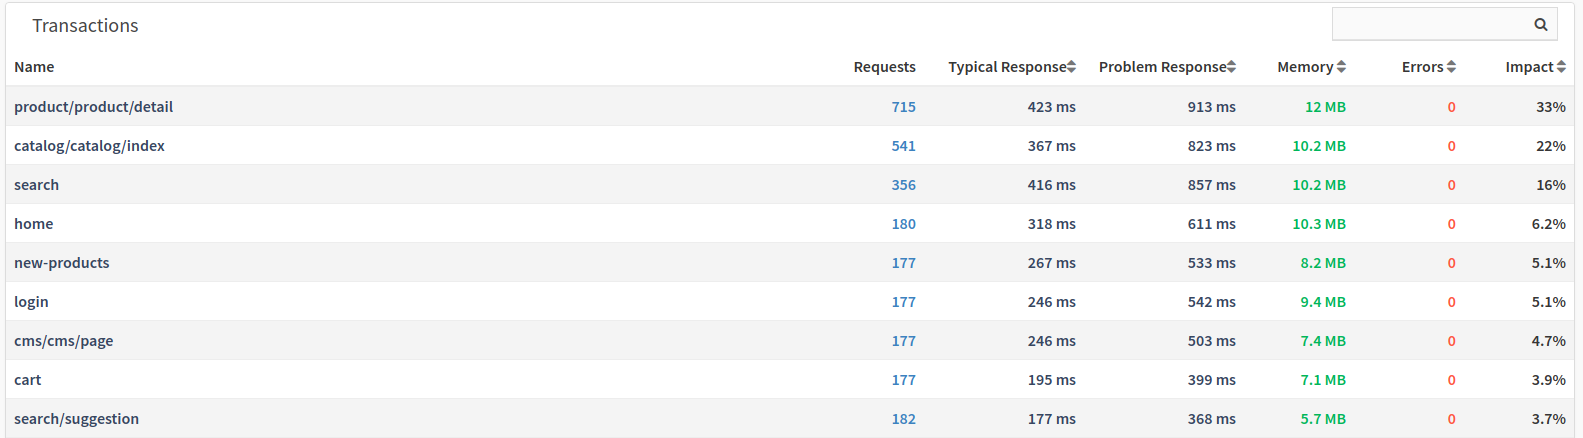
Transaction/Endpoint names based on the different pages in Spryker are automatically detected and allow you to find out which pages of your e-commerce funnel need optimiziation.

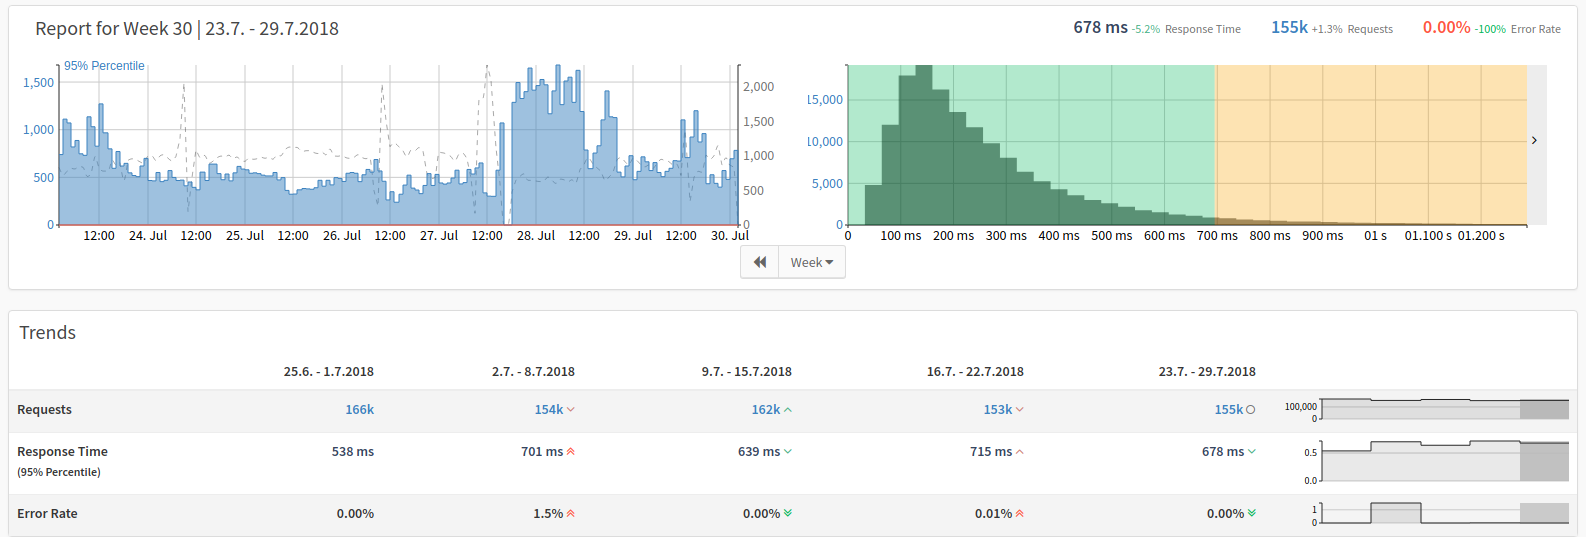
With the weekly report you get all this performance information on Monday morning, including details about medium and long term trends of the performance.

Did you find a slow endpoint? With The Tideways Profiler you can immediately see the causes of slow pages looking at individual SQL, Redis or Elasticsearch queries, Propel ORM commands, Controllers or Twig Templates.

Tideways also integrates with the Spryker Vagrant VM to provide a unique out of the box experience for developers that can automatically view performance and profiling data on their development environment separated from the production data.

You can start a 30 days trial to test Tideways with your Spryker shop.

New: Downstream Service Monitoring

Having detailed response time percentiles and impact analysis for transactions is great. But often it’s not the php application that is causing unwanted spikes in response times rather than services used by your application, such as MySQL, redis, HTTP APIs and so on.

As of now, you can see problems with these ‘downstream services’ at a quick glance:

Downstream services include the following layers so far:

  • SQL (PDO, ext/mysql, ext/mysqli, db2, oci8)
  • Memcache
  • Redis
  • MongoDB
  • File I/O (all local file operations)
  • Queue (beanstalk, amqp)
  • HTTP (all HTTP communication: includes external APIs, elasticsearch, …)

It’s worth noting that downstream services is taking all requests into account, not only those with sampled traces. This was made possible by our new and completely rewritten php extension (version 5.x).

How do I get Downstream Services?

Just update tideways-php and tideways-daemon to the newest versions and the data will be collected automatically. No separate configuration is needed. Until September you need to update your Apt or Yum repository endpoint to our new location to get version 5.

New Tooltip Information

Downstream service layers are integrated in a second graph on your application’s main performance view, showing average response times and what percentages are allocated by the different services. All relevant information was added to the existing tooltip: you can see percentiles and average response time, as well as the number of errors occurred and all downstream service timings. If a single service makes up more than 30% of the total response time, it is specially highlighted (e.g. SQL in the screenshot above).

Average vs. Percentile Response Times

Percentiles are really good for spotting negative outliers in your requests, but you cannot stack percentiles correctly: e.g. 95% percentile for SQL + 95% percentile HTTP might be larger than the 95% percentile of the overall response time. That’s why we display downstream services in a separate graph, using average response times. As a bonus, you can now compare percentiles with average response times side by side.

What’s next?

We have already more ideas, what to do with downstream service data.

Downstream services data can be displayed per transaction when you upgrade to the “Pro” plan, giving you even more insight since service usage within one transaction is usually quite consistent and spikes in a single service most likely indicate problems with that service.

To get a better feeling for long time performance trends we plan to incorporate downstream service data in daily/weekly/monthly history views, as well as the weekly reports. We are also evaluating the possibility to use downstream service data for additional alerting options.

Also, we are testing the idea of specialized views per downstream service layer, to give you a completely new perspective on your performance data, e.g. analyzing SQL performance in detail.

These new features will be added within late 2018 / early 2019, we will keep you posted!

The difficulty of Memory Profiling in PHP

Did you ever have a memory leak in your PHP program and couldn’t locate the exact source in your code? From my experience with memory profiling in PHP, this is caused by the PHP engine and how it manages memory.

PHP uses a custom memory manager on top of the native memory management in C for multiple reasons:

  1. Better performance by allocating larger blocks of consecutive memory
  2. Ability to easily implement shared nothing, freeing all memory at the end of the request

So if you create a new string of size 200 KB (or any other kind of variable) in a function of your program, three things could happen in the PHP engine:

  1. The current and peak memory of the script are (nearly) the same, then the PHP Memory Manager needs to go to the kernel to allocate more memory and in turn the peak memory usage increases by (roughly) 200 KB.
  2. The current memory usage of the script is much lower than the peak memory that was allocated due to previouvly executed functions. PHP can re-use the memory and doesn’t need to talk to the kernel.
  3. The garbage collector could trigger and make the function look like it actually decreased memory usage.

This makes it difficult to find out about memory problems by looking at the changes of memory_get_usage() and memory_get_peak_usage() between function calls, because it highly depends on how your program is structured to understand where memory is allocated and freed. Sometimes it is obvious to see in a memory profiler but often it is not.

New Allocation Memory Hooks in PHP 7

This is why I was excited to see that PHP 7 easily allows to hook into the Memory Manager and count the number of allocations and memory. We added this feature to our XHProf fork last week.

Counting allocations is how most Ruby Memory Profilers work, so I hoped that their approach would yield better results.

Turns out, it does not yield good results.

Looking at two Composer runs in comparison between v1.3.3 and v1.4, which included a huge memory optimization , I realized that while peak memory is only 260 MB (1.3.3) and 120 MB (1.4), measuring the total amount of allocations both versions need 733 MB (1.3.3) and 859 MB (1.4) respectively.

So while Composer 1.4 allocates more memory in total, it does so in a way that only needs 40% of peak memory at the same time, which leads to a performance improvement. Allocating memory that the kernel already provided to the PHP script is not nearly as big a problem.

That means looking at total allocated memory can be quite misleading, because it is possible that its freed immediately and doesn’t affect the peak memory level.

The same is true for looking only at memory_get_usage(), because again for the most memory hungry function it is much larger on Composer 1.4 (322 MB) than on 1.3.3 (149 MB) even though peak memory usage is halfed.

The problem with the memory_get_usage() profiling approach is that we have no way of correlating if a function creates memory and its kept around permanently until the script ends, or if its (almost) immediately freed.

You just have to hope that looking at increases in memory_get_peak_usage() for each function points you to the memory leak.

Correlating allocation and free with php-memprof

If memory_get_peak_usage() is of no help there is another approach.

The alloc/free correlation problems can be worked around by using php-memprof extension, which allows to find out how much memory a function has allocated that is still in use at the end of the script.

It does this by keeping a large internal structure of every single memory allocation that happend during the execution of a function. I haven’t tested the CPU and memory overhead, but I assume this intensive approach prohibits its permanent use in production.

Improved Time Explorer

We have just rolled out an improvement to the Time Explorer, the low precision (15 minutes) chart that is rendered in the Dashboard and Application view with performance data for the complete retention period of your plan.

It is now shown directly below the the head navigation now and stays there when navigating through to snapshots or transaction details screen. Additionally it now includes the service and environment switchers that have been part of the main application graph before.

With this change the navigation of monitoring data is much more smooth and you don’t loose the context anymore by a complete re-render when selecting a timeframe.

On plan with just 1 day retention no time explorer is rendered and you can still navigate the time using the four period lengths on the right, top side of the new navigation box.

Testing a new approach to Memory Profiling in PHP with XHProf

Memory profiling in PHP has traditionally been hard. Most memory profilers compare the memory or peak memory before and after a function call to find out how much memory usage increased or decreased. This can be achieved by calling the equivalent of memory_get_usage() and memory_get_peak_usage() functions from within the profiling extension.

But this approach has one major blind spot, when a function allocates a lot of memory but also frees it again.

With PHP 7 there is a new hook into the Zend memory allocator that allows us to count the number of memory allocations, memory frees and the size of all memory allocations. We originally saw a similar approach to this in Danack’s MemTrigger extension and adopted it to fit the XHProf datastructure.

We have added experimental (!) support for this new approach to memory profiling into our open-source XHProf extension and are looking for feedback from you, if this collected memory data provides a more useful way of finding memory problems.

To use this feature with one of the existing XHProf UIs, you can call the Profiler with:

<?php

tideways_xhprof_enable(     TIDEWAYS_XHPROF_FLAGS_MEMORY_PMU |     TIDEWAYS_XHPROF_FLAGS_MEMORY_ALLOC |     TIDEWAYS_XHPROF_FLAGS_MEMORY_ALLOC_AS_MU ); 

The second flag will enable the allocation based profiler and store the data in the “mu” key that is already processed by all the existing UIs. This way no additional changes are necessary to your stack to get first feedback.

If you use the TIDEWAYS_XHPROF_FLAGS_MEMORY_ALLOC instead, then three additional keys are part of the XHProf payload for each parent+child function pair:

  • mem.na The sum of the number of all allocations in this function.
  • mem.nf The sum of the number of all frees in this function.
  • mem.aa The amount of allocated memory.

With our CLI tool for analying XHProf data (sorry, no binary releases yet) we can then render this data much like Latency or Memory to get a result similar to this example:

FUNCTION COUNT NUM ALLOC ALLOC AMOUNT NUM FREES
ComposerAutoloadincludeFile@1 105 130952 43371.22 KB 137090
array_change_key_case 184 22635 3291.38 KB 0
ComposerAutoloadincludeFile 114 18888 23357.67 KB 19252
ComposerAutoloadincludeFile@3 14 11328 4831.90 KB 12025
each 2686 9052 901.87 KB 0
Smarty::fetch@1 26 9033 5560.42 KB 9032
PDO::query 101 8963 2786.97 KB 1107
ComposerAutoloadincludeFile@2 19 8186 4940.82 KB 8799
ComposerAutoloadincludeFile@5 3 5557 1724.64 KB 5935
explode 624 4643 367.98 KB 55
is_readable 427 4393 146.58 KB 4408
Smarty::_smarty_include@1 5 3920 2578.56 KB 3927
OxidEsalesEshopCommunityCoreModelBaseModel::_getFieldLongName 1722 3468 152.72 KB 2876
OxidEsalesEshopCommunityCoreModelBaseModel::_setFieldData 1397 3271 183.32 KB 3207
smarty_core_load_plugins 41 3054 3904.06 KB 3055
preg_match 580 2954 234.51 KB 1227
OxidEsalesEshopCommunityCoreField::__construct 1440 2942 486.25 KB 56
file_exists 374 2637 140.97 KB 2621
main() 1 2446 1611.23 KB 2569
OxidEsalesEshopCommunityCoreStrMb::preg_replace 658 1970 91.58 KB 2108
trim 2431 1936 65.45 KB 0
OxidEsalesEshopCommunityApplicationModelCategory::_setFieldData 641 1924 90.27 KB 1968
strtolower 3056 1802 76.48 KB 0
Smarty::_smarty_include 5 1715 969.62 KB 2253
OxidEsalesEshopCommunityCoreUtils::getLangCache 1 1710 351.24 KB 1712
func_get_args 713 1431 223.44 KB 0

Please write your feedback to the Issue Tracker of the XHProf extension or directly to [email protected]

Releasing New Tideways XHProf Extension

We have just pushed the beta of a new version 5.0 of our XHProf fork to Github. It is rewritten from scatch with a modern code-base that makes use of PHP 7 internals and includes major datastructure improvements.

Tests with a WordPress installation show callgraph profiling overhead to decrease by 20-50% for this new extension. The extension also moves several data transformation out of your applications hot execution path so that individual function calls should have more accurate measurements.

Your own improvements may vary based on your code base, hardware and usage patterns, but every use-case should have significantly less overhead than before.

Separating XHProf and Tideways extensions

With the 5.0 version of the Tideways PHP extension, we are separating the open-source extension to generate XHProf compatible profiling data from our own timeline/tracing Profiler, so we can work on improving them independently.

This is why the now released Tideways XHProf open-source extension has a new name tideways_xhprof, while the existing extension name tideways will continue to be used for our software as a service / product.

As an open-source user of Tideways, an upgrade to the new version requires you to slightly change your code to adjust for the new extension and function names:

 <?php

-if (extension_loaded('tideways')) { -    tideways_enable(TIDEWAYS_FLAGS_CPU | TIDEWAYS_FLAGS_MEMORY | TIDEWAYS_FLAGS_NO_SPANS); -    tideways_disable(); +if (extension_loaded('tideways_xhprof')) { +    tideways_xhprof_enable(TIDEWAYS_XHPROF_FLAGS_CPU | TIDEWAYS_XHPROF_FLAGS_MEMORY); +    tideways_xhprof_disable();  } 

In addition the extension needs to be loaded by its new name extension=tideways_xhprof.so.

We are sorry this separation couldn’t be done in a backwards compatible way. You can keep using the old tideways extension from the 4.x branch of Github, but we will not update it for new PHP versions anymore and you don’t benefit from the performance improvements.

One immediate benefit arising from this is Windows support for all versions of PHP 7.0, 7.1 and 7.2 for both NTS and ZTS. You can even download pre-compiled binaries from AppVeyor Artifacts tab of each build.

Because parts of this code-base is shared with our own new tideways extension and we want to continue to give back an open-source based PHP Profiler to the community, you can expect us to continue the support of this extension in the future. We plan to extend its compatibility to more platforms and adapt it to Zend Engine changes for future PHP versions.

No changes for Tideways Customers

Are you a tideways.io customer? Then nothing changes for you. Install and upgrade the tideways extension from our list of prebuilt packages on the download page. You can find the old extensions source code in the 4.x branch on Github. The tideways-php dpkg and rpm packages from our package repositories will always ship only the tideways extension used with the service.

The new tideways version 5.0 extension will be released in the next weeks and we will make a dedicated announcement about this release and all its improvements.

How does the PHP Realpath Cache work and how to configure it?

The realpath cache in PHP is often overlooked and its exact workings are a bit of a mystery to many developers, fueled by a lot of explanations on the web that are just plain wrong.

How exactly is the realpath cache working and at which level of PHP? There has been some buzz around realpath cache in the last weeks, so it is a hot topic to look into.

First, The PHP 7.2 changelogs contain a small note about the realpath cache size, raising the question what about the previous default in pre 7.2 deployments and if you should look into changing it:

realpath_cache_size: Set to 4096k by default

The previous default was just 16k, a 256x increase is significant. This change was also backported to PHP 7.0 and PHP 7.1 patch releases in January.

Second, the blog post “Is it all Opcache’s fault?” on the facile.it Engineering blog identifies the realpath cache as a potential problem during symlink deployments. Knowing about this issue is important when building your own deploy strategy.

Time to dive into the realpath cache, how it works and how to configure it once and for all.

If you are fluent in C you find all the answers in Zend/zend_virtual_cwd.h and Zend/zend_virtual_cwd.c files in php-src, in this blog post I am trying to explain this in plain (technical) English.

First myth buster, the realpath cache is not actually used just by the PHP realpath function. It triggers in many of the filesystem functions when using the file:// stream wrapper. The most important ones being fopen, file_get_contents, is_file, is_dir, require, require_once, include and include_once.

Whenever these functions are called, PHP makes a lookup in the realpath cache for an entry that could look like this when retrieved from realpath_cache_get():

'/var/www/wordpress/wp-includes/class-walker-category.php' =>    array (size=4)       'key' => int 6963295217931825180       'is_dir' => boolean false       'realpath' => string '/var/www/wordpress/wp-includes/class-walker-category.php' (length=56)       'expires' => int 1507388147 

You can see this cache helps with finding out the realpath, directory or file status of a file even when the accessed file is not a symlink (meaning filename and realpath are the same). It makes sense to always store entries, even if the file is not a symlink, because we can avoid a file I/O call this way.

Configuration of Realpath Cache

So how can you configure the realpath cache? Two options are available:

  1. How long is an entry stored in the cache? (realpath_cache_ttl)
  2. How many entries can be stored in the cache using a maximum number of bytes, not a maximum number of entries value. (realpath_cache_size)

The time to live defaults to 120 seconds. any change to a symlink might be invisible to a PHP process for this amount of time. A cache hit does not extend the time to live, so it doesn’t make sense to set the realpath_cache_ttl to just a few seconds even on servers under constant load. I think the default is OK and doesn’t need change.

The cache size in bytes can be confusing to understand, because the realpath cache is stored on the process level not in shared memory like Opcache.

A simple calculation explains this: Are you using PHP-FPM or Apache/mod_php with a worker size of 100? Then the realpath cache of 4096K can lead to a total cache memory size of 100 * 4 MB. The memory used by the realpath cache is not pre-allocated, that means the memory requirement is not automatically adding 4 MB for every PHP process, it will just use the memory it needs up to the maximum size.

Be careful: Because the cache does not use the PHP memory managers API, you will not see the realpath cache memory being used in memory_get_peak_usage();. You can see the current size of the realpath cache for the process currently executing with the function realpath_cache_size();.

Also, all realpath cache realted functions only work on the current process: realpath_cache_get(), realpath_cache_size() or even clearstatcache() when used with the realpath flag.

How many items can the cache hold? It depends on the length of the path begin cached. If the realpath is different than the path, then it stores two filepaths strings, otherwise just one.

For our previous wordpress entry example, we can calculate metadata size (56 bytes) plus the string length of 56 bytes = 112 bytes, which would allow the cache to hold around 37.000 items with a cache size of 4096K, but only about a hundred entries for a cache size of 16KB.

If we would use symlinks (as certain deployment strategies do, more on that in the facile.it post), then the cache can hold half the number of items, around 18500 (assuming path length is roughly the same as realpath length).

So 4096K is usually more then enough, even for applications using frameworks with a lot of files, like Symfony, Zend Framework, Laravel, Magento and so on. 16K however is much too small.

Rule of Thumb: Always have a realpath cache that can hold entries for all your files in memory. If you use symlink deployment, then make it double or triple the amount of files.

Next week I will write about realpath cache pitfalls, if you want to be in the loop you can subscribe to our newsletter on PHP performance right below.

Environments are back: Monitor and Trace Staging, QA and Dev Servers

We think monitoring and tracing should be performed across the whole application lifecycle and that it should be easy to compare changes between production, staging/QA and production environments.

But for technical reasons we had to remove explicit support for multi-environment monitoring and tracing almost 2 years ago, when our backend and worker jobs couldn’t handle the data from our original prototype data model.

Since back then we recommended to create additional applications for each environment, which was a “hack” that made comparisons between the different environments impossible and required us to introduce additional concepts such as “Staging Applications” when we introduced our new application based pricing model in March 2017.

This week we re-introduced Environments as a feature into Tideways. Every application with a “Basic” or “Standard” license can now monitor and collect data separately from the production servers into individual environments. You can have an unlimited amount of different environments and a limited amount of them active at the same time (based on the license). Using settings in the UI or a REST API you can control the active environments and integrate them into your development or continuous integration workflow easily.

Switching between environments in the UI is then as simple as using the Service/Environment switcher in the application’s main screen, see an example of that for our own Tideways Profiler application in this screenshot:

Using the “Compare Trace” functionality you can now select traces between different environments. The Trace List screen has a new filter for the environment to make the selection simple.

Over the next weeks we will add more functionality to compare environments with each other for performance degradations both manually from the UI and automatically via notifications and hooks.

See the documentation on how to get started with Environments. We recommend everyone using staging applications today, to migrate to environments.

Improved Dashboard with Preview Chart and Recent Performance Metrics

We have improved the dashboard in Tideways to include preview charts with the last 24 hours of performance data and the performance of the most recent 15 minute interval. This provides you with a much better overview of all your applications and by selecting any time range in the preview chart you can directly jump to a time-range that interests you.

New Dashboard with Preview Charts for demo organizationNew Dashboard with Preview Charts for demo organization

In this screenshot you can see the dashboard for our current set of five demo applications.

This feature is immediately available for all applications with Lite, Basic and Standard licenses (not staging applications) and for all old request-based plans of sizes “Small”, “Medium” and “Large” (not for the “Extra Small (XS)” plans).

Using php-fpm as a simple built-in async queue

There are many tasks that a web-request should not perform directly so the user doesn’t have to wait many seconds for a response. Examples include sending emails, uploading images to a CDN, resizing images or making expensive call to external services and many more depending on your use-case.

The usual advice you find on the internet is to setup a queue such as RabbitMQ, Redis, Kafka, Gearman or Beanstalkd. But this means another service that you need to install, setup, maintain and monitor. With some of the queue systems operating them includes a steep learning phase that requires time and money for additional hardware.

But maybe you just need a poor mans version of an asynchronous queue without all the overhead? Then why not just use PHP-FPM itself?

Maybe you are hosting on a platform that either runs only web-requests or makes it difficult to start and communicate with workers?

Granted, this is more of an experimental approach, but I think it is a perfectly valid way to use PHP-FPM sockets.

PHP-FPM already acts as a queue for Nginx/Apache FastCGI clients. While your web-request is running you can just send another FastCGI request to the same PHP-FPM socket asynchronously and non-blocking. This request is immediately executed in another php-fpm process in parallel and you could wait for it to complete or just fire and forget.

The good news: There is already a PHP library that support you with this task, so that you can skip learning about the FastCGI protocol, how to do asynchronous streaming in PHP and get going immediately with just a few lines of code.

The author Holger Woltersdorf has additional blog posts that combine his library with Redis or RabbitMQ, my experimental solution skips these middleman and talks directly to PHP-FPM without requiring another queue.

composer require hollodotme/fast-cgi-client:^1.0 

Then in a web-request just the client to send an async request:

<?php
// /var/www/index.php
use hollodotmeFastCGIClient;
use hollodotmeFastCGISocketConnectionsUnixDomainSocket;
use hollodotmeFastCGIRequestsPostRequest;

$connection = new UnixDomainSocket(
    '/var/run/php/php7.0-fpm.sock', 5000, 5000
);
$client = new Client($connection);
$content = http_build_query([
    'task' => 'SendMail',
    'payload' => json_encode('...')
]);

$request = new PostRequest('/var/www/worker.php', $content);
$client->sendAsyncRequest($request);

In the worker.php script we are calling, we can unpack the payload and delegate it to a handler:

<?php
// /var/www/worker.php
namespace MyProjectCommands;

class SendMailCommand {
    public function handle(array $payload) {
        // send mail here
    }
}

$class = sprintf('MyProjectCommands%sCommand', $_POST['task']);
$command = new $class(json_decode($_POST['payload'], true));
$worker->handle($command); 

Voila! We have built ourselves a simple asynchronous queue.

The code is intentionally simple, you can add a layer of abstraction around this if you want to improve the code, add error handling and more.

There are obvious downsides to this approach that I don’t want to sweep under the rug:

  • Most important, this is an experimental approach, since this is not the primary way of using php-fpm.
  • Your long(er) running worker jobs can block legimate web-requests from execution and take away resources from your webserver unless you increase simoultaneous requests per pool, setup another FPM pool for this or talk to a remote PHP-FPM.
  • Jobs are not persistent and there is no retry for failed tasks or built-in metrics for monitoring. You can however build all this into your setup yourself. For monitoring, Tideways works out of the box with this approach and can monitor response, error-rates and collect traces for you.

For simple asynchronous tasks such as sending a registration or password forgotten mail, sending requests to third party analytics services or uploading images to a CDN this approach is a nice workaround before starting with more complex queuing setups. If you are willing to live with the downsides then you already have a “perfect” queue with php-fpm.

How to optimize the PHP garbage collector usage to improve memory and performance?

The behaviour of PHP’s Garbage Collection (GC) can be a small mystery and you might wonder how it works and if you can optimize its usage for your application.

Is your script running out of memory and you are looking for ways to reduce it? PHP’s GC is a way to to reduce the memory of your script. However, arbitrarily littering your code with gc_enable(), gc_disable() and gc_collect_cycles() calls everywhere does not automatically help and obviously reduces the expressiveness of your code.

Do you know if the garbage collector is slowing down your requests or speeding them up? When does it get triggered automatically? How much memory does each run clean up?

Maybe you fear that your application is suffering from a similar inefficient garbage collection usage than Composer did three years ago, where selectively disabling the collector improved their performance by up to 90%.

Sadly, answers to these questions are not available to you from the PHP engine, unless you want to recompile with obscure debug flags. Yeah, no thank you!

Before I show you a tool to access all the necessary information, you should first understand the available optimization potential and trade-offs with PHPs GC. Because sometimes you need to enable the garbage collector and sometimes its better to disable it.

The following summary is as bare bones as it can get to understand PHP memory. Please see Anthony Ferrara’s post on “What about garbage” if you want to dive deep into this topic.

How does PHP cleanup memory?

  1. If a variable falls out of scope and is not used in any other place of the currently executed code anymore, then it is garbage collected automatically. You can force this early by using unset() to end variables scope early.
  2. If a variable is part of a cyclic reference, where A points to B and B back to A, then the variable can only be cleaned up by PHPs cycle garbage collector. It is triggered whenever 10000 possible cyclic objects or arrays are currently in memory and one of them falls out of scope. The collector is enabled by default in every request, but it can be toggled with the functions gc_enable() and gc_disable().
  3. If you call the function gc_collect_cycles(), then collection of cyclic references is triggered explicitly even if you don’t have 10000 of them in memory yet.

The optimal performance strategy is to enable the garbage collector when the GC can clean up as many possible (high efficiency, many cleanups) from the potential 10000 cyclic references and to disable it when it finds out that most of them are still used (low efficiency, few cleanups).

But how then can you find out if you need to enable or disable the garbage collection or not? As I mentioned PHP does not actually provide statistics about cleanup mechanisms 2 and 3.

The garbage_stats PHP extension

This is where our small PHP extension garbage_stats comes to the rescue. It is based on the garbage collection hook that I co-proposed with Adam Harvey for PHP 7 and up. Most of the code is extracted from our tideways extension and enhanced by a simple CLI mode to print statistics without requiring changes to your code.

Lets run garbage_stats with a version of Composer that does not disable garbage collection to simulate the previous bottleneck:

$ php -dgc_stats.enable=1 -dgc_stats.show_report=1 bin/composer update Found 157 garbage collection runs in current script.

Collected | Efficency% | Duration | Reduction% | Function ----------|------------|----------|------------|---------       796 |     7.96 % |  2.59 ms |     0.63 % | [..]::loadProviderListings         0 |     0.00 % |  0.91 ms |    -0.00 % | [..]::loadProviderListings         0 |     0.00 % | 17.19 ms |    -0.01 % | [..]::parseConstraints         0 |     0.00 % | 19.95 ms |    -0.03 % | ArrayLoader::load         0 |     0.00 % | 22.36 ms |    -0.02 % | Pool::computeWhatProvides         0 |     0.00 % | 30.40 ms |    -0.01 % | ArrayLoader::parseLinks         0 |     0.00 % | 29.05 ms |    -0.00 % | Rule2Literals::equals         0 |     0.00 % | 29.00 ms |    -0.01 % | [..]::createRule2Literals         0 |     0.00 % | 32.90 ms |    -0.09 % | RuleWatchNode::__construct         0 |     0.00 % | 35.08 ms |    -0.09 % | Solver::solve         0 |     0.00 % | 44.10 ms |    -0.09 % | makeAssertionRuleDecisions         0 |     0.00 % | 53.28 ms |    -0.01 % | Solver::runSat         0 |     0.00 % | 24.21 ms |    -0.00 % | Transaction::findUpdates       183 |     1.83 % | 31.34 ms |     0.01 % | Installer::doInstall         0 |     0.00 % | 24.10 ms |    -0.00 % | Installer::doInstall 

IEKS. The table only shows a selection of the 157 garbage collection runs, but except two of them they all collect 0 cyclic references when running and don’t reduce the memory at all while still running for 10ms and more. ICEBERG AHEAD! This is the use-case for calling gc_disable() during the whole execution of your long running script.

Contrast this with a simple test script that can efficiently clean up cyclic references with the this output:

Found 7 garbage collection runs in current script.

Collected | Efficency% | Duration | Reduction% | Function ----------|------------|----------|------------|---------         0 |     0.00 % |  0.00 ms |    -0.14 % | gc_collect_cycles     10000 |   100.00 % |  4.23 ms |    89.43 % | foo     10000 |   100.00 % |  3.32 ms |    89.40 % | foo     10000 |   100.00 % |  2.48 ms |    89.37 % | foo     10000 |   100.00 % |  5.01 ms |    89.33 % | Test::foo      9000 |    90.00 % |  2.50 ms |    79.74 % | Test::foo     10000 |   100.00 % |  3.15 ms |    81.36 % | Test::foo 

But what if your long running script does not fall into the fully efficient (~100%) or inefficient (~0%) section? The solution is simple and requires thorough work:

  1. With the garbage_stats extension, find out which section of your code is triggering the garbage collection inefficiently. In web requests you can use the function gc_stats() to get information about individual garbage collection runs.
  2. Call gc_disable() before a non GC-efficient code section is executed.
  3. Call gc_enable() after a non GC-efficient code section is finished and then gc_collect_cycles() to clean up.

Happy efficient garbage collection!

P.S.: Tideways is collecting garbage collection details across your application in production If you want to find out how garbage collection affects your user performance, sign up for a 30 days trial.

Improved Timeline Profiler with Stacktraces, Zoom and more

We just shipped a huge update to the Timeline Profiler in Tideways that improves the level of detail and usability of this core profiling feature. This is the first major step of several more updates to come in the next month.

First, we have added a clear parent-child relationship between timespans in the timeline, so that a child span is now rendered below its parent in almost all cases.

In addition we now show the list of parents of a selected span in the details panel:

Span in Tideways Timeline Profiler with a list of all its parentsSpan in Tideways Timeline Profiler with a list of all its parents

That is not the only information that we have added, with the release of PHP extension version 4.1.3 and daemon 1.5.8 we are now collecting the last 10 stack-trace frames of a span that takes longer than 50 milliseconds.

Stacktrace for a slow span in Tideways Timeline ProfilerStacktrace for a slow span in Tideways Timeline Profiler

You can configure this threshold to be lower if your application is very fast but we recommend it not be lower than 5-10% of your usual response time. We are still experimenting a little with the exact limits, but daemon and backend post-filter the amount of stacktraces depending on your plan.

The third improvement we shipped is a zoom behaviour for the timeline itself. When your trace has many small SQL or HTTP queries, potentially on various different datasources, then it helps to select just a portion of the timeline and look at the exact timings of each span more closely.

Using zoom is intuitive and uses a drag and drop behaviour to select the timeline.

Zoom into a Tideways Timeline ProfilerZoom into a Tideways Timeline Profiler

Introducing SQL and HTTP duration trace filters and advanced query language

Finding a specific trace you are interested in just got much easier with the addition of three new filtering features.

  1. You can now filter traces by duration or amount of executed SQL and HTTP queries in a trace:

    This allows you to find traces with SQL or HTTP behaviour that you are interested in.

  2. You can now view a list of the last 100 traces that you have looked at, or even filter it by additional criteria. You can find this option in the “User:” filter under the name “Last 100 viewed by me”.

  3. We have introduced a query language that allows you to filter by any field using a more complex set of operators and with the help of AND/OR conditions, to find exactly the traces you are looking for.

    You can find more details about the query language in the documentation.

In combination the response time, bottlenecks, events and service filters that we added last month, you now have much more filters at your disposal to find and fix problems in your application.

We are looking foward to your feedback and if you have ideas for new filters we are happy to hear from you, as we want to keep adding more filters in the future.

Profiling Laravel applications using the open-source Monica CRM as example

Tideways has powerful built-in instrumentation for Laravel, including Eloquent Models and Blade Templating language. To show this support we have added a demo application using the excellent open-source Laravel application Monica – a CRM for your friends and family. You can sign up for Tideways for free and take a look at this and other demo applications.

The Laravel demo is running on Heroku and using the Heroku composer package for Tideways. Pre-populated with some demo data, we run a complex Siege scenario to generate traffic on various read and write actions every minute.

Tideways framework detection automatically monitors performance, memory usage and requests from individual Laravel controllers and actions, with no code changes necessary:

Transaction performance of Laravel Application Monica CRMTransaction performance of Laravel Application Monica CRM

When you drill down to transaction traces, you can see the performance timeline of individual requests filled with detailed information about Laravel Events, Eloquent Queries and Blade Template renders.

In this trace for the People::edit controller, we can see that bootstrapping and loading the user object from the session takes the first third of the request, the controller itself takes roughly a third and then the view takes the last third:

Profiling Laravel Elqouent and Blade TemplatesProfiling Laravel Elqouent and Blade Templates

Clicking on the Eloquent User model timespan, you can see details which kind of operation was performed on the model:

Profiling Laravel Elqouent QueriesProfiling Laravel Elqouent Queries

And for the template you can see its filename:

Profiling Laravel Blade TemplatesProfiling Laravel Blade Templates

Tideways provides other Laravel specific instrumentation such as Session garbage collection, service provider bootstrapping time and the duration of all Laravel events. As a result you are always fully informed about the performance of your Laravel application and which performance problems to fix for the biggest improvement.

Try Tideways on your own Laravel applications and sign up for our 30 days free trial.

Filter traces by bottlenecks, response time, service and release events

We just improved the trace listing screen in Tideways and included four new filters.

First, You can now filter down traces based on the bottlenecks Tideways detected, for example slow or N+1 SQL queries, excessive compile or garbage collection times.

Second, you can filter traces by Release version. If you are using the Event API to create releases whenever you deploy a new version of your code, then you can now find all the traces that were collected during one or more releases.

Third, you can filter traces by Response time. Currently we support 5 common ranges, for example 0 – 50ms and 50 – 250ms. We are working on more advanced filter possibilities to allow any range that you want to filter for.

Fourth, you can filter traces by Service they where collected in.

As we are adding more and more filters, we have also improved the user interface to only show the filters that you are currently using. By clicking on the “Filters” button you can see a list of all existing filters and toggle the ones you need for your current task.